|
| | | | | | |
| | | | |
| Washington Real Estate Investment Trust | |
| Fourth Quarter 2016 | |
| | |
| Supplemental Operating and Financial Data | |
| Contact: | | 1775 Eye Street, NW | |
| Tejal R. Engman | | Suite 1000 | |
| Director of Investor Relations | | Washington, DC 20006 | |
| E-mail: tengman@washreit.com | | (202) 774-3200 | |
| | | (301) 984-9610 fax | |
| | | | | | |
|
|
Company Background and Highlights |
Fourth Quarter 2016 |
Washington REIT (Washington Real Estate Investment Trust - NYSE: WRE) is a self-administered, self-managed, equity real estate investment trust investing in income-producing properties in the greater Washington, DC region. Washington REIT is diversified, as it invests in office, retail, and multifamily properties and land for development.
Full Year and Fourth Quarter 2016 Highlights
| |
• | Reported net income attributable to the controlling interests of $119.3 million for the year, or $1.65 per diluted share, compared to $89.7 million, or $1.31 per diluted share, in 2015 |
| |
• | Reported net income attributable to the controlling interests of $5.4 million for the quarter, or $0.07 per diluted share, compared to $62.1 million, or $0.91 per diluted share, in the same period one year ago |
| |
• | Reported NAREIT Funds from Operations (FFO) of $126.0 million for the year, or $1.74 per diluted share, compared to $108.5 million, or $1.58 per diluted share in 2015 |
| |
• | Reported Core FFO of $1.76 per diluted share for the year, a $0.05 increase over Core FFO of $1.71 per diluted share in 2015 |
| |
• | Reported Core FFO of $0.43 per diluted share for the quarter, a $0.03 decrease over Core FFO of $0.46 per diluted share in the same period one year ago |
| |
• | Achieved same-store Net Operating Income (NOI) growth of 1.2% for the year, with same-store rental growth of 1.6% over 2015 |
| |
• | Improved overall portfolio physical occupancy to 93.5%, 330 basis points higher than year-end 2015, and 30 basis points higher than at September 30, 2016 |
| |
• | Executed the sale of the suburban Maryland office portfolio, totaling approximately 1.2 million square feet, for $240.0 million |
| |
• | Acquired Riverside Apartments, a 1,222 unit apartment community in Alexandria, VA, for $244.8 million |
| |
• | Reduced secured debt by $270 million during the year, thereby lowering leverage and strengthening the balance sheet |
Fourth Quarter 2016 Update
Of the 180,000 square feet of commercial leases signed, there were 49,000 square feet of new leases and 131,000 square feet of renewal leases. New leases had an average rental rate increase of 7.6% over expiring lease rates and a weighted average lease term of 5.8 years. Commercial tenant improvement costs were $31.43 per square foot and leasing commissions were $12.89 per square foot for new leases. Renewal leases had an average rental rate increase of 8.9% from expiring lease rates and a weighted average lease term of 4.9 years. Commercial tenant improvement costs were $8.60 per square foot and leasing commissions were $6.54 per square foot for renewal leases.
In December 2016 and January 2017, Washington REIT refinanced pre-payable and maturing secured debt by drawing $100.0 million and $50.0 million respectively on the seven-year $150.0 million unsecured term loan that the Company had entered into in July 2016, which is scheduled to mature on July 21, 2023. Washington REIT entered into a forward swap from floating interest rates to a 2.86% all-in fixed interest rate for $150.0 million commencing on March 31, 2017.
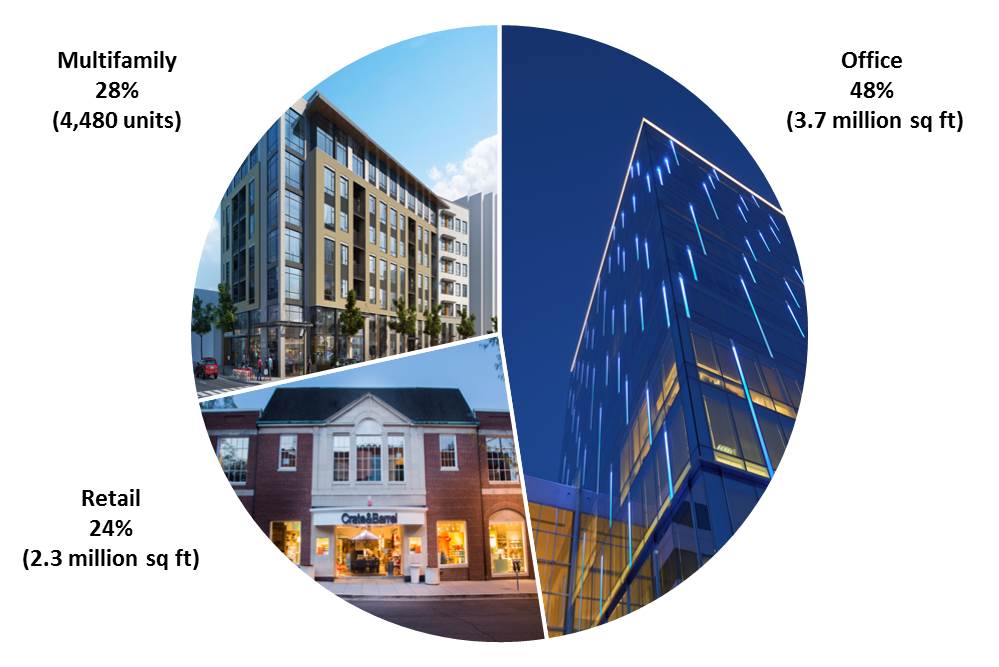
As of December 31, 2016, Washington REIT owned a diversified portfolio of 49 properties, totaling approximately 6 million square feet of commercial space and 4,480 multifamily units, and land held for development. These 49 properties consist of 19 office properties, 16 retail centers and 14 multifamily properties. Washington REIT shares are publicly traded on the New York Stock Exchange (NYSE:WRE)
|
|
Company Background and Highlights |
Fourth Quarter 2016 |
Net Operating Income Contribution by Sector - Fourth Quarter 2016
Certain statements in our earnings release and on our conference call are "forward-looking statements" within the meaning of the Private Securities Litigation Reform Act of 1995. Such statements involve known and unknown risks, uncertainties, and other factors that may cause actual results to differ materially. Such risks, uncertainties and other factors include, but are not limited to, the potential for federal government budget reductions, changes in general and local economic and real estate market conditions, the timing and pricing of lease transactions, the availability and cost of capital, fluctuations in interest rates, tenants' financial conditions, levels of competition, the effect of government regulation, the impact of newly adopted accounting principles, and other risks and uncertainties detailed from time to time in our filings with the Securities and Exchange Commission, including our 2015 Form 10-K filed on February 26, 2016 and our subsequent Quarterly Reports on Form 10-Q. We assume no obligation to update or supplement forward-looking statements that become untrue because of subsequent events.
|
| | |
Supplemental Financial and Operating Data
Table of Contents |
December 31, 2016 |
Schedule | Page |
Key Financial Data | |
| Consolidated Statements of Operations | |
| Consolidated Balance Sheets | |
| Funds From Operations | |
| Funds Available for Distribution | |
| Adjusted Earnings Before Interest, Taxes, Depreciation and Amortization (EBITDA) | |
Capital Analysis | |
| Long Term Debt Analysis | |
| Long Term Debt Maturities | |
| Debt Covenant Compliance | |
| Capital Analysis | |
Portfolio Analysis | |
| Same-Store Portfolio Net Operating Income (NOI) Growth & Rental Rate Growth | |
| Same-Store Portfolio Net Operating Income (NOI) Detail for the Quarter | |
| Same-Store Portfolio Net Operating Income (NOI) Detail for the Year | |
| Net Operating Income (NOI) by Region | |
| Same-Store Portfolio & Overall Physical Occupancy Levels by Sector | |
| Same-Store Portfolio & Overall Economic Occupancy Levels by Sector | |
Growth and Strategy | |
| Acquisition and Disposition Summary | |
| Development/Redevelopment Summary | |
Tenant Analysis | |
| Commercial Leasing Summary- New Leases | |
| Commercial Leasing Summary- Renewal Leases | |
| 10 Largest Tenants - Based on Annualized Commercial Income | |
| Industry Diversification - Office | |
| Industry Diversification - Retail | |
| Lease Expirations | |
Appendix | |
| Schedule of Properties | |
| Supplemental Definitions | |
|
| |
Consolidated Statements of Operations (In thousands, except per share data) (Unaudited)
| |
|
| | | | | | | | | | | | | | | | | | | | | | | | | | | |
| Year Ended | | Quarter Ended |
OPERATING RESULTS | 12/31/2016 | | 12/31/2015 | | 12/31/2016 | | 9/30/2016 | | 6/30/2016 | | 3/31/2016 | | 12/31/2015 |
Real estate rental revenue | $ | 313,264 |
| | $ | 306,427 |
| | $ | 76,952 |
| | $ | 79,770 |
| | $ | 79,405 |
| | $ | 77,137 |
| | $ | 79,102 |
|
Real estate expenses | (115,013 | ) | | (112,234 | ) | | (28,940 | ) | | (29,164 | ) | | (28,175 | ) | | (28,734 | ) | | (27,688 | ) |
| 198,251 |
| | 194,193 |
| | 48,012 |
| | 50,606 |
| | 51,230 |
| | 48,403 |
| | 51,414 |
|
| | | | | | | | | | | | | |
Real estate depreciation and amortization | (108,406 | ) | | (108,935 | ) | | (26,302 | ) | | (30,905 | ) | | (25,161 | ) | | (26,038 | ) | | (28,808 | ) |
Income from real estate | 89,845 |
| | 85,258 |
| | 21,710 |
| | 19,701 |
| | 26,069 |
| | 22,365 |
| | 22,606 |
|
| | | | | | | | | | | | | |
General and administrative expenses | (19,545 | ) | | (20,123 | ) | | (4,527 | ) | | (4,539 | ) | | (4,968 | ) | | (5,511 | ) | | (4,854 | ) |
Casualty gain and real estate impairment (loss), net | 676 |
| | (5,909 | ) | | — |
| | — |
| | 676 |
| | — |
| | — |
|
Acquisition costs | (1,178 | ) | | (2,056 | ) | | — |
| | — |
| | (1,024 | ) | | (154 | ) | | (119 | ) |
Interest expense | (53,126 | ) | | (59,546 | ) | | (11,773 | ) | | (13,173 | ) | | (13,820 | ) | | (14,360 | ) | | (15,012 | ) |
Other income | 297 |
| | 709 |
| | 92 |
| | 83 |
| | 83 |
| | 39 |
| | 162 |
|
Gain on sale of real estate | 101,704 |
| | 91,107 |
| | — |
| | 77,592 |
| | 24,112 |
| | — |
| | 59,376 |
|
Income tax benefit (expense) | 615 |
| | (134 | ) | | (76 | ) | | (2 | ) | | 693 |
| | — |
| | (64 | ) |
Loss on extinguishment of debt | — |
| | (119 | ) | | — |
| | — |
| | — |
| | — |
| | — |
|
Net income | 119,288 |
| | 89,187 |
| | 5,426 |
| | 79,662 |
| | 31,821 |
| | 2,379 |
| | 62,095 |
|
Less: Net loss from noncontrolling interests | 51 |
| | 553 |
| | 19 |
| | 12 |
| | 15 |
| | 5 |
| | 38 |
|
Net income attributable to the controlling interests | $ | 119,339 |
| | $ | 89,740 |
| | $ | 5,445 |
| | $ | 79,674 |
| | $ | 31,836 |
| | $ | 2,384 |
| | $ | 62,133 |
|
| | | | | | | | | | | | | |
Per Share Data: | | | | | | | | | | | | | |
Net income attributable to the controlling interests | $ | 1.65 |
| | $ | 1.31 |
| | $ | 0.07 |
| | $ | 1.07 |
| | $ | 0.44 |
| | $ | 0.03 |
| | $ | 0.91 |
|
Fully diluted weighted average shares outstanding | 72,339 |
| | 68,310 |
| | 74,779 |
| | 74,133 |
| | 71,912 |
| | 68,488 |
| | 68,371 |
|
Percentage of Revenues: | | | | | | | | | | | | | |
Real estate expenses | 36.7 | % | | 36.6 | % | | 37.6 | % | | 36.6 | % | | 35.5 | % | | 37.3 | % | | 35.0 | % |
General and administrative expenses | 6.2 | % | | 6.6 | % | | 5.9 | % | | 5.7 | % | | 6.3 | % | | 7.1 | % | | 6.1 | % |
Ratios: | | | | | | | | | | | | | |
Adjusted EBITDA / Interest expense | 3.4 | x | | 3.0 | x | | 3.7 | x | | 3.5 | x | | 3.4 | x | | 3.0 | x | | 3.1 | x |
Net income attributable to the controlling interest/Total real estate revenue | 38.1 | % | | 29.3 | % | | 7.1 | % | | 99.9 | % | | 40.1 | % | | 3.1 | % | | 78.5 | % |
| | |
|
| |
Consolidated Balance Sheets (In thousands) (Unaudited) | |
|
| | | | | | | | | | | | | | | | | | | |
| 12/31/2016 | | 9/30/2016 | | 6/30/2016 | | 3/31/2016 | | 12/31/2015 |
Assets | | | | | | | | | |
Land | $ | 573,315 |
| | $ | 573,315 |
| | $ | 573,315 |
| | $ | 561,256 |
| | $ | 561,256 |
|
Income producing property | 2,112,088 |
| | 2,092,201 |
| | 2,072,166 |
| | 2,095,306 |
| | 2,076,541 |
|
| 2,685,403 |
| | 2,665,516 |
| | 2,645,481 |
| | 2,656,562 |
| | 2,637,797 |
|
Accumulated depreciation and amortization | (657,425 | ) | | (634,945 | ) | | (613,194 | ) | | (714,689 | ) | | (692,608 | ) |
Net income producing property | 2,027,978 |
| | 2,030,571 |
| | 2,032,287 |
| | 1,941,873 |
| | 1,945,189 |
|
Development in progress, including land held for development | 40,232 |
| | 37,463 |
| | 35,760 |
| | 27,313 |
| | 36,094 |
|
Total real estate held for investment, net | 2,068,210 |
| | 2,068,034 |
| | 2,068,047 |
| | 1,969,186 |
| | 1,981,283 |
|
Investment in real estate held for sale, net | — |
| | — |
| | 41,704 |
| | — |
| | — |
|
Cash and cash equivalents | 11,305 |
| | 8,588 |
| | 22,379 |
| | 23,575 |
| | 23,825 |
|
Restricted cash | 6,317 |
| | 10,091 |
| | 11,054 |
| | 9,889 |
| | 13,383 |
|
Rents and other receivables, net of allowance for doubtful accounts | 64,319 |
| | 62,989 |
| | 58,970 |
| | 63,863 |
| | 62,890 |
|
Prepaid expenses and other assets | 103,468 |
| | 100,788 |
| | 99,150 |
| | 118,790 |
| | 109,787 |
|
Other assets related to properties sold or held for sale | — |
| | — |
| | 5,147 |
| | — |
| | — |
|
Total assets | $ | 2,253,619 |
| | $ | 2,250,490 |
| | $ | 2,306,451 |
| | $ | 2,185,303 |
| | $ | 2,191,168 |
|
Liabilities | | | | | | | | | |
Notes payable | $ | 843,084 |
| | $ | 744,063 |
| | $ | 743,769 |
| | $ | 743,475 |
| | $ | 743,181 |
|
Mortgage notes payable, net | 148,540 |
| | 251,232 |
| | 252,044 |
| | 333,853 |
| | 418,052 |
|
Lines of credit/short-term note payable | 120,000 |
| | 125,000 |
| | 269,000 |
| | 215,000 |
| | 105,000 |
|
Accounts payable and other liabilities | 46,967 |
| | 54,629 |
| | 52,722 |
| | 56,348 |
| | 45,367 |
|
Dividend payable | 22,414 |
| | — |
| | — |
| | — |
| | 20,434 |
|
Advance rents | 11,750 |
| | 10,473 |
| | 10,178 |
| | 11,589 |
| | 12,744 |
|
Tenant security deposits | 8,802 |
| | 8,634 |
| | 8,290 |
| | 9,604 |
| | 9,378 |
|
Other liabilities related to properties sold or held for sale | — |
| | — |
| | 2,338 |
| | — |
| | — |
|
Total liabilities | 1,201,557 |
| | 1,194,031 |
| | 1,338,341 |
| | 1,369,869 |
| | 1,354,156 |
|
Equity | | | | | | | | | |
Preferred shares; $0.01 par value; 10,000 shares authorized | — |
| | — |
| | — |
| | — |
| | — |
|
Shares of beneficial interest, $0.01 par value; 100,000 shares authorized | 746 |
| | 745 |
| | 737 |
| | 683 |
| | 682 |
|
Additional paid-in capital | 1,368,636 |
| | 1,368,438 |
| | 1,338,101 |
| | 1,193,750 |
| | 1,193,298 |
|
Distributions in excess of net income | (326,047 | ) | | (309,042 | ) | | (366,352 | ) | | (376,041 | ) | | (357,781 | ) |
Accumulated other comprehensive loss | 7,611 |
| | (4,870 | ) | | (5,609 | ) | | (4,225 | ) | | (550 | ) |
Total shareholders' equity | 1,050,946 |
| | 1,055,271 |
| | 966,877 |
| | 814,167 |
| | 835,649 |
|
Noncontrolling interests in subsidiaries | 1,116 |
| | 1,188 |
| | 1,233 |
| | 1,267 |
| | 1,363 |
|
Total equity | 1,052,062 |
| | 1,056,459 |
| | 968,110 |
| | 815,434 |
| | 837,012 |
|
Total liabilities and equity | $ | 2,253,619 |
| | $ | 2,250,490 |
| | $ | 2,306,451 |
| | $ | 2,185,303 |
| | $ | 2,191,168 |
|
|
| |
Funds from Operations (In thousands, except per share data) (Unaudited)
| |
|
| | | | | | | | | | | | | | | | | | | | | | | | | | | |
| Year Ended | | Quarter Ended |
| 12/31/2016 | | 12/31/2015 | | 12/31/2016 | | 9/30/2016 | | 6/30/2016 | | 3/31/2016 | | 12/31/2015 |
Funds from operations (FFO)(1) | | | | | | | | | | | | | |
Net income | $ | 119,288 |
| | $ | 89,187 |
| | $ | 5,426 |
| | $ | 79,662 |
| | $ | 31,821 |
| | $ | 2,379 |
| | $ | 62,095 |
|
Real estate depreciation and amortization | 108,406 |
| | 108,935 |
| | 26,302 |
| | 30,905 |
| | 25,161 |
| | 26,038 |
| | 28,808 |
|
Gain on sale of depreciable real estate | (101,704 | ) | | (89,653 | ) | | — |
| | (77,592 | ) | | (24,112 | ) | | — |
| | (59,376 | ) |
NAREIT funds from operations (FFO) | $ | 125,990 |
| | $ | 108,469 |
| | $ | 31,728 |
| | $ | 32,975 |
| | $ | 32,870 |
| | $ | 28,417 |
| | $ | 31,527 |
|
Loss on extinguishment of debt | — |
| | 119 |
| | — |
| | — |
| | — |
| | — |
| | — |
|
Casualty (gain) and real estate impairment loss, net | (676 | ) | | 5,909 |
| | — |
| | — |
| | (676 | ) | | — |
| | — |
|
Gain on sale of non depreciable real estate | — |
| | (1,404 | ) | | — |
| | — |
| | — |
| | — |
| | — |
|
Severance expense | 828 |
| | 1,001 |
| | — |
| | 242 |
| | 126 |
| | 460 |
| | — |
|
Relocation expense | 16 |
| | 90 |
| | — |
| | 16 |
| | — |
| | — |
| | — |
|
Acquisition and structuring expenses | 1,521 |
| | 2,721 |
| | 118 |
| | 37 |
| | 1,107 |
| | 259 |
| | 189 |
|
Core FFO (1) | $ | 127,679 |
| | $ | 116,905 |
| | $ | 31,846 |
| | $ | 33,270 |
| | $ | 33,427 |
| | $ | 29,136 |
| | $ | 31,716 |
|
| | | | | | | | | | | | | |
Allocation to participating securities(2) | $ | (310 | ) | | $ | (269 | ) | | $ | (32 | ) | | $ | (200 | ) | | $ | (99 | ) | | $ | (90 | ) | | $ | (180 | ) |
| | | | | | | | | | | | | |
FFO per share - basic | $ | 1.74 |
| | $ | 1.59 |
| | $ | 0.42 |
| | $ | 0.44 |
| | $ | 0.46 |
| | $ | 0.41 |
| | $ | 0.46 |
|
FFO per share - fully diluted | $ | 1.74 |
| | $ | 1.58 |
| | $ | 0.42 |
| | $ | 0.44 |
| | $ | 0.46 |
| | $ | 0.41 |
| | $ | 0.46 |
|
| | | | | | | | | | | | | |
Core FFO per share - fully diluted | $ | 1.76 |
| | $ | 1.71 |
| | $ | 0.43 |
| | $ | 0.45 |
| | $ | 0.46 |
| | $ | 0.42 |
| | $ | 0.46 |
|
| | | | | | | | | | | | | |
Common dividend declared per share | $ | 1.20 |
| | $ | 1.20 |
| | $ | 0.30 |
| | $ | 0.30 |
| | $ | 0.30 |
| | $ | 0.30 |
| | $ | 0.30 |
|
| | | | | | | | | | | | | |
Average shares - basic | 72,163 |
| | 68,177 |
| | 74,592 |
| | 73,994 |
| | 71,719 |
| | 68,301 |
| | 68,204 |
|
Average shares - fully diluted | 72,339 |
| | 68,310 |
| | 74,779 |
| | 74,133 |
| | 71,912 |
| | 68,488 |
| | 68,371 |
|
| | | | | | | | | | | | | |
(1) See "Supplemental Definitions" on page 32 of this supplemental for the definitions of FFO and Core FFO. | | | | |
(2) Adjustment to the numerators for FFO and Core FFO per share calculations when applying the two-class method for calculating EPS. | | | | |
|
| |
Funds Available for Distribution (In thousands, except per share data) (Unaudited)
| |
|
| | | | | | | | | | | | | | | | | | | | | | | | | | | |
| Year Ended | | Quarter Ended |
| 12/31/2016 | | 12/31/2015 | | 12/31/2016 | | 9/30/2016 | | 6/30/2016 | | 3/31/2016 | | 12/31/2015 |
Funds available for distribution (FAD)(1) | | | | | | | | | | | | | |
NAREIT FFO | $ | 125,990 |
| | $ | 108,469 |
| | $ | 31,728 |
| | $ | 32,975 |
| | $ | 32,870 |
| | $ | 28,417 |
| | $ | 31,527 |
|
Non-cash loss on extinguishment of debt | — |
| | 119 |
| | — |
| | — |
| | — |
| | — |
| | — |
|
Tenant improvements and incentives | (18,893 | ) | | (19,170 | ) | | (4,822 | ) | | (4,889 | ) | | (7,639 | ) | | (1,543 | ) | | (6,792 | ) |
External and internal leasing commissions | (9,019 | ) | | (6,895 | ) | | (3,403 | ) | | (1,251 | ) | | (3,350 | ) | | (1,015 | ) | | (2,426 | ) |
Recurring capital improvements | (4,951 | ) | | (6,048 | ) | | (1,660 | ) | | (1,146 | ) | | (1,237 | ) | | (908 | ) | | (3,296 | ) |
Straight-line rents, net | (2,848 | ) | | (1,344 | ) | | (603 | ) | | (682 | ) | | (880 | ) | | (683 | ) | | (533 | ) |
Non-cash fair value interest expense | 179 |
| | 150 |
| | 47 |
| | 46 |
| | 44 |
| | 42 |
| | 41 |
|
Non-real estate depreciation and amortization of debt costs | 3,545 |
| | 3,979 |
| | 873 |
| | 846 |
| | 876 |
| | 950 |
| | 980 |
|
Amortization of lease intangibles, net | 3,594 |
| | 3,576 |
| | 900 |
| | 898 |
| | 853 |
| | 943 |
| | 925 |
|
Amortization and expensing of restricted share and unit compensation | 3,398 |
| | 5,007 |
| | 737 |
| | 292 |
| | 850 |
| | 1,519 |
| | 1,123 |
|
Funds available for distribution (FAD) | $ | 100,995 |
| | $ | 87,843 |
| | $ | 23,797 |
| | $ | 27,089 |
| | $ | 22,387 |
| | $ | 27,722 |
| | $ | 21,549 |
|
Gain on sale of real estate, non depreciable assets | — |
| | (1,404 | ) | | — |
| | — |
| | — |
| | — |
| | — |
|
Non-share-based severance expense | 407 |
| | 196 |
| | — |
| | 242 |
| | 126 |
| | 39 |
| | — |
|
Relocation expense | 16 |
| | 107 |
| | — |
| | 16 |
| | — |
| | — |
| | — |
|
Acquisition and structuring expenses | 1,521 |
| | 2,721 |
| | 118 |
| | 37 |
| | 1,107 |
| | 259 |
| | 189 |
|
Casualty (gain) and real estate impairment loss, net | (676 | ) | | 5,909 |
| | — |
| | — |
| | (676 | ) | | — |
| | — |
|
Core FAD (1) | $ | 102,263 |
| | $ | 95,372 |
| | $ | 23,915 |
| | $ | 27,384 |
| | $ | 22,944 |
| | $ | 28,020 |
| | $ | 21,738 |
|
| | | | | | | | | | | | | |
| | | | | | | | | | | | | |
(1) See "Supplemental Definitions" on page 32 of this supplemental for the definitions of FAD and Core FAD. | | | | |
|
| | | | |
Adjusted Earnings Before Interest, Taxes, Depreciation and Amortization (EBITDA) (In thousands) (Unaudited) | |
|
| | | | | | | | | | | | | | | | | | | | | | | | | | | |
| Year Ended | | Quarter Ended |
| 12/31/2016 | | 12/31/2015 | | 12/31/2016 | | 9/30/2016 | | 6/30/2016 | | 3/31/2016 | | 12/31/2015 |
Adjusted EBITDA(1) | | | | | | | | | | | | | |
| | | | | | | | | | | | | |
Net income | $ | 119,288 |
| | $ | 89,187 |
| | $ | 5,426 |
| | $ | 79,662 |
| | $ | 31,821 |
| | $ | 2,379 |
| | $ | 62,095 |
|
Add: | | | | | | | | | | | | | |
Interest expense | 53,126 |
| | 59,546 |
| | 11,773 |
| | 13,173 |
| | 13,820 |
| | 14,360 |
| | 15,012 |
|
Real estate depreciation and amortization | 108,406 |
| | 108,935 |
| | 26,302 |
| | 30,905 |
| | 25,161 |
| | 26,038 |
| | 28,808 |
|
Income tax (benefit) expense | (615 | ) | | 134 |
| | 76 |
| | 2 |
| | (693 | ) | | — |
| | 64 |
|
Casualty (gain) and real estate impairment loss, net | (676 | ) | | 5,909 |
| | — |
| | — |
| | (676 | ) | | — |
| | — |
|
Non-real estate depreciation | 524 |
| | 598 |
| | 119 |
| | 101 |
| | 152 |
| | 152 |
| | 149 |
|
Severance expense | 828 |
| | 1,001 |
| | — |
| | 242 |
| | 126 |
| | 460 |
| | — |
|
Relocation expense | 16 |
| | 90 |
| | — |
| | 16 |
| | — |
| | — |
| | — |
|
Acquisition and structuring expenses | 1,521 |
| | 2,721 |
| | 118 |
| | 37 |
| | 1,107 |
| | 259 |
| | 189 |
|
Less: | | | | | | | | | | | | | |
Gain on sale of real estate | (101,704 | ) | | (91,057 | ) | | — |
| | (77,592 | ) | | (24,112 | ) | | — |
| | (59,376 | ) |
Loss on extinguishment of debt | — |
| | 119 |
| | — |
| | — |
| | — |
| | — |
| | — |
|
| | | | | | | | | | | | | |
Adjusted EBITDA | $ | 180,714 |
| | $ | 177,183 |
| | $ | 43,814 |
| | $ | 46,546 |
| | $ | 46,706 |
| | $ | 43,648 |
| | $ | 46,941 |
|
| | | | | | | | | | | | | |
(1) Adjusted EBITDA is earnings before interest expense, taxes, depreciation, amortization, gain on sale of real estate, casualty and real estate impairment, loss on extinguishment of debt, severance expense, relocation expense, acquisition and structuring expense, gain from non-disposal activities and allocations to noncontrolling interests. We consider Adjusted EBITDA to be an appropriate supplemental performance measure because it permits investors to view income from operations without the effect of depreciation, the cost of debt or non-operating gains and losses. Adjusted EBITDA is a non-GAAP measure. |
|
| |
Long Term Debt Analysis ($'s in thousands) | |
|
| | | | | | | | | | | | | | | | | | | |
| 12/31/2016 | | 9/30/2016 | | 6/30/2016 | | 3/31/2016 | | 12/31/2015 |
Balances Outstanding | | | | | | | | | |
| | | | | | | | | |
Secured | | | | | | | | | |
Mortgage note payable, net | $ | 148,540 |
| | $ | 251,232 |
| | $ | 252,044 |
| | $ | 333,853 |
| | $ | 418,052 |
|
Unsecured | | | | | | | | | |
Fixed rate bonds and notes | 595,067 |
| | 594,905 |
| | 594,658 |
| | 594,411 |
| | 594,164 |
|
Term loans | 248,017 |
| | 149,158 |
| | 149,111 |
| | 149,064 |
| | 149,017 |
|
Credit facilities | 120,000 |
| | 125,000 |
| | 269,000 |
| | 215,000 |
| | 105,000 |
|
Unsecured total | 963,084 |
| | 869,063 |
| | 1,012,769 |
| | 958,475 |
| | 848,181 |
|
Total | $ | 1,111,624 |
| | $ | 1,120,295 |
| | $ | 1,264,813 |
| | $ | 1,292,328 |
| | $ | 1,266,233 |
|
| | | | | | | | | |
Average Interest Rates | | | | | | | | | |
| | | | | | | | | |
Secured | | | | | | | | | |
Mortgage note payable, net | 4.0 | % | | 5.3 | % | | 5.3 | % | | 5.4 | % | | 5.2 | % |
Unsecured | | | | | | | | | |
Fixed rate bonds | 4.7 | % | | 4.7 | % | | 4.7 | % | | 4.7 | % | | 4.7 | % |
Term loans (1) | 2.6 | % | | 2.7 | % | | 2.7 | % | | 2.7 | % | | 2.7 | % |
Credit facilities | 1.6 | % | | 1.5 | % | | 1.4 | % | | 1.4 | % | | 1.4 | % |
Unsecured total | 3.8 | % | | 3.9 | % | | 3.6 | % | | 3.7 | % | | 4.0 | % |
Average | 3.8 | % | | 4.2 | % | | 3.9 | % | | 4.1 | % | | 4.4 | % |
| | | | | | | | | |
(1) Washington REIT has entered into interest rate swaps to effectively fix the floating interest rates on its term loans (see page 10 of this Supplemental). |
Note: The current debt balances outstanding are shown net of discounts, premiums and unamortized debt costs (see page 10 of this Supplemental). |
|
| | | | |
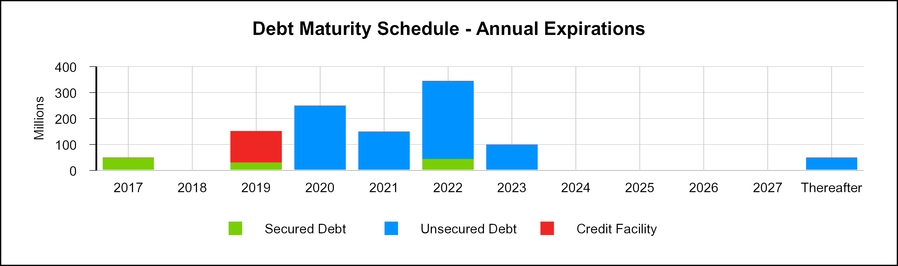
Long Term Debt Maturities (in thousands, except average interest rates) | | | |
|
| | | | | | | | | | | | | | | | | |
| Future Maturities of Debt (in thousands, except for %) |
Year | Secured Debt | | Unsecured Debt | | Credit Facility | | Total Debt | | Average Interest Rate |
2017 | $ | 49,522 |
| | $ | — |
| | $ | — |
| | $ | 49,522 |
| | 3.2% |
2018 | — |
| | — |
| | — |
| | — |
| | —% |
2019 | 31,280 |
| | — |
| | 120,000 |
| (1) | 151,280 |
| | 2.4% |
2020 | — |
| | 250,000 |
| | — |
| | 250,000 |
| | 5.1% |
2021 | — |
| | 150,000 |
| (2) | — |
| | 150,000 |
| | 2.7% |
2022 | 44,517 |
| | 300,000 |
| | — |
| | 344,517 |
| | 4.0% |
2023 | — |
| | 100,000 |
| (3) | — |
| | 100,000 |
| | 2.4% |
2024 | — |
| | — |
| | — |
| | — |
| | —% |
2025 | — |
| | — |
| | — |
| | — |
| | —% |
2026 | — |
| | — |
| | — |
| | — |
| | —% |
2027 | — |
| | — |
| | — |
| | — |
| | —% |
Thereafter | — |
| | 50,000 |
| | — |
| | 50,000 |
| | 7.4% |
Scheduled principal payments | $ | 125,319 |
| | $ | 850,000 |
| | $ | 120,000 |
| | $ | 1,095,319 |
| | 3.8% |
Scheduled amortization payments | 19,166 |
| | — |
| | — |
| | 19,166 |
| | 4.8% |
Net discounts/premiums | 4,354 |
| | (1,971 | ) | | — |
| | 2,383 |
| | —% |
Loan costs, net of amortization | (299 | ) | | (4,945 | ) | | — |
| | (5,244 | ) | | —% |
Total maturities | $ | 148,540 |
| | $ | 843,084 |
| | $ | 120,000 |
| | $ | 1,111,624 |
| | 3.8% |
Weighted average maturity = 3.7 years
(1) Maturity date for credit facility may be extended for up to two additional 6-month periods at Washington REIT's option.
(2) Washington REIT entered into interest rate swaps to effectively fix a LIBOR plus 110 basis points floating interest rate at a 2.72% all-in fixed interest rate commencing October 15, 2015.
(3) Washington REIT entered into interest rate swaps to effectively fix a LIBOR plus 165 basis points floating interest rate to a 2.86% all-in fixed interest rate commencing March 31, 2017.
|
| | | | | | | | | |
| Unsecured Notes Payable | | Unsecured Line of Credit and Term Loans |
| Quarter Ended December 31, 2016 | | Covenant | | Quarter Ended December 31, 2016 | | Covenant |
% of Total Indebtedness to Total Assets(1) | 40.4 | % | | ≤ 65.0% | | N/A |
| | N/A |
Ratio of Income Available for Debt Service to Annual Debt Service | 3.7 |
| | ≥ 1.5 | | N/A |
| | N/A |
% of Secured Indebtedness to Total Assets(1) | 5.4 | % | | ≤ 40.0% | | N/A |
| | N/A |
Ratio of Total Unencumbered Assets(2) to Total Unsecured Indebtedness | 2.7 |
| | ≥ 1.5 | | N/A |
| | N/A |
% of Net Consolidated Total Indebtedness to Consolidated Total Asset Value(3) | N/A |
| | N/A | | 35.3 | % | | ≤ 60.0% |
Ratio of Consolidated Adjusted EBITDA(4) to Consolidated Fixed Charges(5) | N/A |
| | N/A | | 3.55 |
| | ≥ 1.50 |
% of Consolidated Secured Indebtedness to Gross Total Asset Value(3) | N/A |
| | N/A | | 4.8 | % | | ≤ 40.0% |
% of Consolidated Unsecured Indebtedness to Unencumbered Pool Value(6) | N/A |
| | N/A | | 33.4 | % | | ≤ 60.0% |
Ratio of Unencumbered Adjusted Net Operating Income to Consolidated Unsecured Interest Expense | N/A |
| | N/A | | 4.78 |
| | ≥ 1.75 |
| | | | | | | |
(1) Total Assets is calculated by applying a capitalization rate of 7.50% to the EBITDA(4) from the last four consecutive quarters, excluding EBITDA from acquired, disposed, and non-stabilized development properties. |
(2) Total Unencumbered Assets is calculated by applying a capitalization rate of 7.50% to the EBITDA(4) from unencumbered properties from the last four consecutive quarters, excluding EBITDA from acquired, disposed, and non-stabilized development properties. |
(3) Consolidated Total Asset Value is the sum of unrestricted cash plus the quotient of applying a capitalization rate to the annualized NOI from the most recently ended quarter for each asset class, excluding NOI from disposed properties, acquisitions during the past 6 quarters, development, major redevelopment and low occupancy properties. To this amount, we add the purchase price of acquisitions during the past 6 quarters plus values for development, major redevelopment and low occupancy properties. |
(4) Consolidated Adjusted EBITDA is defined as earnings before noncontrolling interests, depreciation, amortization, interest expense, income tax expense, acquisition costs, extraordinary, unusual or nonrecurring transactions including sale of assets, impairment, gains and losses on extinguishment of debt and other non-cash charges. |
(5) Consolidated Fixed Charges consist of interest expense excluding capitalized interest and amortization of deferred financing costs, principal payments and preferred dividends, if any. |
(6) Unencumbered Pool Value is the sum of unrestricted cash plus the quotient of applying a capitalization rate to the annualized NOI from unencumbered properties from the most recently ended quarter for each asset class excluding NOI from disposed properties, acquisitions during the past 6 quarters, development, major redevelopment and low occupancy properties. To this we add the purchase price of unencumbered acquisitions during the past 6 quarters and values for unencumbered development, major redevelopment and low occupancy properties. |
|
| |
Capital Analysis (In thousands, except per share amounts) | |
|
| | | | | | | | | | | | | | | | | | | | | | | | | | | |
| | | | | 12/31/2016 | | 9/30/2016 | | 6/30/2016 | | 3/31/2016 | | 12/31/2015 |
Market Data | | | | | | | | | | | | | |
| | | | | | | | | | | | | |
Shares Outstanding | | | | | 74,606 |
| | 74,579 |
| | 73,651 |
| | 68,326 |
| | 68,191 |
|
Market Price per Share | | | | | $ | 32.69 |
| | $ | 31.12 |
| | $ | 31.46 |
| | $ | 29.21 |
| | $ | 27.06 |
|
Equity Market Capitalization | | | | | $ | 2,438,870 |
| | $ | 2,320,898 |
| | $ | 2,317,060 |
| | $ | 1,995,802 |
| | $ | 1,845,248 |
|
| | | | | | | | | | | | | |
Total Debt | | | | | $ | 1,111,624 |
| | $ | 1,120,295 |
| | $ | 1,264,813 |
| | $ | 1,292,328 |
| | $ | 1,266,233 |
|
Total Market Capitalization | | | | | $ | 3,550,494 |
| | $ | 3,441,193 |
| | $ | 3,581,873 |
| | $ | 3,288,130 |
| | $ | 3,111,481 |
|
| | | | | | | | | | | | | |
Total Debt to Market Capitalization | | | | | 0.31 | :1 | | 0.33 | :1 | | 0.35 | :1 | | 0.39 | :1 | | 0.41 | :1 |
| | | | | | | | | | | | | |
Earnings to Fixed Charges(1) | | | | | 1.4x |
| | 6.9x |
| | 3.3x |
| | 1.2x |
| | 5.1x |
|
Debt Service Coverage Ratio(2) | | | | | 3.4x |
| | 3.3x |
| | 3.2x |
| | 2.8x |
| | 2.9x |
|
| | | | | | | | | | | | | |
Dividend Data | | | | | | | | | | | | | |
| Year Ended | | Quarter Ended |
| 12/31/2016 | | 12/31/2015 | | 12/31/2016 | | 9/30/2016 | | 6/30/2016 | | 3/31/2016 | | 12/31/2015 |
Total Dividends Declared | $ | 87,570 |
| | $ | 82,003 |
| | $ | 22,414 |
| | $ | 22,365 |
| | $ | 22,147 |
| | $ | 20,644 |
| | $ | 20,493 |
|
Common Dividend Declared per Share | $ | 1.20 |
| | $ | 1.20 |
| | $ | 0.30 |
| | $ | 0.30 |
| | $ | 0.30 |
| | $ | 0.30 |
| | $ | 0.30 |
|
Payout Ratio (Core FFO per share basis) | 68.2 | % | | 70.2 | % | | 70.5 | % | | 66.7 | % | | 65.2 | % | | 71.4 | % | | 65.0 | % |
Payout Ratio (Core FAD per share basis) | 85.1 | % | | 86.3 | % | | | | | | | | | | |
| | | | | | | | | | | | | |
(1) The ratio of earnings to fixed charges is computed by dividing earnings by fixed charges. For this purpose, earnings consist of income from continuing operations attributable to the controlling interests plus fixed charges, less capitalized interest. Fixed charges consist of interest expense, including amortized costs of debt issuance, plus interest costs capitalized. The third and second quarters of 2016 and fourth quarter of 2015 include gains on sale of real estate classified as continued operations of $77.6 million, $24.1 million and $59.4 million, respectively. |
(2) Debt service coverage ratio is computed by dividing Adjusted EBITDA (see page 8) by interest expense and principal amortization. |
|
| |
Same-Store Portfolio Net Operating Income (NOI) Growth & Rental Rate Growth 2016 vs. 2015 | |
|
| | | | | | | | | | | | | | | | | | | | | | | | | | | | |
| | Quarter Ended December 31, (1) | | | | | | Year Ended December 31, (1) | | | | |
| | 2016 | | 2015 | | % Change | | Rental Rate Growth | | 2016 | | 2015 | | % Change | | Rental Rate Growth |
| | | | | | | | | | | | | | | | |
Cash Basis: | | | | | | | | | | | | | | | | |
Multifamily | | $ | 8,216 |
| | $ | 8,034 |
| | 2.3 | % | | 0.8 | % | | $ | 32,820 |
| | $ | 31,858 |
| | 3.0 | % | | 0.3 | % |
Office | | 20,169 |
| | 20,616 |
| | (2.2 | )% | | 1.1 | % | | 79,716 |
| | 79,093 |
| | 0.8 | % | | 1.1 | % |
Retail | | 11,249 |
| | 11,362 |
| | (1.0 | )% | | 1.5 | % | | 44,421 |
| | 44,575 |
| | (0.3 | )% | | 2.7 | % |
Overall Same-Store Portfolio | | $ | 39,634 |
| | $ | 40,012 |
| | (0.9 | )% | | 1.1 | % | | $ | 156,957 |
| | $ | 155,526 |
| | 0.9 | % | | 1.3 | % |
| | | | | | | | | | | | | | | | |
GAAP Basis: | | | | | | | | | | | | | | | | |
Multifamily | | $ | 8,107 |
| | $ | 8,029 |
| | 1.0 | % | | 0.8 | % | | $ | 32,691 |
| | $ | 31,842 |
| | 2.7 | % | | 0.3 | % |
Office | | 19,856 |
| | 20,154 |
| | (1.5 | )% | | 2.0 | % | | 78,647 |
| | 77,578 |
| | 1.4 | % | | 1.8 | % |
Retail | | 11,502 |
| | 11,792 |
| | (2.5 | )% | | 0.9 | % | | 45,706 |
| | 45,737 |
| | (0.1 | )% | | 2.3 | % |
Overall Same-Store Portfolio | | $ | 39,465 |
| | $ | 39,975 |
| | (1.3 | )% | | 1.4 | % | | $ | 157,044 |
| | $ | 155,157 |
| | 1.2 | % | | 1.6 | % |
|
|
(1) Non same-store properties were: |
Acquisitions: |
Multifamily - The Wellington and Riverside Apartments |
Development/Redevelopment: |
Multifamily - The Maxwell |
Office - Silverline Center and The Army Navy Building |
Sold properties: |
Multifamily - Country Club Towers and Munson Hill Towers |
Office - Dulles Station II, Wayne Plaza, 600 Jefferson Plaza, 6110 Executive Boulevard, West Gude, 51 Monroe Street and One Central Plaza |
Retail - Montgomery Village Center |
|
| |
Same-Store Portfolio Net Operating Income (NOI) Detail (In thousands) | |
|
| | | | | | | | | | | | | | | | | | | |
| Quarter Ended December 31, 2016 |
| Multifamily | | Office | | Retail | | Corporate and Other | | Total |
Real estate rental revenue | | | | | | | | | |
Same-store portfolio | $ | 13,915 |
| | $ | 32,540 |
| | $ | 15,702 |
| | $ | — |
| | $ | 62,157 |
|
Non same-store - acquired and in development(1) | 9,602 |
| | 5,193 |
| | — |
| | — |
| | 14,795 |
|
Total | 23,517 |
| | 37,733 |
| | 15,702 |
| | — |
| | 76,952 |
|
| | | | | | | | | |
Real estate expenses | | | | | | | | | |
Same-store portfolio | 5,808 |
| | 12,684 |
| | 4,200 |
| | — |
| | 22,692 |
|
Non same-store - acquired and in development(1) | 4,035 |
| | 2,213 |
| | — |
| | — |
| | 6,248 |
|
Total | 9,843 |
| | 14,897 |
| | 4,200 |
| | — |
| | 28,940 |
|
| | | | | | | | | |
Net Operating Income (NOI) | | | | | | | | | |
Same-store portfolio | 8,107 |
| | 19,856 |
| | 11,502 |
| | — |
| | 39,465 |
|
Non same-store - acquired and in development(1) | 5,567 |
| | 2,980 |
| | — |
| | — |
| | 8,547 |
|
Total | $ | 13,674 |
| | $ | 22,836 |
| | $ | 11,502 |
| | $ | — |
| | $ | 48,012 |
|
| | | | | | | | | |
Same-store portfolio NOI GAAP basis (from above) | $ | 8,107 |
| | $ | 19,856 |
| | $ | 11,502 |
| | $ | — |
| | $ | 39,465 |
|
Straight-line revenue, net for same-store properties | 108 |
| | (433 | ) | | (70 | ) | | — |
| | (395 | ) |
FAS 141 Min Rent | 1 |
| | 228 |
| | (232 | ) | | — |
| | (3 | ) |
Amortization of lease intangibles for same-store properties | — |
| | 518 |
| | 49 |
| | — |
| | 567 |
|
Same-store portfolio NOI, cash basis | $ | 8,216 |
| | $ | 20,169 |
| | $ | 11,249 |
| | $ | — |
| | $ | 39,634 |
|
Reconciliation of NOI to net income: | | | | | | | | | |
Total NOI | $ | 13,674 |
| | $ | 22,836 |
| | $ | 11,502 |
| | $ | — |
| | $ | 48,012 |
|
Depreciation and amortization | (7,546 | ) | | (14,657 | ) | | (3,897 | ) | | (202 | ) | | (26,302 | ) |
General and administrative expenses | — |
| | — |
| | — |
| | (4,527 | ) | | (4,527 | ) |
Interest expense | (992 | ) | | (834 | ) | | (200 | ) | | (9,747 | ) | | (11,773 | ) |
Other income | — |
| | — |
| | — |
| | 92 |
| | 92 |
|
Income tax expense | — |
| | — |
| | | | (76 | ) | | (76 | ) |
Net Income | 5,136 |
| | 7,345 |
| | 7,405 |
| | (14,460 | ) | | 5,426 |
|
Net income attributable to noncontrolling interests | — |
| | — |
| | — |
| | 19 |
| | 19 |
|
Net income attributable to the controlling interests | $ | 5,136 |
| | $ | 7,345 |
| | $ | 7,405 |
| | $ | (14,441 | ) | | $ | 5,445 |
|
| | | | | | | | | |
(1) For a list of non-same-store properties and held for sale and sold properties, see page 13 of this Supplemental. |
|
| |
Same-Store Net Operating Income (NOI) Detail (In thousands) | |
|
| | | | | | | | | | | | | | | | | | | |
| Quarter Ended December 31, 2015 |
| Multifamily | | Office | | Retail | | Corporate and Other | | Total |
Real estate rental revenue | | | | | | | | | |
Same-store portfolio | $ | 13,644 |
| | $ | 31,986 |
| | $ | 15,086 |
| | $ | — |
| | $ | 60,716 |
|
Non same-store - acquired and in development(1) | 4,582 |
| | 13,137 |
| | 667 |
| | — |
| | 18,386 |
|
Total | 18,226 |
| | 45,123 |
| | 15,753 |
| | — |
| | 79,102 |
|
Real estate expenses | | | | | | | | | |
Same-store portfolio | 5,615 |
| | 11,832 |
| | 3,294 |
| | — |
| | 20,741 |
|
Non same-store - acquired and in development(1) | 1,974 |
| | 4,799 |
| | 174 |
| | — |
| | 6,947 |
|
Total | 7,589 |
| | 16,631 |
| | 3,468 |
| | — |
| | 27,688 |
|
Net Operating Income (NOI) | | | | | | | | | |
Same-store portfolio | 8,029 |
| | 20,154 |
| | 11,792 |
| | — |
| | 39,975 |
|
Non same-store - acquired and in development(1) | 2,608 |
| | 8,338 |
| | 493 |
| | — |
| | 11,439 |
|
Total | $ | 10,637 |
| | $ | 28,492 |
| | $ | 12,285 |
| | $ | — |
| | $ | 51,414 |
|
| | | | | | | | | |
Same-store portfolio NOI GAAP basis (from above) | $ | 8,029 |
| | $ | 20,154 |
| | $ | 11,792 |
| | $ | — |
| | $ | 39,975 |
|
Straight-line revenue, net for same-store properties | 4 |
| | (174 | ) | | (236 | ) | | — |
| | (406 | ) |
FAS 141 Min Rent | 1 |
| | 152 |
| | (253 | ) | | — |
| | (100 | ) |
Amortization of lease intangibles for same-store properties | — |
| | 484 |
| | 59 |
| | — |
| | 543 |
|
Same-store portfolio NOI, cash basis | $ | 8,034 |
| | $ | 20,616 |
| | $ | 11,362 |
| | $ | — |
| | $ | 40,012 |
|
Reconciliation of NOI to net income: | | | | | | | | | |
Total NOI | $ | 10,637 |
| | $ | 28,492 |
| | $ | 12,285 |
| | $ | — |
| | $ | 51,414 |
|
Depreciation and amortization | (7,507 | ) | | (17,209 | ) | | (3,801 | ) | | (291 | ) | | (28,808 | ) |
General and administrative expense | — |
| | — |
| | — |
| | (4,854 | ) | | (4,854 | ) |
Acquisition costs | — |
| | — |
| | — |
| | (119 | ) | | (119 | ) |
Interest expense | (2,489 | ) | | (2,999 | ) | | (220 | ) | | (9,304 | ) | | (15,012 | ) |
Other income | — |
| | — |
| | — |
| | 162 |
| | 162 |
|
Income tax expense | — |
| | — |
| | — |
| | (64 | ) | | (64 | ) |
Gain on sale of real estate, continuing ops | — |
| | — |
| | — |
| | 59,376 |
| | 59,376 |
|
Net income | 641 |
| | 8,284 |
| | 8,264 |
| | 44,906 |
| | 62,095 |
|
Net income attributable to noncontrolling interests | — |
| | — |
| | — |
| | 38 |
| | 38 |
|
Net income attributable to the controlling interests | $ | 641 |
| | $ | 8,284 |
| | $ | 8,264 |
| | $ | 44,944 |
| | $ | 62,133 |
|
| | | | | | | | | |
(1) For a list of non-same-store properties and held for sale and sold properties, see page 13 of this Supplemental. | | |
|
| |
Same-Store Net Operating Income (NOI) Detail (In thousands) | |
|
| | | | | | | | | | | | | | | | | | | |
| Year Ended December 31, 2016 |
| Multifamily | | Office | | Retail | | Corporate and Other | | Total |
Real estate rental revenue | | | | | | | | | |
Same-store portfolio | $ | 55,333 |
| | $ | 126,959 |
| | $ | 61,566 |
| | $ | — |
| | $ | 243,858 |
|
Non same-store - acquired and in development 1 | 30,431 |
| | 38,975 |
| | — |
| | — |
| | 69,406 |
|
Total | 85,764 |
| | 165,934 |
| | 61,566 |
| | — |
| | 313,264 |
|
Real estate expenses | | | | | | | | | |
Same-store portfolio | 22,642 |
| | 48,312 |
| | 15,860 |
| | — |
| | 86,814 |
|
Non same-store - acquired and in development 1 | 12,106 |
| | 16,093 |
| | — |
| | — |
| | 28,199 |
|
Total | 34,748 |
| | 64,405 |
| | 15,860 |
| | — |
| | 115,013 |
|
Net Operating Income (NOI) | | | | | | | | | |
Same-store portfolio | 32,691 |
| | 78,647 |
| | 45,706 |
| | — |
| | 157,044 |
|
Non same-store - acquired and in development 1 | 18,325 |
| | 22,882 |
| | — |
| | — |
| | 41,207 |
|
Total | $ | 51,016 |
| | $ | 101,529 |
| | $ | 45,706 |
| | $ | — |
| | $ | 198,251 |
|
| | | | | | | | | |
Same-store portfolio NOI GAAP basis (from above) | $ | 32,691 |
| | $ | 78,647 |
| | $ | 45,706 |
| | $ | — |
| | $ | 157,044 |
|
Straight-line revenue, net for same-store properties | 125 |
| | (1,832 | ) | | (508 | ) | | — |
| | (2,215 | ) |
FAS 141 Min Rent | 4 |
| | 891 |
| | (974 | ) | | — |
| | (79 | ) |
Amortization of lease intangibles for same-store properties | — |
| | 2,010 |
| | 197 |
| | — |
| | 2,207 |
|
Same-store portfolio NOI, cash basis | $ | 32,820 |
| | $ | 79,716 |
| | $ | 44,421 |
| | $ | — |
| | $ | 156,957 |
|
| | | | | | | | | |
Reconciliation of NOI to net income: | | | | | | | | | |
Total NOI | $ | 51,016 |
| | $ | 101,529 |
| | $ | 45,706 |
| | $ | — |
| | $ | 198,251 |
|
Depreciation and amortization | (31,501 | ) | | (61,181 | ) | | (14,797 | ) | | (927 | ) | | (108,406 | ) |
General and administrative expenses | — |
| | — |
| | — |
| | (19,545 | ) | | (19,545 | ) |
Acquisition costs | — |
| | — |
| | — |
| | (1,178 | ) | | (1,178 | ) |
Interest expense | (6,040 | ) | | (7,783 | ) | | (831 | ) | | (38,472 | ) | | (53,126 | ) |
Other income | — |
| | — |
| | — |
| | 297 |
| | 297 |
|
Gain on sale of real estate | — |
| | — |
| | — |
| | 101,704 |
| | 101,704 |
|
Income tax benefit | — |
| | — |
| | — |
| | 615 |
| | 615 |
|
Casualty gain and real estate impairment (loss), net | — |
| | — |
| | — |
| | 676 |
| | 676 |
|
Net Income | 13,475 |
| | 32,565 |
| | 30,078 |
| | 43,170 |
| | 119,288 |
|
Net income attributable to noncontrolling interests | — |
| | — |
| | — |
| | 51 |
| | 51 |
|
Net income attributable to the controlling interests | $ | 13,475 |
| | $ | 32,565 |
| | $ | 30,078 |
| | $ | 43,221 |
| | $ | 119,339 |
|
| | | | | | | | | |
(1) For a list of non-same-store properties and held for sale and sold properties, see page 13 of this Supplemental. |
|
| |
Same-Store Net Operating Income (NOI) Detail (In thousands) | |
|
| | | | | | | | | | | | | | | | | | | |
| Year Ended December 31, 2015 |
| Multifamily | | Office | | Retail | | Corporate and Other | | Total |
Real estate rental revenue | | | | | | | | | |
Same-store portfolio | $ | 54,502 |
| | $ | 124,963 |
| | $ | 60,400 |
| | $ | — |
| | $ | 239,865 |
|
Non same-store - acquired and in development (1) | 14,040 |
| | 49,415 |
| | 3,107 |
| | — |
| | 66,562 |
|
Total | 68,542 |
| | 174,378 |
| | 63,507 |
| | — |
| | 306,427 |
|
Real estate expenses | | | | | | | | | |
Same-store portfolio | 22,660 |
| | 47,385 |
| | 14,663 |
| | — |
| | 84,708 |
|
Non same-store - acquired and in development (1) | 6,740 |
| | 19,843 |
| | 943 |
| | — |
| | 27,526 |
|
Total | 29,400 |
| | 67,228 |
| | 15,606 |
| | — |
| | 112,234 |
|
Net Operating Income (NOI) | | | | | | | | | |
Same-store portfolio | 31,842 |
| | 77,578 |
| | 45,737 |
| | — |
| | 155,157 |
|
Non same-store - acquired and in development (1) | 7,300 |
| | 29,572 |
| | 2,164 |
| | — |
| | 39,036 |
|
Total | $ | 39,142 |
| | $ | 107,150 |
| | $ | 47,901 |
| | $ | — |
| | $ | 194,193 |
|
| | | | | | | | | |
Same-store portfolio NOI GAAP basis (from above) | $ | 31,842 |
| | $ | 77,578 |
| | $ | 45,737 |
| | $ | — |
| | $ | 155,157 |
|
Straight-line revenue, net for same-store properties | 13 |
| | (1,058 | ) | | (426 | ) | | — |
| | (1,471 | ) |
FAS 141 Min Rent | 3 |
| | 638 |
| | (981 | ) | | — |
| | (340 | ) |
Amortization of lease intangibles for same-store properties | — |
| | 1,935 |
| | 245 |
| | — |
| | 2,180 |
|
Same-store portfolio NOI, cash basis | $ | 31,858 |
| | $ | 79,093 |
| | $ | 44,575 |
| | $ | — |
| | $ | 155,526 |
|
Reconciliation of NOI to Net Income | | | | | | | | | |
Total NOI | $ | 39,142 |
| | $ | 107,150 |
| | $ | 47,901 |
| | $ | — |
| | $ | 194,193 |
|
Depreciation and amortization | (24,356 | ) | | (68,567 | ) | | (14,949 | ) | | (1,063 | ) | | (108,935 | ) |
General and administrative expenses | — |
| | — |
| | — |
| | (20,123 | ) | | (20,123 | ) |
Real estate impairment | — |
| | — |
| | — |
| | (5,909 | ) | | (5,909 | ) |
Acquisition costs | — |
| | — |
| | — |
| | (2,056 | ) | | (2,056 | ) |
Interest expense | (9,816 | ) | | (11,951 | ) | | (916 | ) | | (36,863 | ) | | (59,546 | ) |
Other income | — |
| | — |
| | — |
| | 709 |
| | 709 |
|
Gain on sale of real estate | — |
| | — |
| | — |
| | 91,107 |
| | 91,107 |
|
Loss on extinguishment of debt | — |
| | — |
| | — |
| | (119 | ) | | (119 | ) |
Income tax expense | — |
| | — |
| | — |
| | (134 | ) | | (134 | ) |
Net income | 4,970 |
| | 26,632 |
| | 32,036 |
| | 25,549 |
| | 89,187 |
|
Net income attributable to noncontrolling interests | — |
| | — |
| | — |
| | 553 |
| | 553 |
|
Net income attributable to the controlling interests | $ | 4,970 |
| | $ | 26,632 |
| | $ | 32,036 |
| | $ | 26,102 |
| | $ | 89,740 |
|
| | | | | | | | | |
(1) For a list of non-same-store properties and held for sale and sold properties, see page 13 of this Supplemental. | | |
|
| |
Net Operating Income (NOI) by Region | |
|
| | | | | | |
| | | | |
Washington REIT Portfolio |
Maryland/Virginia/DC |
| | | | |
| | | | |
| | Percentage of
Q4 2016 NOI | | Percentage of
YTD 2016 NOI |
DC | | | | |
Multifamily | | 6.1 | % | | 5.7 | % |
Office | | 23.8 | % | | 23.9 | % |
Retail | | 1.8 | % | | 1.5 | % |
| | 31.7 | % | | 31.1 | % |
| | | | |
Maryland | | | | |
Multifamily | | 2.4 | % | | 2.4 | % |
Office | | — | % | | 6.5 | % |
Retail | | 15.0 | % | | 14.6 | % |
| | 17.4 | % | | 23.5 | % |
| | | | |
Virginia | | | | |
Multifamily | | 20.1 | % | | 17.6 | % |
Office | | 23.6 | % | | 20.8 | % |
Retail | | 7.2 | % | | 7.0 | % |
| | 50.9 | % | | 45.4 | % |
| | | | |
Total Portfolio | | 100.0 | % | | 100.0 | % |
|
| |
Same-Store Portfolio and Overall Physical Occupancy Levels by Sector
| |
|
| | | | | | | | | | | | | | | |
| | Physical Occupancy - Same-Store Properties (1), (2) |
Sector | | 12/31/2016 | | 9/30/2016 | | 6/30/2016 | | 3/31/2016 | | 12/31/2015 |
Multifamily (calculated on a unit basis) | | 96.3 | % | | 96.4 | % | | 95.1 | % | | 95.3 | % | | 94.4 | % |
| | | | | | | | | | |
Multifamily | | 96.0 | % | | 95.6 | % | | 94.8 | % | | 94.5 | % | | 94.3 | % |
Office | | 92.1 | % | | 92.3 | % | | 91.7 | % | | 91.2 | % | | 91.0 | % |
Retail | | 95.7 | % | | 95.6 | % | | 92.1 | % | | 91.2 | % | | 91.5 | % |
| | | | | | | | | | |
Overall Portfolio | | 94.3 | % | | 94.2 | % | | 92.7 | % | | 92.1 | % | | 92.1 | % |
| | | | | | | | | | |
| | Physical Occupancy - All Properties |
Sector | | 12/31/2016 | | 9/30/2016 | | 6/30/2016 | | 3/31/2016 | | 12/31/2015 |
Multifamily (calculated on a unit basis) | | 94.7 | % | | 94.5 | % | | 94.7 | % | | 95.2 | % | | 93.9 | % |
| | | | | | | | | | |
Multifamily | | 94.5 | % | | 94.2 | % | | 94.4 | % | | 94.5 | % | | 93.4 | % |
Office | | 91.1 | % | | 90.5 | % | | 87.5 | % | | 87.8 | % | | 87.6 | % |
Retail | | 95.7 | % | | 95.6 | % | | 92.1 | % | | 91.2 | % | | 91.5 | % |
| | | | | | | | | | |
Overall Portfolio | | 93.5 | % | | 93.2 | % | | 91.1 | % | | 90.6 | % | | 90.2 | % |
(1) Non same-store properties were:
Acquisition:
Multifamily - The Wellington and Riverside Apartments
Development/Redevelopment:
Multifamily - The Maxwell
Office - Silverline Center and The Army Navy Building
Sold properties:
Multifamily - Munson Hill Towers
Retail - Montgomery Village Center
Office - Dulles Station II, Maryland Office Portfolio: Transaction I (6110 Executive Boulevard, 600 Jefferson Plaza, West Gude and Wayne Plaza) and Transaction II (51 Monroe and
One Central Plaza)
(2) Physical occupancy is calculated as occupied square footage as a percentage of total square footage as of the last day of that period, except for the rows labeled "Multifamily (calculated on a unit basis)," which is calculated as occupied units as a percentage of total available units as of the last day of the that period.
|
| |
Same-Store Portfolio and Overall Economic Occupancy Levels by Sector | |
|
| | | | | | | | | | | | | | | |
| | Economic Occupancy - Same-Store Properties(1) |
Sector | | 12/31/2016 | | 9/30/2016 | | 6/30/2016 | | 3/31/2016 | | 12/31/2015 |
| | | | | | | | | | |
Multifamily | | 96.2 | % | | 96.1 | % | | 95.5 | % | | 94.4 | % | | 94.5 | % |
Office | | 92.7 | % | | 92.1 | % | | 91.1 | % | | 90.0 | % | | 91.6 | % |
Retail | | 93.6 | % | | 91.8 | % | | 89.3 | % | | 89.7 | % | | 92.0 | % |
| | | | | | | | | | |
Overall Portfolio | | 93.7 | % | | 93.0 | % | | 91.7 | % | | 90.9 | % | | 92.4 | % |
| | | | | | | | | | |
| | Economic Occupancy - All Properties |
Sector | | 12/31/2016 | | 9/30/2016 | | 6/30/2016 | | 3/31/2016 | | 12/31/2015 |
| | | | | | | | | | |
Multifamily | | 94.4 | % | | 94.6 | % | | 95.3 | % | | 93.9 | % | | 93.2 | % |
Office | | 91.1 | % | | 89.5 | % | | 86.6 | % | | 86.9 | % | | 88.3 | % |
Retail | | 93.6 | % | | 91.8 | % | | 89.3 | % | | 89.7 | % | | 91.1 | % |
| | | | | | | | | | |
Overall Portfolio | | 92.6 | % | | 91.5 | % | | 89.3 | % | | 89.0 | % | | 90.0 | % |
|
|
(1) Non same-store properties were: |
Acquisitions: |
Multifamily - The Wellington and Riverside Apartments |
Development/Redevelopment: |
Multifamily - The Maxwell |
Office - Silverline Center and The Army Navy Building |
Sold properties: |
Multifamily - Munson Hill Towers |
Office - Dulles Station II, Wayne Plaza, 600 Jefferson Plaza, 6110 Executive Boulevard, West Gude, 51 Monroe Street and One Central Plaza |
Retail - Montgomery Village Center |
|
| |
Acquisition and Disposition Summary | |
December 31, 2016 |
($'s in thousands) |
|
| | | | | | | | | | | | | | | |
Acquisition Summary | | | | | | | | | | | |
| Location | | Acquisition Date | | Property type | | # of units | | 12/31/2016 Leased Percentage | | Investment |
Riverside Apartments | Alexandria, VA | | May 20, 2016 | | Multifamily | | 1,222 | | 94.1 | % | | $ | 244,750 |
|
| | | | | | | | | | | |
Disposition Summary | | | | | | | | | | | |
| Location | | Disposition Date | | Property Type | | Square Feet | | Contract Sales Price | | GAAP Gain |
Maryland Office Portfolio, Transaction II | various | | September 22, 2016 | | Office | | 491,000 | | $ | 128,500 |
| | $ | 77,592 |
|
Maryland Office Portfolio, Transaction I | various | | June 27, 2016 | | Office | | 692,000 | | 111,500 |
| | 23,585 |
|
Dulles Station, Phase II (1) | Herndon, VA | | May 26, 2016 | | Office | | N/A | | 12,100 |
| | 527 |
|
| | | | | | |
| | $ | 252,100 |
| | $ | 101,704 |
|
(1) Land held for future development and an interest in a parking garage.
|
| |
Development/Redevelopment Summary | |
December 31, 2016 |
(in thousands) |
|
| | | | | | | | | |
Property and Location | Total Rentable Square Feet or # of Units | Anticipated Total Cash Cost (1) (in thousands) | Cash Cost to Date (1) (in thousands) | Anticipated Construction Completion Date | Leased % |
Development Summary | | | | | |
Trove (Wellington land parcel), Arlington, VA | 401 units | $ | 119,396 |
| $ | 17,975 |
| third quarter 2019 (2) | N/A |
| | | | | |
Redevelopment Summary | | | | | |
The Army Navy Building (3), Washington DC | 108,000 square feet | $ | 4,045 |
| $ | 1,471 |
| second quarter 2017 | 53% |
Spring Valley Village, Washington DC | 14,000 additional square feet | $ | 4,496 |
| $ | 851 |
| fourth quarter 2017 | N/A |
(1) Represents anticipated/actual cash expenditures, and excludes allocations of capitalized corporate overhead costs and interest.
(2) This development project has two phases: Phase I consists of two buildings totaling 226 units and a garage, with delivery of units anticipated to commence in third quarter 2019; Phase II consists of one building with 175 units with an anticipated construction completion date in third quarter 2020.
(3) This redevelopment project primarily consists of adding amenities, to include a lounge and conference center with access to the rooftop and a renovated penthouse, and upgrading the building's lobby and other common areas.
|
| | | | |
Commercial Leasing Summary - New Leases | | | |
|
| | | | | | | | | | | | | | | | | | | | | | | | | | | | | | | | | | | | | | | |
| 4th Quarter 2016 | | 3rd Quarter 2016 | | 2nd Quarter 2016 | | 1st Quarter 2016 | | 4th Quarter 2015 |
Gross Leasing Square Footage | | | | | | | | | | | | | | | | | | |
Office | 39,047 | | | 60,538 | | | 28,154 | | | 32,249 | | | 220,374 | |
Retail | 10,362 | | | 1,342 | | | 6,313 | | | 11,777 | | | — | |
Total | 49,409 | | | 61,880 | | | 34,467 | | | 44,026 | | | 220,374 | |
Weighted Average Term (years) | | | | | | | | | | | | | | | | | | |
Office | 4.9 | | | 6.4 | | | 6.1 | | | 7.7 | | | 6.5 | |
Retail | 9.2 | | | 8.3 | | | 8.0 | | | 9.8 | | | — | |
Total | 5.8 | | | 6.4 | | | 6.5 | | | 8.3 | | | 6.5 | |
Weighted Average Free Rent Period (months) | | | | | | | | | | | | | | | | | | |
Office Buildings | 3.0 | | | 6.1 | | | 5.9 | | | 7.5 | | | 7.1 | |
Retail Centers | 1.0 | | | 3.9 | | | 1.2 | | | 7.6 | | | — | |
Total | 2.5 | | | 6.1 | | | 5.3 | | | 7.5 | | | 7.1 | |
| | | | | | | | | | | | | | | | | | | |
Rental Rate Increases: | GAAP | | CASH | | GAAP | | CASH | | GAAP | | CASH | | GAAP | | CASH | | GAAP | | CASH |
Rate on expiring leases | | | | | | | | | | | | | | | | | | | |
Office | $ | 40.36 |
| | $ | 42.92 |
| | $ | 39.31 |
| | $ | 39.01 |
| | $ | 34.80 |
| | $ | 35.43 |
| | $ | 30.91 |
| | $ | 31.78 |
| | $ | 32.57 |
| | $ | 33.76 |
|
Retail | 38.26 |
| | 38.99 |
| | 43.67 |
| | 46.15 |
| | 28.92 |
| | 29.11 |
| | 11.93 |
| | 12.04 |
| | — |
| | — |
|
Total | $ | 39.92 |
| | $ | 42.10 |
| | $ | 39.40 |
| | $ | 39.17 |
| | $ | 33.73 |
| | $ | 34.27 |
| | $ | 25.83 |
| | $ | 26.50 |
| | $ | 32.57 |
| | $ | 33.76 |
|
| | | | | | | | | | | | | | | | | | | |
Rate on new leases | | | | | | | | | | | | | | | | | | | |
Office | $ | 42.64 |
| | $ | 39.96 |
| | $ | 44.06 |
| | $ | 40.80 |
| | $ | 39.83 |
| | $ | 37.09 |
| | $ | 40.60 |
| | $ | 36.84 |
| | $ | 39.45 |
| | $ | 36.62 |
|
Retail | 44.14 |
| | 40.37 |
| | 60.89 |
| | 55.00 |
| | 28.13 |
| | 26.45 |
| | 16.22 |
| | 14.45 |
| | — |
| | — |
|
Total | $ | 42.96 |
| | $ | 40.05 |
| | $ | 44.42 |
| | $ | 41.10 |
| | $ | 37.69 |
| | $ | 35.14 |
| | $ | 34.08 |
| | $ | 30.85 |
| | $ | 39.45 |
| | $ | 36.62 |
|
| | | | | | | | | | | | | | | | | | | |
Percentage Increase | | | | | | | | | | | | | | | | | | | |
Office | 5.7 | % | | (6.9 | )% | | 12.1 | % | | 4.6 | % | | 14.5 | % | | 4.7 | % | | 31.4 | % | | 15.9 | % | | 21.1 | % | | 8.5 | % |
Retail | 15.4 | % | | 3.5 | % | | 39.4 | % | | 19.2 | % | | (2.7 | )% | | (9.1 | )% | | 35.9 | % | | 20.0 | % | | — | % | | — | % |
Total | 7.6 | % | | (4.9 | )% | | 12.7 | % | | 4.9 | % | | 11.8 | % | | 2.5 | % | | 31.9 | % | | 16.4 | % | | 21.1 | % | | 8.5 | % |
| | | | | | | | | | | | | | | | | | | |
| Total Dollars | | $ per Sq Ft | | Total Dollars | | $ per Sq Ft | | Total Dollars | | $ per Sq Ft | | Total Dollars | | $ per Sq Ft | | Total Dollars | | $ per Sq Ft |
Tenant Improvements | | | | | | | | | | | | | | | | | | | |
Office Buildings | $ | 1,244,745 |
| | $ | 31.88 |
| | $ | 2,682,882 |
| | $ | 44.32 |
| | $ | 1,356,810 |
| | $ | 48.19 |
| | $ | 1,571,632 |
| | $ | 48.73 |
| | $ | 13,946,572 |
| | $ | 63.29 |
|
Retail Centers | 307,953 |
| | 29.72 |
| | — |
| | — |
| | 111,840 |
| | 17.72 |
| | 203,276 |
| | 17.26 |
| | — |
| | — |
|
Subtotal | $ | 1,552,698 |
| | $ | 31.43 |
| | $ | 2,682,882 |
| | $ | 43.36 |
| | $ | 1,468,650 |
| | $ | 42.61 |
| | $ | 1,774,908 |
| | $ | 40.31 |
| | $ | 13,946,572 |
| | $ | 63.29 |
|
Leasing Commissions | | | | | | | | | | | | | | |
Office Buildings | $ | 424,951 |
| | $ | 10.88 |
| | $ | 890,195 |
| | $ | 14.70 |
| | $ | 375,882 |
| | $ | 13.35 |
| | $ | 505,349 |
| | $ | 15.67 |
| | $ | 3,165,371 |
| | $ | 14.36 |
|
Retail Centers | 212,162 |
| | 20.48 |
| | 39,380 |
| | 29.34 |
| | 80,461 |
| | 12.75 |
| | 103,983 |
| | 8.83 |
| | — |
| | — |
|
Subtotal | $ | 637,113 |
| | $ | 12.89 |
| | $ | 929,575 |
| | $ | 15.02 |
| | $ | 456,343 |
| | $ | 13.24 |
| | $ | 609,332 |
| | $ | 13.84 |
| | $ | 3,165,371 |
| | $ | 14.36 |
|
Tenant Improvements and Leasing Commissions | | | | | | | | | | | | | | |
Office Buildings | $ | 1,669,696 |
| | $ | 42.76 |
| | $ | 3,573,077 |
| | $ | 59.02 |
| | $ | 1,732,692 |
| | $ | 61.54 |
| | $ | 2,076,981 |
| | $ | 64.40 |
| | $ | 17,111,943 |
| | $ | 77.65 |
|
Retail Centers | 520,115 |
| | 50.20 |
| | 39,380 |
| | 29.34 |
| | 192,301 |
| | 30.47 |
| | 307,259 |
| | 26.09 |
| | — |
| | — |
|
Total | $ | 2,189,811 |
| | $ | 44.32 |
| | $ | 3,612,457 |
| | $ | 58.38 |
| | $ | 1,924,993 |
| | $ | 55.85 |
| | $ | 2,384,240 |
| | $ | 54.15 |
| | $ | 17,111,943 |
| | $ | 77.65 |
|
|
| |
Commercial Leasing Summary - Renewal Leases
| |
|
| | | | | | | | | | | | | | | | | | | | | | | | | | | | | | | | | | | | | | | |
| 4th Quarter 2016 | | 3rd Quarter 2016 | | 2nd Quarter 2016 | | 1st Quarter 2016 | | 4th Quarter 2015 |
Gross Leasing Square Footage | | | | | | | | | | | | | | | | | | |
Office Buildings | 64,956 | | | 151,722 | | | 30,787 | | | 193,275 | | | 42,033 | |
Retail Centers | 65,934 | | | 74,535 | | | 9,076 | | | 27,243 | | | 32,594 | |
Total | 130,890 | | | 226,257 | | | 39,863 | | | 220,518 | | | 74,627 | |
Weighted Average Term (years) | | | | | | | | | | | | |
Office Buildings | 4.9 | | | 3.7 | | | 4.6 | | | 7.1 | | | 6.6 | |
Retail Centers | 4.9 | | | 4.7 | | | 6.3 | | | 11.6 | | | 3.3 | |
Total | 4.9 | | | 4.0 | | | 5.0 | | | 7.6 | | | 5.1 | |
Weighted Average Free Rent Period (months) | | | | | | | | | | | | | | | | | | |
Office Buildings | 3.1 | | | 2.4 | | | 4.4 | | | 7.9 | | | 4.8 | |
Retail Centers | — | | | — | | | 0.7 | | | 5.1 | | | — | |
Total | 1.8 | | | 1.8 | | | 3.3 | | | 7.5 | | | 3.2 | |
| | | | | | | | | | | | | | | | | | | |
Rental Rate Increases: | GAAP | | CASH | | GAAP | | CASH | | GAAP | | CASH | | GAAP | | CASH | | GAAP | | CASH |
Rate on expiring leases | | | | | | | | | | | | | | | | | | | |
Office Buildings | $ | 43.31 |
| | $ | 43.62 |
| | $ | 35.85 |
| | $ | 36.37 |
| | $ | 30.13 |
| | $ | 31.53 |
| | $ | 36.53 |
| | $ | 38.93 |
| | $ | 35.61 |
| | $ | 37.12 |
|
Retail Centers | 27.52 |
| | 27.66 |
| | 25.03 |
| | 25.28 |
| | 32.56 |
| | 47.14 |
| | 24.53 |
| | 26.67 |
| | 21.30 |
| | 22.56 |
|
Total | $ | 35.36 |
| | $ | 35.58 |
| | $ | 32.28 |
| | $ | 32.72 |
| | $ | 30.69 |
| | $ | 35.08 |
| | $ | 35.04 |
| | $ | 37.42 |
| | $ | 29.36 |
| | $ | 30.76 |
|
| | | | | | | | | | | | | | | | | | | |
Rate on new leases | | | | | | | | | | | | | | | | | | | |
Office Buildings | $ | 46.84 |
| | $ | 44.18 |
| | $ | 42.20 |
| | $ | 40.38 |
| | $ | 34.42 |
| | $ | 32.44 |
| | $ | 40.55 |
| | $ | 37.12 |
| | $ | 37.01 |
| | $ | 34.12 |
|
Retail Centers | 30.27 |
| | 29.81 |
| | 27.61 |
| | 26.58 |
| | 41.78 |
| | 46.62 |
| | 41.49 |
| | 35.39 |
| | 25.08 |
| | 23.50 |
|
Total | $ | 38.49 |
| | $ | 36.94 |
| | $ | 37.39 |
| | $ | 35.84 |
| | $ | 36.10 |
| | $ | 35.67 |
| | $ | 40.66 |
| | $ | 36.90 |
| | $ | 31.80 |
| | $ | 29.49 |
|
| | | | | | | | | | | | | | | | | | | |
Percentage Increase | | | | | | | | | | | | | | | | | | | |
Office Buildings | 8.1 | % | | 1.3 | % | | 17.7 | % | | 11.0 | % | | 14.2 | % | | 2.9 | % | | 11.0 | % | | (4.7 | )% | | 3.9 | % | | (8.1 | )% |
Retail Centers | 10.0 | % | | 7.8 | % | | 10.3 | % | | 5.1 | % | | 28.3 | % | | (1.1 | )% | | 69.2 | % | | 32.7 | % | | 17.8 | % | | 4.2 | % |
Total | 8.9 | % | | 3.8 | % | | 15.8 | % | | 9.5 | % | | 17.6 | % | | 1.7 | % | | 16.0 | % | | (1.4 | )% | | 8.3 | % | | (4.1 | )% |
| | | | | | | | | | | | | | | | | | | |
| Total Dollars | | $ per Sq Ft | | Total Dollars | | $ per Sq Ft | | Total Dollars | | $ per Sq Ft | | Total Dollars | | $ per Sq Ft | | Total Dollars | | $ per Sq Ft |
Tenant Improvements | | | | | | | | | | | | | | | | | | | |
Office Buildings | $ | 1,068,629 |
| | $ | 16.45 |
| | $ | 2,243,523 |
| | $ | 14.79 |
| | $ | 153,365 |
| | $ | 4.98 |
| | $ | 6,945,781 |
| | $ | 35.94 |
| | $ | 1,580,078 |
| | $ | 37.59 |
|
Retail Centers | 56,940 |
| | 0.86 |
| | — |
| | — |
| | — |
| | — |
| | 626,200 |
| | 22.99 |
| | — |
| | — |
|
Subtotal | $ | 1,125,569 |
| | $ | 8.60 |
| | $ | 2,243,523 |
| | $ | 9.92 |
| | $ | 153,365 |
| | $ | 3.85 |
| | $ | 7,571,981 |
| | $ | 34.34 |
| | $ | 1,580,078 |
| | $ | 21.17 |
|
Leasing Commissions | | | | | | | | | | | | | | | | |
Office Buildings | $ | 735,713 |
| | $ | 11.33 |
| | $ | 780,080 |
| | $ | 5.14 |
| | $ | 198,223 |
| | $ | 6.44 |
| | $ | 2,801,717 |
| | $ | 14.50 |
| | $ | 443,229 |
| | $ | 10.54 |
|
Retail Centers | 120,858 |
| | 1.83 |
| | 124,121 |
| | 1.67 |
| | 74,824 |
| | 8.24 |
| | 394,380 |
| | 14.48 |
| | 59,302 |
| | 1.82 |
|
Subtotal | $ | 856,571 |
| | $ | 6.54 |
| | $ | 904,201 |
| | $ | 4.00 |
| | $ | 273,047 |
| | $ | 6.85 |
| | $ | 3,196,097 |
| | $ | 14.49 |
| | $ | 502,531 |
| | $ | 6.73 |
|
Tenant Improvements and Leasing Commissions | | | | | | | | | | |
Office Buildings | $ | 1,804,342 |
| | $ | 27.78 |
| | $ | 3,023,603 |
| | $ | 19.93 |
| | $ | 351,588 |
| | $ | 11.42 |
| | $ | 9,747,498 |
| | $ | 50.44 |
| | $ | 2,023,307 |
| | $ | 48.13 |
|
Retail Centers | 177,798 |
| | 2.69 |
| | 124,121 |
| | 1.67 |
| | 74,824 |
| | 8.24 |
| | 1,020,580 |
| | 37.47 |
| | 59,302 |
| | 1.82 |
|
Total | $ | 1,982,140 |
| | $ | 15.14 |
| | $ | 3,147,724 |
| | $ | 13.92 |
| | $ | 426,412 |
| | $ | 10.70 |
| | $ | 10,768,078 |
| | $ | 48.83 |
| | $ | 2,082,609 |
| | $ | 27.90 |
|
|
| |
10 Largest Tenants - Based on Annualized Commercial Income | |
December 31, 2016 |
|
| | | | | | | | | | | | |
Tenant | Number of Buildings | | Weighted Average Remaining Lease Term in Months | | Percentage of Aggregate Portfolio Annualized Rent | | Aggregate Rentable Square Feet | | Percentage of Aggregate Occupied Square Feet |
| | | | | | | | | |
World Bank | 1 | | 48 | | 6.25 | % | | 210,354 |
| | 3.84 | % |
Advisory Board Company | 2 | | 29 | | 4.12 | % | | 199,762 |
| | 3.64 | % |
Engility Corporation | 1 | | 9 | | 2.94 | % | | 134,126 |
| | 2.45 | % |
Capital One | 1 | | 63 | | 2.80 | % | | 136,556 |
| | 2.49 | % |
Squire Patton Boggs (USA) LLP (1) | 1 | | 4 | | 2.77 | % | | 110,566 |
| | 2.02 | % |
Booz Allen Hamilton, Inc. | 1 | | 109 | | 2.57 | % | | 222,989 |
| | 4.07 | % |
Epstein Becker & Green, PC | 1 | | 144 | | 1.55 | % | | 55,318 |
| | 1.01 | % |
Hughes Hubbard & Reed LLP (2) | 1 | | 14 | | 1.36 | % | | 52,878 |
| | 0.97 | % |
Alexandria City School Board | 1 | | 149 | | 1.36 | % | | 84,693 |
| | 1.54 | % |
Morgan Stanley Smith Barney Financing | 1 | | 50 | | 1.18 | % | | 49,395 |
| | 0.90 | % |
Total/Weighted Average | | | 59 | | 26.90 | % | | 1,256,637 |
| | 22.93 | % |
(1) The space leased to Squire Patton Boggs LLP is currently subleased to Advisory Board Company, who has signed an extension to make the lease coterminous with the remaining Advisory Board Company’s leases expiring on May 31, 2019.
(2) Hughes Hubbard & Reed LLP signed an early renewal for 47,411 square feet for 16 years commencing on January 1, 2017 and expiring on December 31, 2032.
|
| |
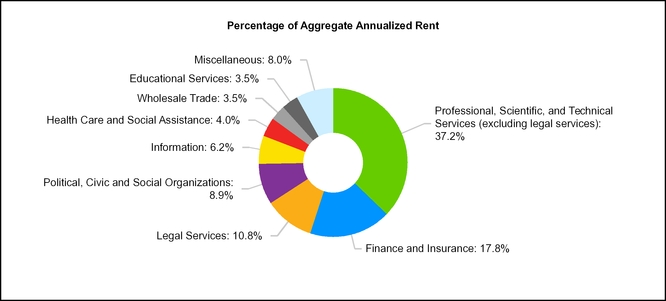
Industry Diversification - Office | |
December 31, 2016 |
|
| | | | | | | | | | | | |
Industry Classification (NAICS) | Annualized Base Rental Revenue | | Percentage of Aggregate Annualized Rent | | Aggregate Rentable Square Feet | | Percentage of Aggregate Square Feet |
Office: | | | | | | | |
Professional, Scientific, and Technical Services (excluding legal services) | $ | 47,249,875 |
| | 37.21 | % | | 1,359,672 |
| | 40.83 | % |
Finance and Insurance | 22,570,685 |
| | 17.77 | % | | 491,334 |
| | 14.75 | % |
Legal Services | 13,710,409 |
| | 10.79 | % | | 312,421 |
| | 9.38 | % |
Political, Civic and Social Organizations | 11,365,327 |
| | 8.95 | % | | 281,880 |
| | 8.46 | % |
Information | 7,906,132 |
| | 6.22 | % | | 191,434 |
| | 5.75 | % |
Health Care and Social Assistance | 5,055,963 |
| | 3.98 | % | | 149,949 |
| | 4.50 | % |
Wholesale Trade | 4,495,313 |
| | 3.54 | % | | 103,177 |
| | 3.10 | % |
Educational Services | 4,457,228 |
| | 3.51 | % | | 140,917 |
| | 4.23 | % |
Miscellaneous: | | | | | | | |
Administrative and Support and Waste Management and Remediation Services | 2,557,295 |
| | 2.01 | % | | 59,195 |
| | 1.78 | % |
Real Estate and Rental and Leasing | 1,821,467 |
| | 1.43 | % | | 44,132 |
| | 1.33 | % |
Accommodation and Food Services | 1,731,972 |
| | 1.36 | % | | 43,599 |
| | 1.31 | % |
Construction | 872,881 |
| | 0.69 | % | | 27,363 |
| | 0.82 | % |
Other | 3,231,990 |
| | 2.54 | % | | 125,330 |
| | 3.76 | % |
Total | $ | 127,026,537 |
| | 100.00 | % | | 3,330,403 |
| | 100.00 | % |
Note: Federal government tenants comprise less than 0.1% of annualized base rental revenue.
|
| |
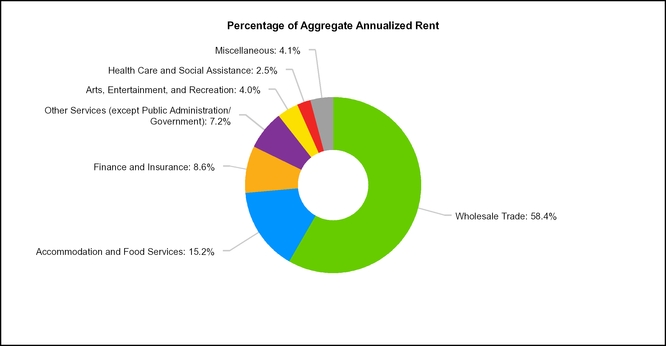
Industry Diversification - Retail
| |
December 31, 2016 |
|
| | | | | | | | | | | | |
Industry Classification (NAICS) | Annualized Base Rental Revenue | | Percentage of Aggregate Annualized Rent | | Aggregate Rentable Square Feet | | Percentage of Aggregate Square Feet |
Retail: | | | | | | | |
Wholesale Trade | $ | 28,390,141 |
| | 58.40 | % | | 1,540,477 |
| | 71.36 | % |
Accommodation and Food Services | 7,376,372 |
| | 15.18 | % | | 233,641 |
| | 10.82 | % |
Finance and Insurance | 4,180,386 |
| | 8.60 | % | | 56,299 |
| | 2.61 | % |
Other Services (except Public Administration/Government) | 3,477,906 |
| | 7.16 | % | | 108,982 |
| | 5.05 | % |
Arts, Entertainment, and Recreation | 1,961,674 |
| | 4.04 | % | | 115,586 |
| | 5.35 | % |
Health Care and Social Assistance | 1,198,389 |
| | 2.47 | % | | 31,602 |
| | 1.46 | % |
Miscellaneous: | | | | | | | |
Manufacturing | 544,860 |
| | 1.12 | % | | 17,547 |
| | 0.81 | % |
Educational Services | 422,188 |
| | 0.87 | % | | 25,598 |
| | 1.19 | % |
Information (Broadcasting, Publishing, Telecommunications) | 354,305 |
| | 0.73 | % | | 8,347 |
| | 0.39 | % |
Other | 694,888 |
| | 1.43 | % | | 20,740 |
| | 0.96 | % |
Total | $ | 48,601,109 |
| | 100.00 | % | | 2,158,819 |
| | 100.00 | % |
|
| |
Lease Expirations | |
December 31, 2016 |
|
| | | | | | | | | | | | | | | | | | | | |
Year | | Number of Leases | | Rentable Square Feet | | Percent of Rentable Square Feet | | Annualized Rent (1) | | Average Rental Rate | | Percent of Annualized Rent (1) |
Office: | | | | | | | | | | | | |
2017 | | 51 |
| | 466,506 |
| | 13.16 | % | | $ | 18,422,741 |
| | $ | 39.49 |
| | 11.94 | % |
2018 | | 43 |
| | 272,505 |
| | 7.69 | % | | 11,509,975 |
| | 42.24 |
| | 7.46 | % |
2019 | | 54 |
| | 547,687 |
| | 15.45 | % | | 21,837,943 |
| | 39.87 |
| | 14.16 | % |
2020 | | 45 |
| | 398,973 |
| | 11.25 | % | | 19,434,213 |
| | 48.71 |
| | 12.60 | % |
2021 | | 57 |
| | 413,066 |
| | 11.65 | % | | 17,544,508 |
| | 42.47 |
| | 11.38 | % |
2022 and thereafter | | 156 |
| | 1,446,298 |
| | 40.80 | % | | 65,486,883 |
| | 45.28 |
| | 42.46 | % |
| | 406 |
| | 3,545,035 |
| | 100.00 | % | | $ | 154,236,263 |
| | 43.51 |
| | 100.00 | % |
Retail: | | | | | | | | | | | | |
2017 | | 33 |
| | 150,977 |
| | 7.02 | % | | $ | 4,231,252 |
| | $ | 28.03 |
| | 8.08 | % |
2018 | | 35 |
| | 331,598 |
| | 15.43 | % | | 4,739,308 |
| | 14.29 |
| | 9.05 | % |
2019 | | 34 |
| | 167,211 |
| | 7.78 | % | | 4,731,260 |
| | 28.30 |
| | 9.04 | % |
2020 | | 40 |
| | 436,469 |
| | 20.31 | % | | 7,814,963 |
| | 17.90 |
| | 14.93 | % |
2021 | | 23 |
| | 218,039 |
| | 10.14 | % | | 3,891,705 |
| | 17.85 |
| | 7.44 | % |
2022 and thereafter | | 124 |
| | 845,203 |
| | 39.32 | % | | 26,931,802 |
| | 31.86 |
| | 51.46 | % |
| | 289 |
| | 2,149,497 |
| | 100.00 | % | | $ | 52,340,290 |
| | 24.35 |
| | 100.00 | % |
Total: | | | | | | | | | | | | |
2017 | | 84 |
| | 617,483 |
| | 10.84 | % | | $ | 22,653,993 |
| | $ | 36.69 |
| | 10.97 | % |
2018 | | 78 |
| | 604,103 |
| | 10.61 | % | | 16,249,283 |
| | 26.90 |
| | 7.87 | % |
2019 | | 88 |
| | 714,898 |
| | 12.55 | % | | 26,569,203 |
| | 37.17 |
| | 12.86 | % |
2020 | | 85 |
| | 835,442 |
| | 14.67 | % | | 27,249,176 |
| | 32.62 |
| | 13.19 | % |
2021 | | 80 |
| | 631,105 |
| | 11.08 | % | | 21,436,213 |
| | 33.97 |
| | 10.38 | % |
2022 and thereafter | | 280 |
| | 2,291,501 |
| | 40.25 | % | | 92,418,685 |
| | 40.33 |
| | 44.73 | % |
| | 695 |
| | 5,694,532 |
| | 100.00 | % | | $ | 206,576,553 |
| | 36.28 |
| | 100.00 | % |
| | | | | | | | | | | | |
| | |
(1) Annualized Rent is equal to the rental rate effective at lease expiration (cash basis) multiplied by 12. | | |
|
| |
Schedule of Properties | |
December 31, 2016 |
|
| | | | | | | | | | | | |
PROPERTIES | | LOCATION | | YEAR ACQUIRED | | YEAR CONSTRUCTED | | NET RENTABLE SQUARE FEET(1) | | Physical Occupancy |
Office Buildings | | | | | | | | | | |
515 King Street | | Alexandria, VA | | 1992 | | 1966 | | 75,000 |
| | 94 | % |
Courthouse Square | | Alexandria, VA | | 2000 | | 1979 | | 118,000 |
| | 94 | % |
Braddock Metro Center | | Alexandria, VA | | 2011 | | 1985 | | 348,000 |
| | 99 | % |
1600 Wilson Boulevard | | Arlington, VA | | 1997 | | 1973 | | 169,000 |
| | 96 | % |
Fairgate at Ballston | | Arlington, VA | | 2012 | | 1988 | | 143,000 |
| | 78 | % |
Monument II | | Herndon, VA | | 2007 | | 2000 | | 208,000 |
| | 85 | % |
925 Corporate Drive | | Stafford, VA | | 2010 | | 2007 | | 134,000 |
| | 73 | % |
1000 Corporate Drive | | Stafford, VA | | 2010 | | 2009 | | 136,000 |
| | 79 | % |
Silverline Center | | Tysons, VA | | 1997 | | 1972/1986/1999/2014 | | 546,000 |
| | 94 | % |
John Marshall II | | Tysons, VA | | 2011 | | 1996/2010 | | 223,000 |
| | 100 | % |
1901 Pennsylvania Avenue | | Washington, DC | | 1977 | | 1960 | | 102,000 |
| | 75 | % |
1220 19th Street | | Washington, DC | | 1995 | | 1976 | | 103,000 |
| | 99 | % |
1776 G Street | | Washington, DC | | 2003 | | 1979 | | 265,000 |
| | 92 | % |
2000 M Street | | Washington, DC | | 2007 | | 1971 | | 231,000 |
| | 96 | % |
2445 M Street | | Washington, DC | | 2008 | | 1986 | | 290,000 |
| | 100 | % |
1140 Connecticut Avenue | | Washington, DC | | 2011 | | 1966 | | 183,000 |
| | 88 | % |
1227 25th Street | | Washington, DC | | 2011 | | 1988 | | 136,000 |
| | 95 | % |
Army Navy Building | | Washington, DC | | 2014 | | 1912/1987 | | 108,000 |
| | 51 | % |
1775 Eye Street, NW | | Washington, DC | | 2014 | | 1964 | | 186,000 |
| | 100 | % |
Subtotal | | | | | | | | 3,704,000 |
| | 91 | % |
|
| |
Schedule of Properties | |
December 31, 2016 |
|
| | | | | | | | | | | | |
PROPERTIES | | LOCATION | | YEAR ACQUIRED | | YEAR CONSTRUCTED | | NET RENTABLE SQUARE FEET (1) | | Physical Occupancy |
Retail Centers | | | | | | | | | | |
Bradlee Shopping Center | | Alexandria, VA | | 1984 | | 1955 | | 172,000 |
| | 98 | % |
Shoppes of Foxchase | | Alexandria, VA | | 1994 | | 1960/2006 | | 134,000 |
| | 98 | % |
800 S. Washington Street | | Alexandria, VA | | 1998/2003 | | 1955/1959 | | 46,000 |
| | 93 | % |
Concord Centre | | Springfield, VA | | 1973 | | 1960 | | 76,000 |
| | 94 | % |
Gateway Overlook | | Columbia, MD | | 2010 | | 2007 | | 220,000 |
| | 97 | % |
Frederick County Square | | Frederick, MD | | 1995 | | 1973 | | 227,000 |
| | 98 | % |
Frederick Crossing | | Frederick, MD | | 2005 | | 1999/2003 | | 295,000 |
| | 99 | % |
Centre at Hagerstown | | Hagerstown, MD | | 2002 | | 2000 | | 331,000 |
| | 95 | % |
Olney Village Center | | Olney, MD | | 2011 | | 1979/2003 | | 199,000 |
| | 98 | % |
Randolph Shopping Center | | Rockville, MD | | 2006 | | 1972 | | 82,000 |
| | 81 | % |
Montrose Shopping Center | | Rockville, MD | | 2006 | | 1970 | | 145,000 |
| | 98 | % |
Takoma Park | | Takoma Park, MD | | 1963 | | 1962 | | 51,000 |
| | 100 | % |
Westminster | | Westminster, MD | | 1972 | | 1969 | | 150,000 |
| | 98 | % |
Wheaton Park | | Wheaton, MD | | 1977 | | 1967 | | 74,000 |
| | 91 | % |
Chevy Chase Metro Plaza | | Washington, DC | | 1985 | | 1975 | | 50,000 |
| | 87 | % |
Spring Valley Retail Center | | Washington, DC | | 2014 | | 1941/1950 | | 78,000 |
| | 81 | % |
Subtotal | | | | | | | | 2,330,000 |
| | 96 | % |
|
| |
Schedule of Properties | |
December 31, 2016 |
|
| | | | | | | | | | | | |
PROPERTIES | | LOCATION | | YEAR ACQUIRED | | YEAR CONSTRUCTED | | NET RENTABLE SQUARE FEET (1) | | Physical Occupancy (2) |
Multifamily Buildings / # units | | | | | | | | | | |
Clayborne / 74 | | Alexandria, VA | | 2008 | | 2008 | | 60,000 |
| | 100 | % |
Riverside Apartments / 1,222 | | Alexandria, VA | | 2016 | | 1971 | | 1,266,000 |
| | 92 | % |
Park Adams / 200 | | Arlington, VA | | 1969 | | 1959 | | 173,000 |
| | 97 | % |
Bennett Park / 224 | | Arlington, VA | | 2007 | | 2007 | | 214,000 |
| | 96 | % |
The Paramount /135 | | Arlington, VA | | 2013 | | 1984 | | 141,000 |
| | 96 | % |
The Maxwell / 163 | | Arlington, VA | | 2014 | | 2014 | | 139,000 |
| | 92 | % |
The Wellington / 711 | | Arlington, VA | | 2015 | | 1960 | | 842,000 |
| | 94 | % |
Roosevelt Towers / 191 | | Falls Church, VA | | 1965 | | 1964 | | 170,000 |
| | 95 | % |
The Ashby at McLean / 256 | | McLean, VA | | 1996 | | 1982 | | 274,000 |
| | 97 | % |
Bethesda Hill Apartments /195 | | Bethesda, MD | | 1997 | | 1986 | | 225,000 |
| | 97 | % |
Walker House Apartments / 212 | | Gaithersburg, MD | | 1996 | | 1971/2003 | | 157,000 |
| | 94 | % |
3801 Connecticut Avenue / 307 | | Washington, DC | | 1963 | | 1951 | | 178,000 |
| | 97 | % |
Kenmore Apartments / 374 | | Washington, DC | | 2008 | | 1948 | | 268,000 |
| | 96 | % |
Yale West / 216 | | Washington, DC | | 2014 | | 2011 | | 238,000 |
| | 97 | % |
Subtotal (4,480 units) | | | | | | | | 4,345,000 |
| | 95 | % |
TOTAL | | | | | | | | 10,379,000 |
| | |
(1) Multifamily buildings are presented in gross square feet.
(2) Multifamily physical occupancy is calculated based on units occupied.
|
| |
Supplemental Definitions
| |
December 31, 2016 |
|
|
Adjusted EBITDA (a non-GAAP measure) is earnings attributable to the controlling interest before interest expense, taxes, depreciation, amortization, real estate impairment, casualty gain, gain on sale of real estate, gain/loss on extinguishment of debt, severance expense, relocation expense, acquisition and structuring expenses and gain/loss from non-disposal activities. |
Annualized base rent ("ABR") is calculated as monthly base rent (cash basis) per the lease, as of the reporting period, multiplied by 12. |
Debt service coverage ratio is computed by dividing earnings attributable to the controlling interest before interest expense, taxes, depreciation, amortization, real estate impairment, gain on sale of real estate, gain/loss on extinguishment of debt, severance expense, relocation expense, acquisition and structuring expenses and gain/loss from non-disposal activities by interest expense (including interest expense from discontinued operations) and principal amortization. |
Debt to total market capitalization is total debt divided by the sum of total debt plus the market value of shares outstanding at the end of the period. |
Earnings to fixed charges ratio is computed by dividing earnings attributable to the controlling interest by fixed charges. For this purpose, earnings consist of income from continuing operations (or net income if there are no discontinued operations) plus fixed charges, less capitalized interest. Fixed charges consist of interest expense (excluding interest expense from discontinued operations), including amortized costs of debt issuance, plus interest costs capitalized. |
Economic occupancy is calculated as actual real estate rental revenue recognized for the period indicated as a percentage of gross potential real estate rental revenue for that period. We determine gross potential real estate rental revenue by valuing occupied units or square footage at contract rates and vacant units or square footage at market rates for comparable properties. We do not consider percentage rents and expense reimbursements in computing economic occupancy percentages. |
NAREIT Funds from operations ("NAREIT FFO") is defined by National Association of Real Estate Investment Trusts, Inc. (“NAREIT”) in an April, 2002 White Paper as net income (computed in accordance with generally accepted accounting principles (“GAAP”) excluding gains (or losses) associated with sales of property, impairment of depreciable real estate and real estate depreciation and amortization. We consider NAREIT FFO to be a standard supplemental measure for equity real estate investment trusts (“REITs”) because it facilitates an understanding of the operating performance of our properties without giving effect to real estate depreciation and amortization, which historically assumes that the value of real estate assets diminishes predictably over time. Since real estate values have instead historically risen or fallen with market conditions, we believe that NAREIT FFO more accurately provides investors an indication of our ability to incur and service debt, make capital expenditures and fund other needs. NAREIT FFO is a non-GAAP measure. |
Core Funds From Operations ("Core FFO") is calculated by adjusting NAREIT FFO for the following items (which we believe are not indicative of the performance of Washington REIT’s operating portfolio and affect the comparative measurement of Washington REIT’s operating performance over time): (1) gains or losses on extinguishment of debt, (2) expenses related to acquisition and structuring activities, (3) executive transition costs and severance expense related to corporate reorganization and related to executive retirements or resignations, (4) property impairments, casualty gains and losses, and gains or losses on sale not already excluded from NAREIT FFO, as appropriate, and (5) relocation expense. These items can vary greatly from period to period, depending upon the volume of our acquisition activity and debt retirements, among other factors. We believe that by excluding these items, Core FFO serves as a useful, supplementary measure of Washington REIT’s ability to incur and service debt, and distribute dividends to its shareholders. Core FFO is a non-GAAP and non-standardized measure, and may be calculated differently by other REITs. |
Funds Available for Distribution ("FAD") is calculated by subtracting from NAREIT FFO (1) recurring expenditures, tenant improvements and leasing costs, that are capitalized and amortized and are necessary to maintain our properties and revenue stream (excluding items contemplated prior to acquisition or associated with development / redevelopment of a property) and (2) straight line rents, then adding (3) non-real estate depreciation and amortization, (4) non-cash fair value interest expense and (5) amortization of restricted share compensation, then adding or subtracting the (6) amortization of lease intangibles, (7) real estate impairment and (8) non-cash gain/loss on extinguishment of debt, as appropriate. FAD is included herein, because we consider it to be a performance measure of a REIT’s ability to incur and service debt and to distribute dividends to its shareholders. FAD is a non-GAAP and non-standardized measure, and may be calculated differently by other REITs. |
Core Funds Available for Distribution ("Core FAD") is calculated by adjusting FAD for the following items (which we believe are not indicative of the performance of Washington REIT’s operating portfolio and affect the comparative measurement of Washington REIT’s operating performance over time): (1) gains or losses on extinguishment of debt, (2) costs related to the acquisition of properties, (3) non-share-based severance expense related to corporate reorganization and related to executive retirements or resignations, (4) property impairments, casualty gains and losses, and gains or losses on sale not already excluded from FAD, as appropriate, and (5) relocation expense. These items can vary greatly from period to period, depending upon the volume of our acquisition activity and debt retirements, among other factors. We believe that by excluding these items, Core FAD serves as a useful, supplementary performance measure of Washington REIT’s ability to incur and service debt, and distribute dividends to its shareholders. Core FAD is a non-GAAP and non-standardized measure, and may be calculated differently by other REITs. |
|
|
Net Operating Income (“NOI”) is a non-GAAP measure defined as real estate rental revenue less real estate expenses. NOI is calculated as net income, less non-real estate revenue and the results of discontinued operations (including the gain on sale, if any), plus interest expense, depreciation and amortization, general and administrative expenses, acquisition costs, real estate impairment, casualty gains and losses, and gain or loss on extinguishment of debt. We also present NOI on a cash basis ("Cash NOI") which is calculated as NOI less the impact of straightlining of rent and amortization of market intangibles. We provide each of NOI and cash NOI as a supplement to net income calculated in accordance with GAAP. As such, neither should be considered an alternative to net income as an indication of our operating performance. They are the primary performance measures we use to assess the results of our operations at the property level. |
Physical occupancy is calculated as occupied square footage as a percentage of total square footage as of the last day of that period. Multifamily unit basis physical occupancy is calculated as occupied units as a percentage of total units as of the last day of that period. |
Recurring capital expenditures represent non-accretive building improvements and leasing costs required to maintain current revenues. Recurring capital expenditures do not include acquisition capital that was taken into consideration when underwriting the purchase of a building or which are incurred to bring a building up to "operating standard." |
Rent increases on renewals and rollovers are calculated as the difference, weighted by square feet, of the net ABR due the first month after a term commencement date and the net ABR due the last month prior to the termination date of the former tenant's term. |
Same-store portfolio properties include all stabilized properties that were owned for the entirety of the current and prior reporting periods, and exclude properties under redevelopment or development and properties purchased or sold at any time during the periods being compared. We define redevelopment properties as those for which we expect to spend significant development and construction costs on existing or acquired buildings pursuant to a formal plan which has a current impact on operating results, occupancy and the ability to lease space with the intended result of a higher economic return on the property. Redevelopment and development properties are included in the same-store pool upon completion of the redevelopment or development, and the earlier of achieving 90% occupancy or two years after completion. |
Same-store portfolio net operating income (NOI) growth is the change in the NOI of the same-store portfolio properties from the prior reporting period to the current reporting period. |