000010489412/312020Q2falseus-gaap:RealEstateMemberus-gaap:RealEstateMemberus-gaap:RealEstateMemberus-gaap:RealEstateMemberus-gaap:RealEstateMemberus-gaap:RealEstateMemberus-gaap:RealEstateMemberus-gaap:RealEstateMemberus-gaap:RentalPropertiesus-gaap:AccountsPayableAndAccruedLiabilitiesCurrentAndNoncurrentP4YP6MP6MP1YP1YP10YP3Y0.333300001048942020-01-012020-06-30xbrli:shares00001048942020-07-27iso4217:USD00001048942020-06-3000001048942019-12-31iso4217:USDxbrli:shares00001048942019-01-012019-06-3000001048942020-04-012020-06-3000001048942019-04-012019-06-300000104894us-gaap:CommonStockMember2019-12-310000104894us-gaap:AdditionalPaidInCapitalMember2019-12-310000104894us-gaap:AccumulatedDistributionsInExcessOfNetIncomeMember2019-12-310000104894us-gaap:AccumulatedOtherComprehensiveIncomeMember2019-12-310000104894us-gaap:ParentMember2019-12-310000104894us-gaap:NoncontrollingInterestMember2019-12-310000104894us-gaap:AccumulatedDistributionsInExcessOfNetIncomeMember2020-01-012020-06-300000104894us-gaap:ParentMember2020-01-012020-06-300000104894us-gaap:AccumulatedOtherComprehensiveIncomeMember2020-01-012020-06-300000104894us-gaap:NoncontrollingInterestMember2020-01-012020-06-300000104894us-gaap:CommonStockMember2020-01-012020-06-300000104894us-gaap:AdditionalPaidInCapitalMember2020-01-012020-06-300000104894us-gaap:CommonStockMember2020-06-300000104894us-gaap:AdditionalPaidInCapitalMember2020-06-300000104894us-gaap:AccumulatedDistributionsInExcessOfNetIncomeMember2020-06-300000104894us-gaap:AccumulatedOtherComprehensiveIncomeMember2020-06-300000104894us-gaap:ParentMember2020-06-300000104894us-gaap:NoncontrollingInterestMember2020-06-300000104894us-gaap:CommonStockMember2018-12-310000104894us-gaap:AdditionalPaidInCapitalMember2018-12-310000104894us-gaap:AccumulatedDistributionsInExcessOfNetIncomeMember2018-12-310000104894us-gaap:AccumulatedOtherComprehensiveIncomeMember2018-12-310000104894us-gaap:ParentMember2018-12-310000104894us-gaap:NoncontrollingInterestMember2018-12-3100001048942018-12-310000104894wre:CumulativeEffectPeriodOfAdoptionAdjustmentMemberus-gaap:AccumulatedDistributionsInExcessOfNetIncomeMember2018-12-310000104894wre:CumulativeEffectPeriodOfAdoptionAdjustmentMemberus-gaap:ParentMember2018-12-310000104894wre:CumulativeEffectPeriodOfAdoptionAdjustmentMember2018-12-310000104894us-gaap:AccumulatedDistributionsInExcessOfNetIncomeMember2019-01-012019-06-300000104894us-gaap:ParentMember2019-01-012019-06-300000104894us-gaap:AccumulatedOtherComprehensiveIncomeMember2019-01-012019-06-300000104894us-gaap:NoncontrollingInterestMember2019-01-012019-06-300000104894us-gaap:CommonStockMember2019-01-012019-06-300000104894us-gaap:AdditionalPaidInCapitalMember2019-01-012019-06-300000104894us-gaap:CommonStockMember2019-06-300000104894us-gaap:AdditionalPaidInCapitalMember2019-06-300000104894us-gaap:AccumulatedDistributionsInExcessOfNetIncomeMember2019-06-300000104894us-gaap:AccumulatedOtherComprehensiveIncomeMember2019-06-300000104894us-gaap:ParentMember2019-06-300000104894us-gaap:NoncontrollingInterestMember2019-06-3000001048942019-06-300000104894us-gaap:CommonStockMember2020-03-310000104894us-gaap:AdditionalPaidInCapitalMember2020-03-310000104894us-gaap:AccumulatedDistributionsInExcessOfNetIncomeMember2020-03-310000104894us-gaap:AccumulatedOtherComprehensiveIncomeMember2020-03-310000104894us-gaap:ParentMember2020-03-310000104894us-gaap:NoncontrollingInterestMember2020-03-3100001048942020-03-310000104894us-gaap:AccumulatedDistributionsInExcessOfNetIncomeMember2020-04-012020-06-300000104894us-gaap:ParentMember2020-04-012020-06-300000104894us-gaap:AccumulatedOtherComprehensiveIncomeMember2020-04-012020-06-300000104894us-gaap:NoncontrollingInterestMember2020-04-012020-06-300000104894us-gaap:CommonStockMember2020-04-012020-06-300000104894us-gaap:AdditionalPaidInCapitalMember2020-04-012020-06-300000104894us-gaap:CommonStockMember2019-03-310000104894us-gaap:AdditionalPaidInCapitalMember2019-03-310000104894us-gaap:AccumulatedDistributionsInExcessOfNetIncomeMember2019-03-310000104894us-gaap:AccumulatedOtherComprehensiveIncomeMember2019-03-310000104894us-gaap:ParentMember2019-03-310000104894us-gaap:NoncontrollingInterestMember2019-03-3100001048942019-03-310000104894us-gaap:AccumulatedDistributionsInExcessOfNetIncomeMember2019-04-012019-06-300000104894us-gaap:ParentMember2019-04-012019-06-300000104894us-gaap:AccumulatedOtherComprehensiveIncomeMember2019-04-012019-06-300000104894us-gaap:NoncontrollingInterestMember2019-04-012019-06-300000104894us-gaap:CommonStockMember2019-04-012019-06-300000104894us-gaap:AdditionalPaidInCapitalMember2019-04-012019-06-300000104894wre:TaxableReitSubsidiaryMember2020-06-300000104894wre:TaxableReitSubsidiaryMember2019-12-31wre:unit0000104894wre:AssemblyPortfolioVirginiaMemberwre:AcquisitionGroup2019Membersrt:MultifamilyMember2019-04-300000104894wre:AssemblyPortfolioVirginiaMemberwre:AcquisitionGroup2019Membersrt:MultifamilyMember2019-04-302019-04-300000104894wre:AcquisitionGroup2019Membersrt:MultifamilyMemberwre:AssemblyPortfolioMarylandMember2019-06-270000104894wre:AcquisitionGroup2019Membersrt:MultifamilyMemberwre:AssemblyPortfolioMarylandMember2019-06-272019-06-270000104894wre:AcquisitionGroup2019Member2019-06-300000104894wre:AcquisitionGroup2019Member2019-01-012019-06-300000104894wre:TheTroveMember2020-06-300000104894wre:TheTroveMember2020-01-012020-06-300000104894wre:RiversideDevelopmentsMember2020-06-30utr:sqft0000104894srt:OfficeBuildingMemberwre:JohnMarshallIiMemberwre:TwoThousandTwentyPropertiesSoldGroupMemberus-gaap:DisposalGroupDisposedOfBySaleNotDiscontinuedOperationsMember2020-04-210000104894srt:OfficeBuildingMemberwre:JohnMarshallIiMemberwre:TwoThousandTwentyPropertiesSoldGroupMemberus-gaap:DisposalGroupDisposedOfBySaleNotDiscontinuedOperationsMember2020-04-212020-04-210000104894wre:TwoThousandTwentyPropertiesSoldGroupMember2020-06-300000104894wre:TwoThousandTwentyPropertiesSoldGroupMember2020-01-012020-06-300000104894srt:OfficeBuildingMemberwre:QuanticoCorporateCenterMemberwre:TwoThousandNineteenPropertiesSoldGroupMemberus-gaap:DisposalGroupDisposedOfBySaleNotDiscontinuedOperationsMember2019-06-260000104894srt:OfficeBuildingMemberwre:QuanticoCorporateCenterMemberwre:TwoThousandNineteenPropertiesSoldGroupMemberus-gaap:DisposalGroupDisposedOfBySaleNotDiscontinuedOperationsMember2019-06-262019-06-260000104894srt:RetailSiteMemberwre:TwoThousandNineteenPropertiesSoldGroupMemberus-gaap:DiscontinuedOperationsHeldForSaleOrDisposedOfBySaleMemberwre:ShoppingCenterPortfolioMember2019-07-230000104894srt:RetailSiteMemberwre:TwoThousandNineteenPropertiesSoldGroupMemberus-gaap:DiscontinuedOperationsHeldForSaleOrDisposedOfBySaleMemberwre:ShoppingCenterPortfolioMember2019-07-232019-07-230000104894srt:RetailSiteMemberwre:TwoThousandNineteenPropertiesSoldGroupMemberwre:FrederickCrossingAndFrederickCountySquareMemberus-gaap:DiscontinuedOperationsHeldForSaleOrDisposedOfBySaleMember2019-08-210000104894srt:RetailSiteMemberwre:TwoThousandNineteenPropertiesSoldGroupMemberwre:FrederickCrossingAndFrederickCountySquareMemberus-gaap:DiscontinuedOperationsHeldForSaleOrDisposedOfBySaleMember2019-08-212019-08-210000104894srt:RetailSiteMemberwre:TwoThousandNineteenPropertiesSoldGroupMemberus-gaap:DiscontinuedOperationsHeldForSaleOrDisposedOfBySaleMemberwre:CentreatHagerstownMember2019-08-270000104894srt:RetailSiteMemberwre:TwoThousandNineteenPropertiesSoldGroupMemberus-gaap:DiscontinuedOperationsHeldForSaleOrDisposedOfBySaleMemberwre:CentreatHagerstownMember2019-08-272019-08-270000104894srt:OfficeBuildingMemberwre:TwoThousandNineteenPropertiesSoldGroupMemberus-gaap:DisposalGroupDisposedOfBySaleNotDiscontinuedOperationsMemberwre:A1776GStreetMember2019-12-190000104894srt:OfficeBuildingMemberwre:TwoThousandNineteenPropertiesSoldGroupMemberus-gaap:DisposalGroupDisposedOfBySaleNotDiscontinuedOperationsMemberwre:A1776GStreetMember2019-12-192019-12-190000104894wre:TwoThousandNineteenPropertiesSoldGroupMember2019-12-310000104894wre:TwoThousandNineteenPropertiesSoldGroupMember2019-01-012019-12-31wre:propertywre:building0000104894srt:OfficeBuildingMemberwre:QuanticoCorporateCenterMember2019-06-260000104894srt:OfficeBuildingMemberwre:QuanticoCorporateCenterMember2019-06-262019-06-260000104894srt:OfficeBuildingMemberwre:QuanticoCorporateCenterMember2019-01-012019-03-31wre:agreement0000104894wre:ShoppingCenterPortfolioAndPowerCenterPortfolioMember2019-06-012019-06-30wre:buyer0000104894wre:ShoppingCenterPortfolioMember2019-07-232019-07-2300001048942019-07-012019-09-300000104894wre:FrederickCrossingAndFrederickCountySquareMember2019-08-212019-08-210000104894wre:CentreatHagerstownMember2019-08-272019-08-270000104894srt:OfficeBuildingMemberwre:JohnMarshallIiMemberus-gaap:DisposalGroupHeldforsaleNotDiscontinuedOperationsMember2019-12-310000104894srt:OfficeBuildingMemberwre:JohnMarshallIiMemberus-gaap:DisposalGroupHeldforsaleNotDiscontinuedOperationsMember2020-04-210000104894us-gaap:DiscontinuedOperationsHeldForSaleOrDisposedOfBySaleMemberwre:RetailPortfolioMember2019-04-012019-06-300000104894us-gaap:DiscontinuedOperationsHeldForSaleOrDisposedOfBySaleMemberwre:RetailPortfolioMember2019-01-012019-06-300000104894srt:MultifamilyMember2020-06-3000001048942019-01-01xbrli:pure0000104894us-gaap:MortgagesMemberwre:YaleWestMember2020-01-012020-01-310000104894us-gaap:RevolvingCreditFacilityMember2018-03-310000104894us-gaap:LoansPayableMemberwre:A2015TermLoanMember2018-03-310000104894wre:A2018TermLoanMemberus-gaap:LoansPayableMember2018-03-310000104894us-gaap:RevolvingCreditFacilityMember2018-01-012018-03-31wre:extension_option0000104894wre:CreditAgreementAmendedAndRestatedMember2018-03-310000104894us-gaap:LondonInterbankOfferedRateLIBORMemberus-gaap:RevolvingCreditFacilityMembersrt:MinimumMember2020-01-012020-06-300000104894us-gaap:LondonInterbankOfferedRateLIBORMembersrt:MaximumMemberus-gaap:RevolvingCreditFacilityMember2020-01-012020-06-300000104894us-gaap:RevolvingCreditFacilityMembersrt:MinimumMemberus-gaap:BaseRateMember2020-01-012020-06-300000104894srt:MaximumMemberus-gaap:RevolvingCreditFacilityMemberus-gaap:BaseRateMember2020-01-012020-06-300000104894us-gaap:RevolvingCreditFacilityMemberus-gaap:FederalFundsEffectiveSwapRateMember2020-01-012020-06-300000104894us-gaap:LondonInterbankOfferedRateLIBORMemberus-gaap:RevolvingCreditFacilityMember2020-01-012020-06-300000104894us-gaap:RevolvingCreditFacilityMembersrt:MinimumMember2020-01-012020-06-300000104894srt:MaximumMemberus-gaap:RevolvingCreditFacilityMember2020-01-012020-06-300000104894us-gaap:LondonInterbankOfferedRateLIBORMemberus-gaap:RevolvingCreditFacilityMember2020-06-302020-06-300000104894us-gaap:RevolvingCreditFacilityMember2020-06-302020-06-300000104894wre:A2018TermLoanAMemberus-gaap:LoansPayableMember2020-06-300000104894us-gaap:LondonInterbankOfferedRateLIBORMemberwre:A2018TermLoanMemberus-gaap:LoansPayableMembersrt:MinimumMember2020-01-012020-06-300000104894us-gaap:LondonInterbankOfferedRateLIBORMemberwre:A2018TermLoanMembersrt:MaximumMemberus-gaap:LoansPayableMember2020-01-012020-06-300000104894wre:A2018TermLoanMemberus-gaap:LoansPayableMembersrt:MinimumMemberus-gaap:BaseRateMember2020-01-012020-06-300000104894wre:A2018TermLoanMembersrt:MaximumMemberus-gaap:LoansPayableMemberus-gaap:BaseRateMember2020-01-012020-06-300000104894us-gaap:LoansPayableMemberwre:A2018TermLoanBMember2018-01-012018-03-310000104894wre:A2018TermLoanAMemberus-gaap:InterestRateSwapMember2018-03-310000104894us-gaap:InterestRateSwapMemberwre:A2018TermLoanBMember2018-03-310000104894wre:A2018TermLoanMemberus-gaap:InterestRateSwapMember2018-03-310000104894us-gaap:RevolvingCreditFacilityMember2020-06-300000104894us-gaap:RevolvingCreditFacilityMember2019-12-310000104894us-gaap:RevolvingCreditFacilityMember2020-01-012020-06-300000104894wre:May2020TermLoanMemberus-gaap:LoansPayableMember2020-05-052020-05-050000104894wre:May2020TermLoanMemberus-gaap:LoansPayableMember2020-05-050000104894us-gaap:LondonInterbankOfferedRateLIBORMemberwre:May2020TermLoanMemberus-gaap:LoansPayableMember2020-05-052020-05-050000104894us-gaap:LondonInterbankOfferedRateLIBORMemberwre:May2020TermLoanMembersrt:MinimumMemberus-gaap:LoansPayableMember2020-05-052020-05-05wre:arrangement0000104894us-gaap:InterestRateSwapMemberwre:A2015TermLoanMember2015-09-150000104894wre:A2015TermLoanMember2015-09-150000104894us-gaap:InterestRateSwapMemberwre:A2016TermLoanMember2016-07-220000104894wre:A2016TermLoanMember2016-07-220000104894wre:A2018TermLoanMember2018-03-290000104894wre:A2018TermLoanAMemberus-gaap:InterestRateSwapMember2018-03-290000104894us-gaap:InterestRateSwapMemberwre:A2018TermLoanBMember2018-03-290000104894wre:A2018TermLoanBMember2018-03-290000104894wre:A2018TermLoanMemberus-gaap:InterestRateSwapMember2018-03-290000104894wre:FutureDebtReplacementOfTenYearNotesAtFourPointNineFiveMemberus-gaap:InterestRateSwapMember2019-11-300000104894wre:A10YearUnsecuredNotes5053Member2019-11-300000104894wre:A10YearUnsecuredNotes5053Member2019-11-012019-11-300000104894wre:A10YearUnsecuredNotes5053Member2020-04-012020-04-300000104894us-gaap:InterestRateSwapMemberwre:A2015TermLoanMember2020-06-300000104894us-gaap:AccountsPayableAndAccruedLiabilitiesMemberus-gaap:InterestRateSwapMemberwre:A2015TermLoanMember2020-06-300000104894us-gaap:AccountsPayableAndAccruedLiabilitiesMemberus-gaap:InterestRateSwapMemberwre:A2015TermLoanMember2019-12-310000104894wre:A2018TermLoanAMemberus-gaap:InterestRateSwapMember2020-06-300000104894us-gaap:AccountsPayableAndAccruedLiabilitiesMemberwre:A2018TermLoanAMemberus-gaap:InterestRateSwapMember2020-06-300000104894wre:A2018TermLoanAMemberus-gaap:InterestRateSwapMemberus-gaap:PrepaidExpensesAndOtherCurrentAssetsMember2019-12-310000104894us-gaap:InterestRateSwapMemberwre:A2018TermLoanBMember2020-06-300000104894us-gaap:AccountsPayableAndAccruedLiabilitiesMemberus-gaap:InterestRateSwapMemberwre:A2018TermLoanBMember2020-06-300000104894us-gaap:AccountsPayableAndAccruedLiabilitiesMemberus-gaap:InterestRateSwapMemberwre:A2018TermLoanBMember2019-12-310000104894wre:FutureDebtReplacementOfTenYearNotesAtFourPointNineFiveMemberus-gaap:InterestRateSwapMember2020-06-300000104894wre:FutureDebtReplacementOfTenYearNotesAtFourPointNineFiveMemberus-gaap:AccountsPayableAndAccruedLiabilitiesMemberus-gaap:InterestRateSwapMember2020-06-300000104894wre:FutureDebtReplacementOfTenYearNotesAtFourPointNineFiveMemberus-gaap:InterestRateSwapMemberus-gaap:PrepaidExpensesAndOtherCurrentAssetsMember2019-12-310000104894us-gaap:InterestRateSwapMember2020-06-300000104894us-gaap:InterestRateSwapMember2019-12-310000104894us-gaap:InterestRateSwapMember2020-04-012020-06-300000104894us-gaap:InterestRateSwapMember2019-04-012019-06-300000104894us-gaap:InterestRateSwapMember2020-01-012020-06-300000104894us-gaap:InterestRateSwapMember2019-01-012019-06-300000104894us-gaap:FairValueMeasurementsRecurringMemberus-gaap:SupplementalEmployeeRetirementPlanDefinedBenefitMember2020-06-300000104894us-gaap:FairValueMeasurementsRecurringMemberus-gaap:FairValueInputsLevel1Memberus-gaap:SupplementalEmployeeRetirementPlanDefinedBenefitMember2020-06-300000104894us-gaap:FairValueMeasurementsRecurringMemberus-gaap:FairValueInputsLevel2Memberus-gaap:SupplementalEmployeeRetirementPlanDefinedBenefitMember2020-06-300000104894us-gaap:FairValueMeasurementsRecurringMemberus-gaap:FairValueInputsLevel3Memberus-gaap:SupplementalEmployeeRetirementPlanDefinedBenefitMember2020-06-300000104894us-gaap:FairValueMeasurementsRecurringMemberus-gaap:SupplementalEmployeeRetirementPlanDefinedBenefitMember2019-12-310000104894us-gaap:FairValueMeasurementsRecurringMemberus-gaap:FairValueInputsLevel1Memberus-gaap:SupplementalEmployeeRetirementPlanDefinedBenefitMember2019-12-310000104894us-gaap:FairValueMeasurementsRecurringMemberus-gaap:FairValueInputsLevel2Memberus-gaap:SupplementalEmployeeRetirementPlanDefinedBenefitMember2019-12-310000104894us-gaap:FairValueMeasurementsRecurringMemberus-gaap:FairValueInputsLevel3Memberus-gaap:SupplementalEmployeeRetirementPlanDefinedBenefitMember2019-12-310000104894us-gaap:FairValueMeasurementsRecurringMemberus-gaap:InterestRateSwapMember2020-06-300000104894us-gaap:FairValueMeasurementsRecurringMemberus-gaap:InterestRateSwapMemberus-gaap:FairValueInputsLevel1Member2020-06-300000104894us-gaap:FairValueMeasurementsRecurringMemberus-gaap:FairValueInputsLevel2Memberus-gaap:InterestRateSwapMember2020-06-300000104894us-gaap:FairValueMeasurementsRecurringMemberus-gaap:InterestRateSwapMemberus-gaap:FairValueInputsLevel3Member2020-06-300000104894us-gaap:FairValueMeasurementsRecurringMemberus-gaap:InterestRateSwapMember2019-12-310000104894us-gaap:FairValueMeasurementsRecurringMemberus-gaap:InterestRateSwapMemberus-gaap:FairValueInputsLevel1Member2019-12-310000104894us-gaap:FairValueMeasurementsRecurringMemberus-gaap:FairValueInputsLevel2Memberus-gaap:InterestRateSwapMember2019-12-310000104894us-gaap:FairValueMeasurementsRecurringMemberus-gaap:InterestRateSwapMemberus-gaap:FairValueInputsLevel3Member2019-12-310000104894us-gaap:CarryingReportedAmountFairValueDisclosureMember2020-06-300000104894us-gaap:EstimateOfFairValueFairValueDisclosureMember2020-06-300000104894us-gaap:CarryingReportedAmountFairValueDisclosureMember2019-12-310000104894us-gaap:EstimateOfFairValueFairValueDisclosureMember2019-12-310000104894wre:WashingtonRealEstateInvestmentTrust2016OmnibusIncentivePlanMember2020-06-300000104894wre:WashingtonRealEstateInvestmentTrust2016OmnibusIncentivePlanMember2020-01-012020-06-300000104894wre:OfficerLongTermIncentivePlanMember2020-06-300000104894srt:ChiefExecutiveOfficerMemberus-gaap:PerformanceSharesMemberwre:OfficerLongTermIncentivePlanMember2020-06-300000104894srt:ExecutiveVicePresidentMemberus-gaap:PerformanceSharesMemberwre:OfficerLongTermIncentivePlanMember2020-06-300000104894srt:VicePresidentMemberus-gaap:PerformanceSharesMemberwre:OfficerLongTermIncentivePlanMember2020-06-300000104894wre:TimeBasedSharesMemberwre:OfficerLongTermIncentivePlanMember2020-01-012020-06-300000104894us-gaap:PerformanceSharesMemberwre:OfficerLongTermIncentivePlanMember2020-06-300000104894wre:RestrictedShareAwardsMember2020-01-012020-06-300000104894wre:RestrictedShareAwardsMember2019-01-012019-06-300000104894wre:RestrictedShareAwardsMember2020-06-30wre:segment0000104894wre:OfficeMemberus-gaap:OperatingSegmentsMember2020-04-012020-06-300000104894us-gaap:OperatingSegmentsMemberwre:MultifamilySegmentMember2020-04-012020-06-300000104894us-gaap:CorporateAndOtherMember2020-04-012020-06-300000104894wre:OfficeMemberus-gaap:OperatingSegmentsMember2020-06-300000104894us-gaap:OperatingSegmentsMemberwre:MultifamilySegmentMember2020-06-300000104894us-gaap:CorporateAndOtherMember2020-06-300000104894wre:OfficeMemberus-gaap:OperatingSegmentsMember2019-04-012019-06-300000104894us-gaap:OperatingSegmentsMemberwre:MultifamilySegmentMember2019-04-012019-06-300000104894us-gaap:CorporateAndOtherMember2019-04-012019-06-300000104894wre:OfficeMemberus-gaap:OperatingSegmentsMember2019-06-300000104894us-gaap:OperatingSegmentsMemberwre:MultifamilySegmentMember2019-06-300000104894us-gaap:CorporateAndOtherMember2019-06-300000104894wre:OfficeMemberus-gaap:OperatingSegmentsMember2020-01-012020-06-300000104894us-gaap:OperatingSegmentsMemberwre:MultifamilySegmentMember2020-01-012020-06-300000104894us-gaap:CorporateAndOtherMember2020-01-012020-06-300000104894wre:OfficeMemberus-gaap:OperatingSegmentsMember2019-01-012019-06-300000104894us-gaap:OperatingSegmentsMemberwre:MultifamilySegmentMember2019-01-012019-06-300000104894us-gaap:CorporateAndOtherMember2019-01-012019-06-3000001048942018-05-040000104894us-gaap:CommonClassAMember2018-05-040000104894us-gaap:CommonClassAMember2020-01-012020-03-3100001048942020-01-012020-03-310000104894us-gaap:CommonClassAMember2020-04-012020-06-300000104894us-gaap:CommonClassAMember2019-01-012019-06-30
UNITED STATES
SECURITIES AND EXCHANGE COMMISSION
Washington, D.C. 20549
___________________________________________________
FORM 10-Q
___________________________________________________
| | | | | |
| ☒ | QUARTERLY REPORT PURSUANT TO SECTION 13 OR 15(d) OF THE SECURITIES EXCHANGE ACT OF 1934 |
For quarterly period ended June 30, 2020
OR
| | | | | |
| ☐ | TRANSITION REPORT PURSUANT TO SECTION 13 OR 15(d) OF THE SECURITIES EXCHANGE ACT OF 1934. |
COMMISSION FILE NO. 1-6622
| | |
WASHINGTON REAL ESTATE INVESTMENT TRUST |
| (Exact name of registrant as specified in its charter) |
| | | | | | | | |
| Maryland | | 53-0261100 |
| (State of incorporation) | | (IRS Employer Identification Number) |
1775 EYE STREET, NW, SUITE 1000, WASHINGTON, DC 20006
(Address of principal executive office) (Zip code)
Registrant’s telephone number, including area code: (202) 774-3200
___________________________________________________
Securities registered pursuant to Section 12(b) of the Act:
| | | | | | | | |
| Title of each class | Trading Symbol(s) | Name of each exchange on which registered |
| Shares of Beneficial Interest | WRE | NYSE |
___________________________________________________
Indicate by check mark whether the registrant (1) has filed all reports required to be filed by Section 13 or 15(d) of the Securities Exchange Act of 1934 during the preceding 12 months (or such shorter period that the registrant was required to file such reports) and (2) has been subject to such filing requirements for the past 90 days. Yes ☒ No ☐
Indicate by check mark whether the registrant has submitted electronically every Interactive Data File required to be submitted pursuant to Rule 405 of Regulation S-T (§232.405 of this chapter) during the preceding 12 months (or for such shorter period that the registrant was required to submit such files). Yes ☒ No ☐
Indicate by check mark whether the registrant is a large accelerated filer, an accelerated filer, a non-accelerated filer, smaller reporting company, or an emerging growth company. See definition of “large accelerated filer,” “accelerated filer,” “smaller reporting company,” and “emerging growth company” in Rule 12b-2 of the Exchange Act.
| | | | | | | | | | | |
| Large Accelerated Filer | ☒ | Accelerated Filer | ☐ |
| Non-accelerated Filer | ☐ | Smaller Reporting Company | ☐ |
| | Emerging Growth Company | ☐ |
If an emerging growth company, indicate by check mark if the registrant has elected not to use the extended transition period for complying with any new or revised financial accounting standards provided pursuant to Section 13(a) of the Exchange Act. ☐
Indicate by check mark whether the registrant is a shell company (as defined in Rule 12b-2 of the Act). Yes ☐ No ☒
As of July 27, 2020, 82,346,724 common shares were outstanding.
WASHINGTON REAL ESTATE INVESTMENT TRUST
INDEX
| | | | | | | | |
| | | Page |
| | |
| | |
| Item 1. | | |
| | |
| | |
| | |
| | |
| | |
| | |
| | |
| Item 2. | | |
| | |
| Item 3. | | |
| | |
| Item 4. | | |
| | |
| | |
| | |
| Item 1. | | |
| | |
| Item 1A. | | |
| | |
| Item 2. | | |
| | |
| Item 3. | | |
| | |
| Item 4. | | |
| | |
| Item 5. | | |
| | |
| Item 6. | | |
| | |
| | |
PART I
FINANCIAL INFORMATION
ITEM 1: FINANCIAL STATEMENTS
The information furnished in the accompanying unaudited Consolidated Balance Sheets, Condensed Consolidated Statements of Operations, Condensed Consolidated Statements of Comprehensive Loss, Consolidated Statements of Equity and Consolidated Statements of Cash Flows reflects all adjustments, consisting of normal recurring items, which are, in the opinion of management, necessary for a fair presentation of the financial position, results of operations and cash flows for the interim periods. The accompanying financial statements and notes thereto should be read in conjunction with the financial statements and notes for the three years ended December 31, 2019 included in Washington Real Estate Investment Trust’s 2019 Annual Report on Form 10-K, as amended by Amendment No. 1 to the Annual Report on Form 10-K, filed on March 6, 2020.
WASHINGTON REAL ESTATE INVESTMENT TRUST AND SUBSIDIARIES
CONSOLIDATED BALANCE SHEETS
(IN THOUSANDS, EXCEPT PER SHARE DATA)
| | | | | | | | | | | |
| June 30, 2020 | | December 31, 2019 |
| (Unaudited) | | |
| Assets | | | |
| Land | $ | 574,025 | | | $ | 566,807 | |
| Income producing property | 2,467,629 | | | 2,392,415 | |
| 3,041,654 | | | 2,959,222 | |
| Accumulated depreciation and amortization | (745,692) | | | (693,610) | |
| Net income producing property | 2,295,962 | | | 2,265,612 | |
| Properties under development or held for future development | 89,166 | | | 124,193 | |
| Total real estate held for investment, net | 2,385,128 | | | 2,389,805 | |
| Investment in real estate held for sale, net | — | | | 57,028 | |
| Cash and cash equivalents | 7,971 | | | 12,939 | |
| Restricted cash | 630 | | | 1,812 | |
| Rents and other receivables | 67,026 | | | 65,259 | |
| Prepaid expenses and other assets | 81,967 | | | 95,149 | |
| Other assets related to properties held for sale | — | | | 6,336 | |
| Total assets | $ | 2,542,722 | | | $ | 2,628,328 | |
| Liabilities | | | |
| Notes payable, net | $ | 897,060 | | | $ | 996,722 | |
| Mortgage notes payable, net | — | | | 47,074 | |
| Line of credit | 181,000 | | | 56,000 | |
| Accounts payable and other liabilities | 93,192 | | | 71,136 | |
| Dividend payable | 24,760 | | | 24,668 | |
| Advance rents | 7,375 | | | 9,353 | |
| Tenant security deposits | 10,769 | | | 10,595 | |
| Other liabilities related to properties held for sale | — | | | 718 | |
| Total liabilities | 1,214,156 | | | 1,216,266 | |
| Equity | | | |
| Shareholders’ equity | | | |
Preferred shares; $0.01 par value; 10,000 shares authorized; no shares issued or outstanding | — | | | — | |
Shares of beneficial interest, $0.01 par value; 100,000 shares authorized; 82,327 and 82,099 shares issued and outstanding, as of June 30, 2020 and December 31, 2019, respectively | 823 | | | 821 | |
| Additional paid in capital | 1,598,620 | | | 1,592,487 | |
| Distributions in excess of net income | (236,673) | | | (183,405) | |
| Accumulated other comprehensive (loss) income | (34,533) | | | 1,823 | |
| Total shareholders’ equity | 1,328,237 | | | 1,411,726 | |
| Noncontrolling interests in subsidiaries | 329 | | | 336 | |
| Total equity | 1,328,566 | | | 1,412,062 | |
| Total liabilities and equity | $ | 2,542,722 | | | $ | 2,628,328 | |
See accompanying notes to the consolidated financial statements.
WASHINGTON REAL ESTATE INVESTMENT TRUST AND SUBSIDIARIES
CONDENSED CONSOLIDATED STATEMENTS OF OPERATIONS
(IN THOUSANDS, EXCEPT PER SHARE DATA) (UNAUDITED)
| | | | | | | | | | | | | | | | | | | | | | | |
| | Three Months Ended June 30, | | | | Six Months Ended June 30, | | |
| | 2020 | | 2019 | | 2020 | | 2019 |
| Revenue | | | | | | | |
| Real estate rental revenue | $ | 72,870 | | | $ | 76,820 | | | $ | 149,662 | | | $ | 148,254 | |
| Expenses | | | | | | | |
| Real estate expenses | 26,885 | | | 28,134 | | | 55,524 | | | 54,277 | |
| Depreciation and amortization | 29,599 | | | 33,044 | | | 59,319 | | | 60,101 | |
| | | | | | | |
| General and administrative expenses | 5,296 | | | 5,535 | | | 11,633 | | | 13,342 | |
| | | | | | | |
| Real estate impairment | — | | | — | | | — | | | 8,374 | |
| | | | | | | |
| 61,780 | | | 66,713 | | | 126,476 | | | 136,094 | |
| Loss on sale of real estate | (7,539) | | | (1,046) | | | (7,539) | | | (1,046) | |
| Real estate operating income | 3,551 | | | 9,061 | | | 15,647 | | | 11,114 | |
| Other expense | | | | | | | |
| Interest expense | (8,751) | | | (15,252) | | | (19,596) | | | (27,748) | |
| (Loss) gain on extinguishment of debt | (206) | | | — | | | 262 | | | — | |
| | | | | | | |
| | | | | | | |
| (8,957) | | | (15,252) | | | (19,334) | | | (27,748) | |
| Loss from continuing operations | (5,406) | | | (6,191) | | | (3,687) | | | (16,634) | |
| Discontinued operations: | | | | | | | |
| Income from operations of properties sold or held for sale | — | | | 7,178 | | | — | | | 13,216 | |
| | | | | | | |
| | | | | | | |
| | | | | | | |
| Income from discontinued operations | — | | | 7,178 | | | — | | | 13,216 | |
| Net (loss) income | (5,406) | | | 987 | | | (3,687) | | | (3,418) | |
| Less: Net income attributable to noncontrolling interests in subsidiaries | — | | | — | | | — | | | — | |
| Net (loss) income attributable to the controlling interests | $ | (5,406) | | | $ | 987 | | | $ | (3,687) | | | $ | (3,418) | |
| | | | | | | |
| Basic net (loss) income attributable to the controlling interests per share: | | | | | | | |
| Continuing operations | $ | (0.07) | | | $ | (0.08) | | | $ | (0.05) | | | $ | (0.21) | |
| Discontinued operations | — | | | 0.09 | | | — | | | 0.17 | |
Net (loss) income attributable to the controlling interests per share (1) | $ | (0.07) | | | $ | 0.01 | | | $ | (0.05) | | | $ | (0.05) | |
| | | | | | | |
| Diluted net (loss) income attributable to the controlling interests per share: | | | | | | | |
| Continuing operations | $ | (0.07) | | | $ | (0.08) | | | $ | (0.05) | | | $ | (0.21) | |
| Discontinued operations | — | | | 0.09 | | | — | | | 0.17 | |
Net (loss) income attributable to the controlling interests per share (1) | $ | (0.07) | | | $ | 0.01 | | | $ | (0.05) | | | $ | (0.05) | |
| Weighted average shares outstanding – basic | 82,153 | | | 79,934 | | | 82,120 | | | 79,908 | |
| Weighted average shares outstanding – diluted | 82,153 | | | 79,934 | | | 82,120 | | | 79,908 | |
| Dividends declared per share | $ | 0.30 | | | $ | 0.30 | | | $ | 0.60 | | | $ | 0.60 | |
______________________________
(1) Earnings per share may not sum due to rounding
See accompanying notes to the consolidated financial statements.
WASHINGTON REAL ESTATE INVESTMENT TRUST AND SUBSIDIARIES
CONDENSED CONSOLIDATED STATEMENTS OF COMPREHENSIVE LOSS
(IN THOUSANDS)
(UNAUDITED)
| | | | | | | | | | | | | | | | | | | | | | | |
| | Three Months Ended June 30, | | | | Six Months Ended June 30, | | |
| | 2020 | | 2019 | | 2020 | | 2019 |
| Net (loss) income | $ | (5,406) | | | $ | 987 | | | $ | (3,687) | | | $ | (3,418) | |
| Other comprehensive loss: | | | | | | | |
| Unrealized loss on interest rate hedges | (1,789) | | | (6,942) | | | (36,356) | | | (11,111) | |
| Comprehensive loss | (7,195) | | | (5,955) | | | (40,043) | | | (14,529) | |
| Less: Comprehensive income attributable to noncontrolling interests | — | | | — | | | — | | | — | |
| Comprehensive loss attributable to the controlling interests | $ | (7,195) | | | $ | (5,955) | | | $ | (40,043) | | | $ | (14,529) | |
See accompanying notes to the consolidated financial statements.
WASHINGTON REAL ESTATE INVESTMENT TRUST AND SUBSIDIARIES
CONSOLIDATED STATEMENTS OF EQUITY
(IN THOUSANDS)
(UNAUDITED)
| | | | | | | | | | | | | | | | | | | | | | | | | | | | | | | | | | | | | | | | | | | | | | | |
| Shares Issued and Out-standing | | Shares of Beneficial Interest at Par Value | | Additional Paid in Capital | | Distributions in Excess of
Net Income | | Accumulated Other Comprehensive Income (Loss) | | Total Shareholders’ Equity | | Noncontrolling Interests in Subsidiaries | | Total Equity |
| Balance, December 31, 2019 | 82,099 | | | $ | 821 | | | $ | 1,592,487 | | | $ | (183,405) | | | $ | 1,823 | | | $ | 1,411,726 | | | $ | 336 | | | $ | 1,412,062 | |
| | | | | | | | | | | | | | | |
| Net loss attributable to the controlling interests | — | | | — | | | — | | | (3,687) | | | — | | | (3,687) | | | — | | | (3,687) | |
| | | | | | | | | | | | | | | |
| Unrealized loss on interest rate hedges | — | | | — | | | — | | | — | | | (36,356) | | | (36,356) | | | — | | | (36,356) | |
| Distributions to noncontrolling interests | — | | | — | | | — | | | — | | | — | | | — | | | (7) | | | (7) | |
| | | | | | | | | | | | | | | |
| Dividends | — | | | — | | | — | | | (49,581) | | | — | | | (49,581) | | | — | | | (49,581) | |
| Equity issuances, net of issuance costs | 46 | | | 1 | | | 1,241 | | | — | | | — | | | 1,242 | | | — | | | 1,242 | |
| Shares issued under Dividend Reinvestment Program | 41 | | | — | | | 1,065 | | | — | | | — | | | 1,065 | | | — | | | 1,065 | |
| Share grants, net of forfeitures and tax withholdings | 141 | | | 1 | | | 3,827 | | | — | | | — | | | 3,828 | | | — | | | 3,828 | |
| Balance, June 30, 2020 | 82,327 | | | $ | 823 | | | $ | 1,598,620 | | | $ | (236,673) | | | $ | (34,533) | | | $ | 1,328,237 | | | $ | 329 | | | $ | 1,328,566 | |
| | | | | | | | | | | | | | | | | | | | | | | | | | | | | | | | | | | | | | | | | | | | | | | |
| Shares Issued and Out-standing | | Shares of Beneficial Interest at Par Value | | Additional Paid in Capital | | Distributions in Excess of
Net Income | | Accumulated Other Comprehensive Income (Loss) | | Total Shareholders’ Equity | | Noncontrolling Interests in Subsidiaries | | Total Equity |
| Balance, December 31, 2018 | 79,910 | | | $ | 799 | | | $ | 1,526,574 | | | $ | (469,085) | | | $ | 9,839 | | | $ | 1,068,127 | | | $ | 351 | | | $ | 1,068,478 | |
| Cumulative effect of change in accounting principle | — | | | — | | | — | | | (906) | | | — | | | (906) | | | — | | | (906) | |
| Net loss attributable to the controlling interests | — | | | — | | | — | | | (3,418) | | | — | | | (3,418) | | | — | | | (3,418) | |
| Unrealized loss on interest rate hedges | — | | | — | | | — | | | — | | | (11,111) | | | (11,111) | | | — | | | (11,111) | |
| Distributions to noncontrolling interests | — | | | — | | | — | | | — | | | — | | | — | | | (8) | | | (8) | |
| Dividends | — | | | — | | | — | | | (48,252) | | | — | | | (48,252) | | | — | | | (48,252) | |
| Shares issued under Dividend Reinvestment Program | 64 | | | 1 | | | 1,672 | | | — | | | — | | | 1,673 | | | — | | | 1,673 | |
| Share grants, net of forfeitures and tax withholdings | 108 | | | 1 | | | 4,251 | | | — | | | — | | | 4,252 | | | — | | | 4,252 | |
| Balance, June 30, 2019 | 80,082 | | | $ | 801 | | | $ | 1,532,497 | | | $ | (521,661) | | | $ | (1,272) | | | $ | 1,010,365 | | | $ | 343 | | | $ | 1,010,708 | |
See accompanying notes to the consolidated financial statements.
WASHINGTON REAL ESTATE INVESTMENT TRUST AND SUBSIDIARIES
CONSOLIDATED STATEMENTS OF EQUITY
(IN THOUSANDS)
(UNAUDITED)
| | | | | | | | | | | | | | | | | | | | | | | | | | | | | | | | | | | | | | | | | | | | | | | |
| Shares Issued and Out-standing | | Shares of Beneficial Interest at Par Value | | Additional Paid in Capital | | Distributions in Excess of
Net Income | | Accumulated Other Comprehensive Loss | | Total Shareholders’ Equity | | Noncontrolling Interests in Subsidiaries | | Total Equity |
| Balance, March 31, 2020 | 82,315 | | | $ | 823 | | | $ | 1,596,242 | | | $ | (206,506) | | | $ | (32,744) | | | $ | 1,357,815 | | | $ | 333 | | | $ | 1,358,148 | |
| | | | | | | | | | | | | | | |
| Net loss attributable to the controlling interests | — | | | — | | | — | | | (5,406) | | | — | | | (5,406) | | | — | | | (5,406) | |
| | | | | | | | | | | | | | | |
| Unrealized loss on interest rate hedges | — | | | — | | | — | | | — | | | (1,789) | | | (1,789) | | | — | | | (1,789) | |
| Distributions to noncontrolling interests | — | | | — | | | — | | | — | | | — | | | — | | | (4) | | | (4) | |
| | | | | | | | | | | | | | | |
| Dividends | — | | | — | | | — | | | (24,761) | | | — | | | (24,761) | | | — | | | (24,761) | |
| | | | | | | | | | | | | | | |
| Shares issued under Dividend Reinvestment Program | 6 | | | — | | | 144 | | | — | | | — | | | 144 | | | — | | | 144 | |
| Share grants, net of forfeitures and tax withholdings | 6 | | | — | | | 2,234 | | | — | | | — | | | 2,234 | | | — | | | 2,234 | |
| Balance, June 30, 2020 | 82,327 | | | $ | 823 | | | $ | 1,598,620 | | | $ | (236,673) | | | $ | (34,533) | | | $ | 1,328,237 | | | $ | 329 | | | $ | 1,328,566 | |
| | | | | | | | | | | | | | | | | | | | | | | | | | | | | | | | | | | | | | | | | | | | | | | |
| Shares Issued and Out-standing | | Shares of Beneficial Interest at Par Value | | Additional Paid in Capital | | Distributions in Excess of
Net Income | | Accumulated Other Comprehensive Income (Loss) | | Total Shareholders’ Equity | | Noncontrolling Interests in Subsidiaries | | Total Equity |
| Balance, March 31, 2019 | 80,029 | | | $ | 800 | | | $ | 1,529,916 | | | $ | (498,537) | | | $ | 5,670 | | | $ | 1,037,849 | | | $ | 347 | | | $ | 1,038,196 | |
| Net income attributable to the controlling interests | — | | | — | | | — | | | 987 | | | — | | | 987 | | | — | | | 987 | |
| Unrealized loss on interest rate hedges | — | | | — | | | — | | | — | | | (6,942) | | | (6,942) | | | — | | | (6,942) | |
| Distributions to noncontrolling interests | — | | | — | | | — | | | — | | | — | | | — | | | (4) | | | (4) | |
| Dividends | — | | | — | | | — | | | (24,111) | | | — | | | (24,111) | | | — | | | (24,111) | |
| Shares issued under Dividend Reinvestment Program | 21 | | | 1 | | | 575 | | | — | | | — | | | 576 | | | — | | | 576 | |
| Share grants, net of forfeitures and tax withholdings | 32 | | | — | | | 2,006 | | | — | | | — | | | 2,006 | | | — | | | 2,006 | |
| Balance, June 30, 2019 | 80,082 | | | $ | 801 | | | $ | 1,532,497 | | | $ | (521,661) | | | $ | (1,272) | | | $ | 1,010,365 | | | $ | 343 | | | $ | 1,010,708 | |
See accompanying notes to the consolidated financial statements.
| | | | | | | | | | | |
| WASHINGTON REAL ESTATE INVESTMENT TRUST AND SUBSIDIARIES | | | |
| | | |
| CONSOLIDATED STATEMENTS OF CASH FLOWS | | | |
| (IN THOUSANDS) | | | |
| (UNAUDITED) | | | |
| | | |
| Six Months Ended June 30, | | |
| 2020 | | 2019 |
| Cash flows from operating activities | | | |
| Net loss | $ | (3,687) | | | $ | (3,418) | |
| Adjustments to reconcile net income to net cash provided by operating activities: | | | |
| Depreciation and amortization | 59,319 | | | 64,968 | |
| Credit losses (gains) on lease related receivables | 2,271 | | | (133) | |
| | | |
| Real estate impairment | — | | | 8,374 | |
| Loss on sale of real estate | 7,539 | | | 1,046 | |
| Share-based compensation expense | 3,783 | | | 4,527 | |
| | | |
| Amortization of debt premiums, discounts and related financing costs | 1,314 | | | 1,404 | |
| Gain on extinguishment of debt | (262) | | | — | |
| Changes in operating other assets | (4,482) | | | (5,781) | |
| Changes in operating other liabilities | (14,613) | | | (10,444) | |
| Net cash provided by operating activities | 51,182 | | | 60,543 | |
| Cash flows from investing activities | | | |
| Real estate acquisitions, net | — | | | (458,604) | |
| Net cash received for sale of real estate | 56,353 | | | 31,334 | |
| | | |
| Capital improvements to real estate | (25,452) | | | (18,634) | |
| Development in progress | (18,646) | | | (19,445) | |
| Real estate deposits, net | — | | | (1,744) | |
| | | |
| Non-real estate capital improvements | (124) | | | (121) | |
| Net cash provided by (used in) investing activities | 12,131 | | | (467,214) | |
| Cash flows from financing activities | | | |
| Line of credit borrowings, net | 125,000 | | | 30,000 | |
| Dividends paid | (49,485) | | | (72,274) | |
| Principal payments – mortgage notes payable | (46,567) | | | (1,231) | |
| | | |
| Repayments of unsecured notes payable | (250,000) | | | — | |
| Proceeds from term loan | 150,000 | | | 450,000 | |
| Payment of financing costs | (560) | | | (1,219) | |
| Distributions to noncontrolling interests | (7) | | | (8) | |
| Proceeds from dividend reinvestment program | 1,065 | | | 1,673 | |
| | | |
| Payment of tax withholdings for restricted share awards | (150) | | | (504) | |
| Net proceeds from exercise of share options | 1,241 | | | — | |
| Net cash (used in) provided by financing activities | (69,463) | | | 406,437 | |
| Net decrease in cash, cash equivalents and restricted cash | (6,150) | | | (234) | |
| Cash, cash equivalents and restricted cash at beginning of period | 14,751 | | | 7,640 | |
| Cash, cash equivalents and restricted cash at end of period | $ | 8,601 | | | $ | 7,406 | |
| | | |
| | | | | | | | | | | |
| WASHINGTON REAL ESTATE INVESTMENT TRUST AND SUBSIDIARIES | | | |
| | | |
| CONSOLIDATED STATEMENTS OF CASH FLOWS | | | |
| (IN THOUSANDS) | | | |
| (UNAUDITED) | | | |
| | | |
| Six Months Ended June 30, | | |
| 2020 | | 2019 |
| Supplemental disclosure of cash flow information: | | | |
| Cash paid for interest, net of amounts capitalized | $ | 21,380 | | | $ | 26,418 | |
| Change in accrued capital improvements and development costs | 3,687 | | | (5,277) | |
| | | |
| | | |
| | | |
| Reconciliation of cash, cash equivalents and restricted cash: | | | |
| Cash and cash equivalents | $ | 7,971 | | | $ | 5,756 | |
| Restricted cash | 630 | | | 1,650 | |
| Cash, cash equivalents and restricted cash | $ | 8,601 | | | $ | 7,406 | |
See accompanying notes to the consolidated financial statements.
WASHINGTON REAL ESTATE INVESTMENT TRUST AND SUBSIDIARIES
NOTES TO CONSOLIDATED FINANCIAL STATEMENTS
June 30, 2020
(UNAUDITED)
NOTE 1: NATURE OF BUSINESS
Washington Real Estate Investment Trust (“WashREIT”), a Maryland real estate investment trust, is a self-administered equity real estate investment trust, successor to a trust organized in 1960. Our business consists of the ownership and operation of income producing real estate properties in the greater Washington metro region. We own a portfolio of multifamily and commercial (office and retail) properties.
Federal Income Taxes
We believe that we qualify as a real estate investment trust (“REIT”) under Sections 856-860 of the Internal Revenue Code of 1986, as amended (the "Code"), and intend to continue to qualify as such. To maintain our status as a REIT, we are, among other things, required to distribute 90% of our REIT taxable income (which is, generally, our ordinary taxable income, with certain modifications), excluding any net capital gains and any deductions for dividends paid to our shareholders on an annual basis. When selling a property, we generally have the option of (a) reinvesting the sales proceeds of property sold, in a way that allows us to defer recognition of some or all taxable gain realized on the sale, (b) distributing gains to the shareholders with no tax to us or (c) treating net long-term capital gains as having been distributed to our shareholders, paying the tax on the gain deemed distributed and allocating the tax paid as a credit to our shareholders.
Generally, and subject to our ongoing qualification as a REIT, no provisions for income taxes are necessary except for taxes on undistributed taxable income and taxes on the income generated by our taxable REIT subsidiaries (“TRSs”). Our TRSs are subject to corporate federal and state income tax on their taxable income at regular statutory rates, or as calculated under the alternative minimum tax, as appropriate. As of both June 30, 2020 and December 31, 2019, our TRSs had a deferred tax asset of $1.4 million that was fully reserved. As of both June 30, 2020 and December 31, 2019, we had deferred state and local tax liabilities of $0.6 million. These deferred tax liabilities are recorded in Accounts payable and other liabilities on our consolidated balance sheets and are primarily related to temporary differences in the timing of the recognition of revenue, depreciation and amortization.
NOTE 2: SUMMARY OF SIGNIFICANT ACCOUNTING POLICIES AND BASIS OF PRESENTATIONS
Significant Accounting Policies
We have prepared our consolidated financial statements using the accounting policies described in our Annual Report on Form 10-K for the year ended December 31, 2019, as amended by Amendment No. 1 to the Annual Report on Form 10-K, filed on March 6, 2020.
Pronouncements Adopted
| | | | | | | | |
| Standard/Description | Effective Date and Adoption Considerations | Effect on Financial Statements or Other significant Matters |
ASU 2016-13, Measurement of Credit Losses on Financial Instruments. This standard requires financial assets measured on an amortized cost basis, including trade receivables, to be presented at the net amount expected to be collected. | We adopted the new standard as of January 1, 2020. | The adoption of the new standard did not have a material effect on our consolidated financial statements.
|
ASU 2018-15, Intangibles - Goodwill and Other - Internal-Use Software. This standard requires a customer in a cloud computing arrangement that is a service contract to follow the internal-use software guidance to determine which implementation costs to capitalize as assets. | We adopted the new standard as of January 1, 2020. | The adoption of the new standard did not have a material effect on our consolidated financial statements.
|
| | | | | | | | |
| Standard/Description | Effective Date and Adoption Considerations | Effect on Financial Statements or Other significant Matters |
ASU 2020-04, Reference Rate Reform - Facilitation of the Effects of Reference Rate Reform on Financial Reporting. This standard contains optional practical expedients and exceptions for applying Generally Accepted Accounting Principles (“GAAP”) to contracts, hedging relations, and other transactions affected by reference rate reform if certain criteria are met. | We elected certain optional practical expedients as of January 1, 2020. | The guidance in ASU 2020-04 is optional and may be elected over time as reference rate reform activities occur. As of January 1, 2020, we have elected to apply the hedge accounting expedients related to probability and the assessments of effectiveness for future LIBOR-indexed cash flows to assume that the index upon which future hedged transactions will be based matches the index on the corresponding derivatives. Application of these expedients preserves the presentation of derivatives consistent with past presentation. We continue to evaluate the impact of the guidance and may apply other elections as applicable as additional changes in the market occur. |
| | |
COVID-19 Lease Modification Accounting Relief
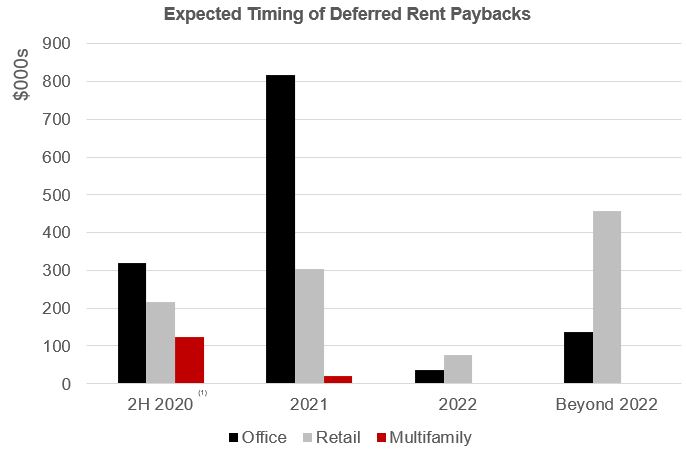
In April 2020, the Financial Accounting Standards Board (“FASB”) staff issued a question-and-answer document (“Q&A”) that addresses their belief that the guidance on lease modifications in GAAP does not contemplate concessions being executed as rapidly as they were executed as a result of the major financial crisis arising from the COVID-19 pandemic. Under ASC 842, Leases, we evaluate, on a lease by lease basis, if a lease concession is the result of a new arrangement reached with the tenant, which could result in lease modification accounting, or if a lease concession is contemplated in the existing lease agreement, which is precluded from lease modification accounting. In the Q&A, the staff stated that entities may elect to not evaluate whether a concession provided by a lessor to a lessee in response to the COVID-19 pandemic is a lease modification. This election must be applied consistently to leases with similar characteristics and circumstances. The election permits entities, if certain criteria are met, to account for concessions as if they were contemplated in the existing contract (and accounted for as a negative variable rental revenue) or evaluate the lease concessions for lease modification accounting. We have elected to utilize the relief provided by the FASB staff. This election did not have a material impact on our consolidated financial statements as of June 30, 2020, and we do not expect material impacts in future periods.
Principles of Consolidation and Basis of Presentation
The accompanying unaudited consolidated financial statements include the consolidated accounts of WashREIT, our majority-owned subsidiaries and entities in which WashREIT has a controlling interest. All intercompany balances and transactions have been eliminated in consolidation.
We have prepared the accompanying unaudited financial statements pursuant to the rules and regulations of the Securities and Exchange Commission (“SEC”). Certain information and note disclosures normally included in annual financial statements prepared in accordance with GAAP have been condensed or omitted pursuant to those rules and regulations, although we believe that the disclosures made are adequate to make the information presented not misleading. In addition, in the opinion of management, all adjustments (consisting of normal recurring accruals) considered necessary for a fair presentation of the results for the periods presented have been included. These unaudited financial statements should be read in conjunction with the financial statements and notes included in our Annual Report on Form 10-K for the year ended December 31, 2019, as amended by Amendment No. 1 to the Annual Report on Form 10-K, filed on March 6, 2020.
Within these notes to the financial statements, we refer to the three months ended June 30, 2020 and June 30, 2019 as the “2020 Quarter” and the “2019 Quarter,” respectively, and the six months ended June 30, 2020 and June 30, 2019 as the “2020 Period” and the “2019 Period,” respectively.
Discontinued Operations
We classify properties as held for sale when they meet the necessary criteria, which include: (a) senior management commits to a plan to sell the assets, (b) the assets are available for immediate sale in their present condition subject only to terms that are usual and customary for sales of such assets, (c) an active program to locate a buyer and other actions required to complete the plan to sell the assets have been initiated, (d) the sale of the assets is probable, and transfer of the assets is expected to qualify for recognition as a completed sale, within one year, (e) the assets are being actively marketed for sale at a price that is reasonable in relation to its current fair value and (f) actions required to complete the plan indicate that it is unlikely that significant changes to the plan will be made or that the plan will be withdrawn. Depreciation on these properties is discontinued at the time they are classified as held for sale, but operating revenues, operating expenses and interest expense continue to be recognized until the date of sale.
Revenues and expenses of properties that are either sold or classified as held for sale are presented as discontinued operations for all periods presented in the consolidated statements of operations if the dispositions represent a strategic shift that has (or will have) a major effect on our operations and financial results. Interest on debt that can be identified as specifically attributed to these properties is included in discontinued operations. If the dispositions do not represent a strategic shift that has (or will have) a major effect on our operations and financial results, then the revenues and expenses of the properties that are classified as sold or held for sale are presented as continuing operations in the consolidated statements of operations for all periods presented.
Restricted Cash
Restricted cash includes funds escrowed for tenant security deposits, real estate tax, insurance and mortgage escrows and escrow deposits required by lenders on certain of our properties to be used for future building renovations or tenant improvements.
Use of Estimates in the Financial Statements
The preparation of financial statements in conformity with GAAP requires management to make certain estimates and assumptions that affect the reported amounts of assets and liabilities and disclosure of contingent assets and liabilities at the date of the financial statements and the reported amounts of revenues and expenses during the reporting period. Actual results could differ from those estimates.
NOTE 3: REAL ESTATE
Acquisitions
We acquired the following properties (collectively, the “Assembly Portfolio”) during the 2019 Period:
| | | | | | | | | | | | | | | | | | | | | | | | | | | | | |
| Acquisition Date | | Property Name | | Property Type | | | # of Units (unaudited) | | Contract Purchase Price (in thousands) |
| April 30, 2019 | | Assembly Portfolio - Virginia (1) | | Multifamily | | | 1,685 | | $ | 379,100 | |
| June 27, 2019 | | Assembly Portfolio - Maryland (2) | | Multifamily | | | 428 | | 82,070 | |
| | | | Total 2019 | | | 2,113 | | $ | 461,170 | |
______________________________
(1) Consists of Assembly Alexandria, Assembly Manassas, Assembly Dulles, Assembly Leesburg and Assembly Herndon.
(2) Consists of Assembly Germantown and Assembly Watkins Mill.
Development/Redevelopment
We have properties under development/redevelopment and held for current or future development. As of June 30, 2020, we have invested $126.5 million, including the cost of acquired land, in The Trove, a 401-unit multifamily development adjacent to The Wellington. During the 2020 Period, we substantially completed major construction activities for The Trove’s base building and garage and delivered 131 units. As of June 30, 2020, we have placed into service assets totaling $67.1 million. We have also invested $27.8 million, including the cost of acquired land, in a multifamily development adjacent to Riverside Apartments. In addition, in our multifamily and office segments, we continue to capitalize qualifying costs on several other projects with minor development activity necessary to get each project ready for its intended use.
Properties Sold and Held for Sale
We intend to hold our properties for investment with a view to long-term appreciation, to engage in the business of acquiring, developing and owning our properties, and to make occasional sales of properties that no longer meet our long-term strategy or return objectives and where market conditions for sale are favorable. The proceeds from the sales may be reinvested into other properties, used to fund development operations or to support other corporate needs, or distributed to our shareholders.
We sold our interests in the following properties during 2020 and 2019:
| | | | | | | | | | | | | | | | | | | | | | | | | | | | | | | | |
| Disposition Date | | Property Name | | Property Type | | Rentable Square Feet | | Contract Sales Price
(in thousands) | | (Loss) Gain on Sale
(in thousands) |
| April 21, 2020 | | John Marshall II | | Office | | 223,000 | | $ | 57,000 | | | $ | (6,855) | |
| | | | Total 2020 | | 223,000 | | $ | 57,000 | | | $ | (6,855) | |
| | | | | | | | | | |
| June 26, 2019 | | Quantico Corporate Center (1) | | Office | | 272,000 | | $ | 33,000 | | | $ | (1,046) | |
| July 23, 2019 | | Shopping Center Portfolio (2) | | Retail | | 800,000 | | 485,250 | | | 333,023 | |
| August 21, 2019 | | Frederick Crossing and Frederick County Square | | Retail | | 520,000 | | 57,500 | | | 9,507 | |
| August 27, 2019 | | Centre at Hagerstown | | Retail | | 330,000 | | 23,500 | | | (3,506) | |
| December 19, 2019 | | 1776 G Street | | Office | | 262,000 | | 129,500 | | | 61,007 | |
| | | | Total 2019 | | 2,184,000 | | $ | 728,750 | | | $ | 398,985 | |
______________________________
(1) Consists of 925 and 1000 Corporate Drive.
(2) Consists of five retail properties: Gateway Overlook, Wheaton Park, Olney Village Center, Bradlee Shopping Center and Shoppes of Foxchase.
During the second quarter of 2019, we sold Quantico Corporate Center, an office property in Stafford, Virginia, consisting of two office buildings totaling 272,000 square feet, for a contract sale price of $33.0 million, recognizing a loss on sale of real estate of $1.0 million. Prior to the sale, due to the negotiations to sell the property, we evaluated Quantico Corporate Center for impairment and recognized an $8.4 million impairment charge during the first quarter of 2019 in order to reduce the carrying value of the property to its estimated fair value.
In June 2019, we entered into two separate purchase and sale agreements with two separate buyers to sell the Shopping Center Portfolio (Gateway Overlook, Wheaton Park, Olney Village Center, Bradlee Shopping Center and Shoppes of Foxchase) and the Power Center Portfolio (Frederick Crossing, Frederick County Square and Centre at Hagerstown). As of June 30, 2019, the properties in the Retail Portfolio (as defined below) met the criteria for classification as held for sale.
We closed on the Shopping Center Portfolio sale transaction on July 23, 2019, recognizing a gain on sale of real estate of $333.0 million. Prior to closing on the disposition of the Shopping Center Portfolio, we prepaid the mortgage note secured by Olney Village Center, incurring a loss on extinguishment of debt of approximately $0.8 million, which we recognized in the third quarter of 2019.
In the third quarter of 2019, the purchase and sale agreement to sell the Power Center Portfolio was amended to include only Frederick Crossing and Frederick County Square. We closed on the sale of these assets on August 21, 2019, recognizing a gain on sale of real estate of $9.5 million. Following the amendment to the purchase and sale agreement to sell the Power Center Portfolio, we marketed Centre at Hagerstown for sale and identified a separate buyer. We closed on the sale of this asset on August 27, 2019, recognizing a loss on sale of real estate of $3.5 million.
References to the “Retail Portfolio” include the Shopping Center Portfolio, Frederick Crossing, Frederick County Square and Centre at Hagerstown. The disposition of the Retail Portfolio represented a strategic shift that had a major effect on our financial results and we accordingly reported the Retail Portfolio as discontinued operations. The Retail Portfolio represented a majority of our retail assets and following its sale, we determined that our retail line of business was no longer a reportable segment.
In October 2019, we renewed and extended our lease with the World Bank at 1776 G Street NW, an office property in Washington, DC, through December 31, 2025. In December 2019, we sold the property to the World Bank for a contract sale price of $129.5 million, recognizing a gain on sale of real estate of $61.0 million.
In December 2019, we executed a purchase and sale agreement to sell John Marshall II for a contract sale price of $63.4 million. Upon execution of the purchase and sale agreement, the property met the criteria for classification as held for sale. During the 2020 Quarter, we executed an amendment to the purchase and sale agreement which decreased the contract sale price to $57.0 million and closed on the sale on April 21, 2020, recognizing a loss on sale of real estate of $6.9 million.
As of June 30, 2020, we assessed certain properties for impairment and did not recognize any impairment charges during the 2020 Quarter. We applied reasonable estimates and judgments in evaluating each of the properties as of June 30, 2020. Should external or internal circumstances change requiring the need to shorten holding periods or adjust future estimated cash flows from our properties, we could be required to record impairment charges in the future.
Discontinued Operations
The results of the Retail Portfolio are classified as discontinued operations and are summarized as follows (amounts in thousands, except for share data):
| | | | | | | | | | | | | | | |
| | | Three Months Ended June 30, 2019 | | | | Six Months Ended June 30, 2019 |
| | | | | | | |
| Real estate rental revenue | | | $ | 12,334 | | | | | $ | 24,074 | |
| Real estate expenses | | | (2,641) | | | | | (5,708) | |
| Depreciation and amortization | | | (2,377) | | | | | (4,867) | |
| Interest expense | | | (138) | | | | | (283) | |
| | | | | | | |
| | | | | | | |
| Income from discontinued operations | | | $ | 7,178 | | | | | $ | 13,216 | |
| | | | | | | |
| Basic net income per share | | | $ | 0.09 | | | | | $ | 0.17 | |
| Diluted net income per share | | | $ | 0.09 | | | | | $ | 0.17 | |
| | | | | | | |
| Capital expenditures | | | $ | 402 | | | | | $ | 809 | |
NOTE 4: LEASE ACCOUNTING
Leasing as a Lessor
Future Minimum Rental Income
As of June 30, 2020, non-cancelable commercial operating leases provide for future minimum rental income from continuing operations as follows (in thousands). Apartment leases are not included as the terms are generally for one year or less.
| | | | | | | | |
| 2020 | | $ | 73,934 | |
| 2021 | | 132,724 | |
| 2022 | | 119,905 | |
| 2023 | | 102,671 | |
| 2024 | | 89,518 | |
| Thereafter | | 313,669 | |
| | $ | 832,421 | |
Leasing as a Lessee
2000 M Street, an office property in Washington, DC, is subject to an operating ground lease with a remaining term of 51 years. Rental payments under this lease are subject to percentage rent variable payments, which are not included as part of our measurement of straight-line rental expense. We recognized straight-line rental expense of $0.1 million during each of the 2020 Quarter and 2019 Quarter and $0.1 million for each of the 2020 Period and 2019 Period, respectively. We recognized variable rental payments of $0.2 million during each of the 2020 Quarter and 2019 Quarter and $0.4 million and $0.5 million during each of the 2020 Period and 2019 Period, respectively.
We recognized a right of use asset (included in Income producing property) and lease liability (included in Accounts payable and other liabilities) of $4.2 million. We used a discount rate of approximately 5.9%, which was derived from our assessment of securitized rates for similar assets and credit quality. We recognized $0.1 million of right-of-use and lease liability amortization during each of the 2020 Quarter and 2019 Quarter and $0.1 million for each of the 2020 Period and 2019 Period, respectively.
The following table sets forth the undiscounted cash flows of our scheduled obligations for future minimum payments on our operating ground lease as of June 30, 2020 and a reconciliation of those cash flows to the operating lease liability as of June 30, 2020 (in thousands):
| | | | | | | | |
| 2020 | | $ | 130 | |
| 2021 | | 260 | |
| 2022 | | 260 | |
| 2023 | | 260 | |
| 2024 | | 260 | |
| | |
| Thereafter | | 11,895 | |
| | 13,065 | |
| Imputed interest | | (9,216) | |
| Lease liability | | $ | 3,849 | |
NOTE 5: MORTGAGE NOTES PAYABLE
In January 2020, we prepaid the $45.6 million mortgage note secured by Yale West, which was scheduled to mature in 2052. As a result of the transaction, we recognized a gain on extinguishment of debt of $0.5 million related to the write-off of an unamortized mortgage premium of $1.4 million, partially offset by a prepayment penalty of $0.9 million.
NOTE 6: UNSECURED LINE OF CREDIT PAYABLE
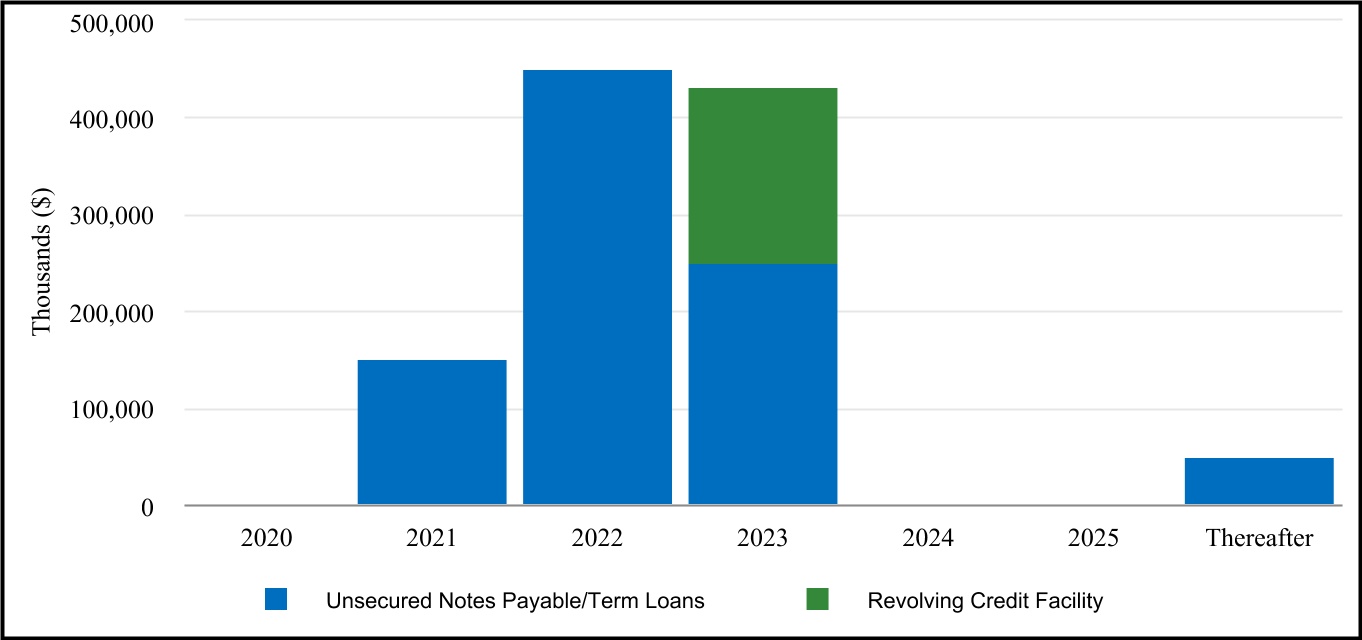
During the first quarter of 2018, we entered into an amended and restated credit agreement (“Credit Agreement”) which provides for a $700.0 million unsecured revolving credit facility (“Revolving Credit Facility”), the continuation of an existing $150.0 million unsecured term loan (“2015 Term Loan”) and an additional $250.0 million unsecured term loan (“2018 Term Loan”). The Revolving Credit Facility has a four-year term ending in March 2022, with two six-month extension options. The Credit Agreement has an accordion feature that allows us to increase the aggregate facility to $1.5 billion, subject to the lenders’ agreement to provide additional revolving loan commitments or term loans.
The Revolving Credit Facility bears interest at a rate of either one month LIBOR plus a margin ranging from 0.775% to 1.55% or the base rate plus a margin ranging from 0.0% to 0.55% (in each case depending upon WashREIT’s credit rating). The base rate is the highest of the administrative agent’s prime rate, the federal funds rate plus 0.50% and the LIBOR market index rate plus 1.0%. In addition, the Revolving Credit Facility requires the payment of a facility fee ranging from 0.10% to 0.30% (depending on WashREIT’s credit rating) on the $700.0 million committed revolving loan capacity, without regard to usage. As of June 30, 2020, the interest rate on the Revolving Credit Facility is one month LIBOR plus 1.00%, the one month LIBOR is 0.16% and the facility fee is 0.20%.
All outstanding advances for the Revolving Credit Facility are due and payable upon maturity in March 2022, unless extended pursuant to one or both of the two six-month extension options. Interest only payments are due and payable generally on a monthly basis.
The 2018 Term Loan increases and replaces the $150.0 million unsecured term loan, initially entered into on July 22, 2016 (“2016 Term Loan”), that was scheduled to mature in July 2023. The 2018 Term Loan is scheduled to mature in July 2023 and bears interest at a rate of either one month LIBOR plus a margin ranging from 0.85% to 1.75% or the base rate plus a margin ranging from 0.0% to 0.75% (in each case depending upon WashREIT’s credit rating). We used the $100.0 million of additional proceeds from the 2018 Term Loan primarily to repay outstanding borrowings on the Revolving Credit Facility.
We had previously used interest rate derivatives to effectively fix the interest rate of the 2016 Term Loan. These interest rate derivatives now effectively fix the interest rate on a $150.0 million portion of the 2018 Term Loan at 2.31%. In March 2018, we entered into interest rate derivatives that commenced on June 29, 2018 to effectively fix the interest rate on the remaining $100.0 million of the 2018 Term Loan at 3.71%. The 2018 Term Loan has an all-in fixed interest rate of 2.87%.
The amount of the Revolving Credit Facility’s unsecured line of credit unused and available at June 30, 2020 is as follows (in thousands):
| | | | | |
| Committed capacity | $ | 700,000 | |
| Borrowings outstanding | (181,000) | |
| |
| Unused and available | $ | 519,000 | |
We executed borrowings and repayments on the Revolving Credit Facility during the 2020 Period as follows (in thousands):
| | | | | |
| Balance, December 31, 2019 | $ | 56,000 | |
| Borrowings | 365,000 | |
| Repayments | (240,000) | |
| Balance, June 30, 2020 | $ | 181,000 | |
NOTE 7: NOTES PAYABLE
On May 5, 2020, we entered into a one-year, $150.0 million unsecured term loan facility (“2020 Term Loan”), maturing on May 5, 2021 with a one-year extension option. The 2020 Term Loan bears interest at LIBOR + 1.50%, which margin is subject to change based on our credit ratings, with a 0.50% floor for the LIBOR rate. We used the proceeds to repay borrowings under our Revolving Credit Facility.
NOTE 8: DERIVATIVE INSTRUMENTS
On September 15, 2015, we entered into two interest rate swap arrangements with a total notional amount of $150.0 million to swap the floating interest rate under the $150.0 million 2015 Term Loan to an all-in fixed interest rate of 2.72% starting on October 15, 2015 and extending until the maturity of the 2015 Term Loan on March 15, 2021.
On July 22, 2016, we entered into two forward interest rate swap arrangements with a total notional amount of $150.0 million to swap the floating interest rate under the $150.0 million 2016 Term Loan to an all-in fixed interest rate of 2.86% starting on March 31, 2017 and extending until the maturity of the 2016 Term Loan on July 21, 2023.
On March 29, 2018, we entered into the $250.0 million 2018 Term Loan maturing on July 21, 2023, which increased and replaced the 2016 Term Loan. The interest rate swap arrangements that had effectively fixed the 2016 Term Loan now effectively fix the interest rate on a $150.0 million portion of the 2018 Term Loan at 2.31%. On March 29, 2018, we entered into four interest rate swap arrangements with a total notional amount of $100.0 million to effectively fix the interest rate on the remaining $100.0 million of the 2018 Term Loan at 3.71%, that commenced on June 29, 2018 and extending until the maturity of the 2018 Term Loan on July 21, 2023. The $250.0 million 2018 Term Loan has an all-in fixed interest rate of 2.87%.
In November 2019, we entered into four interest rate swap arrangements with a total notional amount of $200.0 million to reduce our exposure to adverse fluctuations in interest rates on future fixed-rate debt (the “hedged debt transaction”) to replace our $250.0 million of 4.95% 10-year unsecured notes that were scheduled to mature in October 2020. In April 2020, we used borrowings from our Revolving Credit Facility to prepay the $250.0 million of 4.95% 10-year unsecured notes (“2020 Senior Notes”) without penalty. We still intend to execute fixed-rate debt in 2020 and have determined that the hedged debt transaction remains probable as of June 30, 2020.
The interest rate swaps qualify as cash flow hedges and are recorded at fair value in accordance with GAAP, based on discounted cash flow methodologies and observable inputs. We record the total change in fair value of the interest rate swap arrangements associated with our cash flow hedges in other comprehensive loss. The resulting unrealized loss on interest rate hedges was the only activity in other comprehensive loss during the periods presented in our consolidated financial statements. We assess the effectiveness of our cash flow hedges both at inception and on an ongoing basis. The cash flow hedges were highly effective for all periods presented.
The fair values of the interest rate swaps as of June 30, 2020 and December 31, 2019, are as follows (in thousands):
| | | | | | | | | | | | | | | | | | | | |
| | | | Fair Value | | |
| | | | Derivative Assets (Liabilities) | | |
| Derivative Instrument | Aggregate Notional Amount | Effective Date | Maturity Date | June 30, 2020 | | December 31, 2019 |
| Interest rate swaps | $ | 150,000 | | October 15, 2015 | March 15, 2021 | $ | (1,553) | | | $ | (62) | |
| Interest rate swaps | 150,000 | | March 31, 2017 | July 21, 2023 | (4,874) | | | 1,825 | |
| Interest rate swaps | 100,000 | | June 29, 2018 | July 21, 2023 | (7,504) | | | (3,664) | |
| Interest rate swaps | 200,000 | | April 1, 2020 | April 1, 2030 | (20,602) | | | 3,724 | |
| $ | 600,000 | | | | $ | (34,533) | | | $ | 1,823 | |
We record interest rate swaps on our consolidated balance sheets within Prepaid expenses and other assets when in a net asset position and within Accounts payable and other liabilities when in a net liability position. The interest rate swaps have been effective since inception. The net unrealized gains or losses on the effective swaps are recognized in other comprehensive loss, as follows (in thousands):
| | | | | | | | | | | | | | | | | | | | | | | |
| Three Months Ended June 30, | | | | Six Months Ended June 30, | | |
| 2020 | | 2019 | | 2020 | | 2019 |
| Unrealized loss on interest rate hedges | $ | (1,789) | | | $ | (6,942) | | | $ | (36,356) | | | $ | (11,111) | |
Amounts reported in accumulated other comprehensive (loss) income related to derivatives will be reclassified to interest expense as interest payments are made on our variable-rate debt. During the next twelve months, we estimate that an additional $7.0 million will be reclassified as an increase to interest expense.
We have agreements with each of our derivative counterparties that contain a provision whereby we could be declared in default on our derivative obligations if repayment of the underlying indebtedness is accelerated by the lender due to our default on the indebtedness. As of June 30, 2020, we did not have any derivatives in an asset position and the fair value of the derivative liabilities, including accrued interest, was $34.5 million. As of June 30, 2020, we have not posted any collateral related to these agreements.
Derivative instruments expose us to credit risk in the event of non-performance by the counterparty under the terms of the interest rate hedge agreements. We believe that we minimize our credit risk on these transactions by dealing with major, creditworthy financial institutions. We monitor the credit ratings of counterparties and our exposure to any single entity, thus minimizing our credit risk concentration.
NOTE 9: FAIR VALUE DISCLOSURES
Assets and Liabilities Measured at Fair Value
For assets and liabilities measured at fair value on a recurring basis, quantitative disclosures about the fair value measurements are required to be disclosed separately for each major category of assets and liabilities, as follows:
Level 1: Quoted prices in active markets for identical assets
Level 2: Significant other observable inputs
Level 3: Significant unobservable inputs
The only assets or liabilities we had at June 30, 2020 and December 31, 2019 that are recorded at fair value on a recurring basis are the assets held in the Supplemental Executive Retirement Plan (“SERP”), which primarily consist of investments in mutual funds, and the interest rate swaps (see note 8).
We base the valuations related to the SERP on assumptions derived from significant other observable inputs and accordingly these valuations fall into Level 2 in the fair value hierarchy.
The valuation of the interest rate swaps is determined using widely accepted valuation techniques, including discounted cash flow analysis on the expected cash flows of each interest rate swap. This analysis reflects the contractual terms of the interest rate swaps, including the period to maturity, and uses observable market-based inputs, including interest rate curves and implied
volatilities. The fair values of interest rate swaps are determined using the market standard methodology of netting the discounted future fixed cash payments (or receipts) and the discounted expected variable cash receipts (or payments). The variable cash payments (or receipts) are based on an expectation of future interest rates (forward curves) derived from observable market interest rate curves. To comply with the provisions of ASC 820, Fair Value Measurement, we incorporate credit valuation adjustments in the fair value measurements to appropriately reflect both our own nonperformance risk and the respective counterparty’s nonperformance risk. These credit valuation adjustments were concluded to not be significant inputs for the fair value calculations for the periods presented. In adjusting the fair value of our derivative contracts for the effect of nonperformance risk, we have considered the impact of netting and any applicable credit enhancements, such as the posting of collateral, thresholds, mutual puts and guarantees. The valuation of interest rate swaps fall into Level 2 in the fair value hierarchy.
The fair values of these assets and liabilities at June 30, 2020 and December 31, 2019 were as follows (in thousands):
| | | | | | | | | | | | | | | | | | | | | | | | | | | | | | | | | | | | | | | | | | | | | | | |
| | June 30, 2020 | | | | | | | | December 31, 2019 | | | | | | |
| | Fair
Value | | Level 1 | | Level 2 | | Level 3 | | Fair
Value | | Level 1 | | Level 2 | | Level 3 |
| Assets: | | | | | | | | | | | | | | | |
| SERP | $ | 1,913 | | | $ | — | | | $ | 1,913 | | | $ | — | | | $ | 1,792 | | | $ | — | | | $ | 1,792 | | | $ | — | |
| Interest rate swaps | — | | | — | | | — | | | — | | | 5,549 | | | — | | | 5,549 | | | — | |
| Liabilities: | | | | | | | | | | | | | | | |
| Interest rate swaps | $ | (34,533) | | | $ | — | | | $ | (34,533) | | | $ | — | | | $ | (3,726) | | | $ | — | | | $ | (3,726) | | | $ | — | |
Financial Assets and Liabilities Not Measured at Fair Value
The following disclosures of estimated fair value were determined by management using available market information and established valuation methodologies, including discounted cash flow models. Many of these estimates involve significant judgment. The estimated fair value disclosed may not necessarily be indicative of the amounts we could realize on disposition of the financial instruments. The use of different market assumptions or estimation methodologies could have an effect on the estimated fair value amounts. In addition, fair value estimates are made at a point in time and thus, estimates of fair value subsequent to June 30, 2020 may differ significantly from the amounts presented. The valuations of cash and cash equivalents and restricted cash fall into Level 1 in the fair value hierarchy and the valuations of debt instruments fall into Level 3 in the fair value hierarchy.
As of June 30, 2020 and December 31, 2019, the carrying values and estimated fair values of our financial instruments were as follows (in thousands):
| | | | | | | | | | | | | | | | | | | | | | | |
| | June 30, 2020 | | | | December 31, 2019 | | |
| Carrying Value | | Fair Value | | Carrying Value | | Fair Value |
| Cash and cash equivalents | $ | 7,971 | | | $ | 7,971 | | | $ | 12,939 | | | $ | 12,939 | |
| Restricted cash | 630 | | | 630 | | | 1,812 | | | 1,812 | |
| Mortgage notes payable, net | — | | | — | | | 47,074 | | | 47,899 | |
| Line of credit | 181,000 | | | 181,000 | | | 56,000 | | | 56,000 | |
| Notes payable, net | 897,060 | | | 919,929 | | | 996,722 | | | 1,022,937 | |
NOTE 10: STOCK BASED COMPENSATION
WashREIT maintains short-term (“STIP”) and long-term (“LTIP”) incentive plans that allow for stock based awards to officers and non-officer employees. Stock based awards are provided to officers and non-officer employees, as well as trustees, under the Washington Real Estate Investment Trust 2016 Omnibus Incentive Plan which allows for awards in the form of restricted shares, restricted share units, options and other awards up to an aggregate of 2,400,000 shares over the ten-year period in which the plan will be in effect. Restricted share units are converted into shares of our stock upon full vesting through the issuance of new shares.
On February 14, 2020, the board of trustees adopted an Amended and Restated Executive Officer Short-Term Incentive Plan (the “Officer STIP”) and an Amended and Restated Executive Officer Long-Term Incentive Plan (the “Officer LTIP”). Upon adoption by the board of trustees, both plans became effective for the performance periods beginning January 1, 2020.
Officer LTIP
Under the Officer LTIP, as revised, all named executive officers will have the opportunity to receive awards based on (i) the achievement of performance measures, which will be established for each performance period, and (ii) continued employment with the Company. The aggregate weighting for the performance measures and the time-based measures, as determined by the Compensation Committee, will total 100%. The performance measures will consist of one or more shareholder return measures and one or more strategic measures. The awards earned under the Officer LTIP, if any, are payable in our common shares of beneficial interest. Each participant’s total award under the Officer LTIP with respect to a performance period will be stated as a percentage of the participant’s annual base salary determined as of the beginning of that performance period. The percentage will depend upon the participant’s position and the degree of achievement of threshold, target, and high performance goals for the performance period which, except as otherwise determined by the Compensation Committee, will be as set forth in the table below:
| | | | | | | | | | | |
| Threshold | Target | High |
| President and Chief Executive Officer | 198% | 275% | 440% |
| Executive Vice President | 143% | 200% | 295% |
| Senior Vice President | 100% | 143% | 207% |
Any time-based awards under the Officer LTIP will be subject to a three-year vesting schedule, with any award vesting in one-third increments on December 15 of each year of the applicable performance period if the participant remains employed by the Company on each of such dates. The Officer LTIP provides that following a performance period, 100% of any performance-based award will vest immediately upon grant.
Each year, the Compensation Committee will establish the threshold, target and high performance goals for each performance measures. Upon or following completion of a performance period, the degree of achievement of each performance measure will be determined by the Compensation Committee in its discretion.
If a Change in Control (as defined in the Officer LTIP) occurs during a performance period while the participant is employed, the Officer LTIP provides that all time-based awards which are unvested will become vested, and the participant will receive a pro-rated portion of the shareholder return measure-based awards and the strategic measure-based awards will be calculated at target.
Total Compensation Expense
Total compensation expense recognized in the consolidated financial statements for all outstanding share based awards was $2.0 million and $1.7 million for the 2020 Quarter and 2019 Quarter, respectively, and $3.8 million and $4.5 million for the 2020 Period and 2019 Period, respectively.
Restricted Share Awards
The total fair values of restricted share awards vested was $0.8 million and $1.7 million for the 2020 Period and 2019 Period, respectively.
The total unvested restricted share awards at June 30, 2020 was 502,500 shares, which had a weighted average grant date fair value of $29.99 per share. As of June 30, 2020, the total compensation cost related to unvested restricted share awards was $10.3 million, which we expect to recognize over a weighted average period of 25 months.
NOTE 11: EARNINGS PER COMMON SHARE
We determine “Basic earnings per share” using the two-class method as our unvested restricted share awards and units have non-forfeitable rights to dividends, and are therefore considered participating securities. We compute basic earnings per share by dividing net income attributable to the controlling interest less the allocation of undistributed earnings to unvested restricted share awards and units by the weighted-average number of common shares outstanding for the period.
We also determine “Diluted earnings per share” as the more dilutive of the two-class method or the treasury stock method with respect to the unvested restricted share awards. We further evaluate any other potentially dilutive securities at the end of the period and adjust the basic earnings per share calculation for the impact of those securities that are dilutive. Our dilutive earnings per share calculation includes the dilutive impact of operating partnership units under the if-converted method and our
share based awards with performance conditions prior to the grant date and all market condition awards under the contingently issuable method.
The computations of basic and diluted earnings per share for the three and six months ended June 30, 2020 and 2019 were as follows (in thousands, except per share data):
| | | | | | | | | | | | | | | | | | | | | | | |
| | Three Months Ended June 30, | | | | Six Months Ended June 30, 2019 | | |
| | 2020 | | 2019 | | 2020 | | 2019 |
| Numerator: | | | | | | | |
| Loss from continuing operations | $ | (5,406) | | | $ | (6,191) | | | $ | (3,687) | | | $ | (16,634) | |
| | | | | | | |
| Allocation of earnings to unvested restricted share awards to continuing operations | (151) | | | (133) | | | (302) | | | (267) | |
| Adjusted loss from continuing operations attributable to the controlling interests | (5,557) | | | (6,324) | | | (3,989) | | | (16,901) | |
| Adjusted income from discontinued operations | — | | | 7,178 | | | — | | | 13,216 | |
| | | | | | | |
| | | | | | | |
| Adjusted net (loss) income attributable to the controlling interests | $ | (5,557) | | | $ | 854 | | | $ | (3,989) | | | $ | (3,685) | |
| Denominator: | | | | | | | |
| Weighted average shares outstanding – basic | 82,153 | | | 79,934 | | | 82,120 | | | 79,908 | |
| Effect of dilutive securities: | | | | | | | |
| Employee restricted share awards | — | | | — | | | — | | | — | |
| Operating partnership units | — | | | — | | | — | | | — | |
| Weighted average shares outstanding – diluted | 82,153 | | | 79,934 | | | 82,120 | | | 79,908 | |
| Earnings per common share, basic: | | | | | | | |
| Continuing operations | $ | (0.07) | | | $ | (0.08) | | | $ | (0.05) | | | $ | (0.21) | |
| Discontinued operations | — | | | 0.09 | | | — | | | 0.17 | |
Basic net (loss) income attributable to the controlling interests per common share (1) | $ | (0.07) | | | $ | 0.01 | | | $ | (0.05) | | | $ | (0.05) | |
| Earnings per common share, diluted: | | | | | | | |
| Continuing operations | $ | (0.07) | | | $ | (0.08) | | | $ | (0.05) | | | $ | (0.21) | |
| Discontinued operations | — | | | 0.09 | | | — | | | 0.17 | |
Diluted net (loss) income attributable to the controlling interests per common share (1) | $ | (0.07) | | | $ | 0.01 | | | $ | (0.05) | | | $ | (0.05) | |
| | | | | | | |
| Dividends declared per common share | $ | 0.30 | | | $ | 0.30 | | | $ | 0.60 | | | $ | 0.60 | |
______________________________
(1) Earnings per share may not sum due to rounding.
NOTE 12: SEGMENT INFORMATION
We evaluate real estate performance and allocate resources by property type and have two reportable segments: office and multifamily. Office properties provide office space for various types of businesses and professions. Multifamily properties provide rental housing for individuals and families throughout the Washington metro region. We have eight retail properties that do not meet the qualitative or quantitative criteria for a reportable segment and are classified as “Corporate and other” in our segment disclosure tables.
We evaluate performance based upon net operating income from the combined properties in each segment. Our reportable operating segments are consolidations of similar properties. GAAP requires that segment disclosures present the measure(s) used by the chief operating decision maker for purposes of assessing each segment’s performance. Net operating income is a key measurement of our segment profit and loss and is defined as real estate rental revenue less real estate expenses.
The following tables present revenues, net operating income, capital expenditures and total assets for the three and six months ended June 30, 2020 and 2019 from these segments, and reconcile net operating income of reportable segments to net (loss) income attributable to the controlling interests as reported (in thousands):
| | | | | | | | | | | | | | | | | | | | | | | | | |
| | Three Months Ended June 30, 2020 | | | | | | | | |
| | Office | | | | Multifamily | | Corporate and Other | | Consolidated |
| Real estate rental revenue | $ | 32,914 | | | | | $ | 36,038 | | | $ | 3,918 | | | $ | 72,870 | |
| Real estate expenses | 11,517 | | | | | 14,110 | | | 1,258 | | | 26,885 | |
| Net operating income | $ | 21,397 | | | | | $ | 21,928 | | | $ | 2,660 | | | $ | 45,985 | |
| Depreciation and amortization | | | | | | | | | (29,599) | |
| General and administrative expenses | | | | | | | | | (5,296) | |
| | | | | | | | | |
| | | | | | | | | |
| Interest expense | | | | | | | | | (8,751) | |
| | | | | | | | | |
| Loss on sale of real estate | | | | | | | | | (7,539) | |
| | | | | | | | | |
| | | | | | | | | |
| | | | | | | | | |
| Loss on extinguishment of debt | | | | | | | | | (206) | |
| | | | | | | | | |
| | | | | | | | | |
| | | | | | | | | |
| | | | | | | | | |
| Net loss | | | | | | | | | (5,406) | |
| Less: Net income attributable to noncontrolling interests in subsidiaries | | | | | | | | | — | |
| Net loss attributable to the controlling interests | | | | | | | | | $ | (5,406) | |
| Capital expenditures | $ | 7,831 | | | | | $ | 5,488 | | | $ | 1,287 | | | $ | 14,606 | |
| Total assets | $ | 1,063,283 | | | | | $ | 1,337,731 | | | $ | 141,708 | | | $ | 2,542,722 | |
| | | | | | | | | | | | | | | | | | | | | | | | | |
| | Three Months Ended June 30, 2019 | | | | | | | | |
| | Office | | | | Multifamily | | Corporate and Other (1) | | Consolidated |
| Real estate rental revenue | $ | 42,061 | | | | | $ | 29,887 | | | $ | 4,872 | | | $ | 76,820 | |
| Real estate expenses | 15,565 | | | | | 11,226 | | | 1,343 | | | 28,134 | |
| Net operating income | $ | 26,496 | | | | | $ | 18,661 | | | $ | 3,529 | | | $ | 48,686 | |
| Depreciation and amortization | | | | | | | | | (33,044) | |
| | | | | | | | | |
| General and administrative expenses | | | | | | | | | (5,535) | |
| | | | | | | | | |
| Interest expense | | | | | | | | | (15,252) | |
| | | | | | | | | |
| Loss on sale of real estate | | | | | | | | | (1,046) | |
| | | | | | | | | |
| | | | | | | | | |
| | | | | | | | | |
| | | | | | | | | |
| | | | | | | | | |
| | | | | | | | | |
| Income from operations of properties sold or held for sale | | | | | | | | | 7,178 | |
| | | | | | | | | |
| Net income | | | | | | | | | 987 | |
| Less: Net income attributable to noncontrolling interests in subsidiaries | | | | | | | | | — | |
| Net income attributable to the controlling interests | | | | | | | | | $ | 987 | |
| Capital expenditures | $ | 5,385 | | | | | $ | 5,296 | | | $ | 726 | | | $ | 11,407 | |
| Total assets | $ | 1,196,703 | | | | | $ | 1,260,847 | | | $ | 360,547 | | | $ | 2,818,097 | |
______________________________
(1) Total assets and capital expenditures include all retail properties, including those classified as discontinued operations.
| | | | | | | | | | | | | | | | | | | | | | | | | |
| Six Months Ended June 30, 2020 | | | | | | | | |
| Office | | | | Multifamily | | Corporate and Other | | Consolidated |
| Real estate rental revenue | $ | 68,584 | | | | | $ | 72,616 | | | $ | 8,462 | | | $ | 149,662 | |
| Real estate expenses | 24,834 | | | | | 28,095 | | | 2,595 | | | 55,524 | |
| Net operating income | $ | 43,750 | | | | | $ | 44,521 | | | $ | 5,867 | | | $ | 94,138 | |
| Depreciation and amortization | | | | | | | | | (59,319) | |
| | | | | | | | | |
| General and administrative | | | | | | | | | (11,633) | |
| | | | | | | | | |
| Interest expense | | | | | | | | | (19,596) | |
| | | | | | | | | |
| | | | | | | | | |
| Loss on sale of real estate | | | | | | | | | (7,539) | |
| | | | | | | | | |
| Gain on extinguishment of debt | | | | | | | | | 262 | |
| | | | | | | | | |
| | | | | | | | | |
| | | | | | | | | |
| | | | | | | | | |
| | | | | | | | | |
| | | | | | | | | |
| Net loss | | | | | | | | | (3,687) | |
| Less: Net income attributable to noncontrolling interests in subsidiaries | | | | | | | | | — | |
| Net loss attributable to the controlling interests | | | | | | | | | $ | (3,687) | |
| Capital expenditures | $ | 14,919 | | | | | $ | 8,957 | | | $ | 1,700 | | | $ | 25,576 | |
| | | | | | | | | | | | | | | | | | | | | | | | | |
| Six Months Ended June 30, 2019 | | | | | | | | |
| Office | | | | Multifamily | | Corporate and Other (1) | | Consolidated |
| Real estate rental revenue | $ | 84,354 | | | | | $ | 54,222 | | | $ | 9,678 | | | $ | 148,254 | |
| Real estate expenses | 30,789 | | | | | 20,696 | | | 2,792 | | | 54,277 | |
| Net operating income | $ | 53,565 | | | | | $ | 33,526 | | | $ | 6,886 | | | $ | 93,977 | |
| Depreciation and amortization | | | | | | | | | (60,101) | |
| | | | | | | | | |
| General and administrative | | | | | | | | | (13,342) | |
| Interest expense | | | | | | | | | (27,748) | |
| | | | | | | | | |
| Loss on sale of real estate | | | | | | | | | (1,046) | |
| Real estate impairment | | | | | | | | | (8,374) | |
| | | | | | | | | |
| | | | | | | | | |
| | | | | | | | | |
| Discontinued operations: | | | | | | | | | |
| | | | | | | | | |
| Income from operations of properties sold or held for sale | | | | | | | | | 13,216 | |
| | | | | | | | | |
| Net loss | | | | | | | | | (3,418) | |
| Less: Net income attributable to noncontrolling interests in subsidiaries | | | | | | | | | — | |
| Net loss attributable to the controlling interests | | | | | | | | | $ | (3,418) | |
| Capital expenditures | $ | 10,308 | | | | | $ | 7,099 | | | $ | 1,348 | | | $ | 18,755 | |
______________________________
(1) Total assets and capital expenditures include all retail properties, including those classified as discontinued operations.
NOTE 13: SHAREHOLDERS' EQUITY
On May 4, 2018, we entered into eight separate equity distribution agreements (collectively, the “Equity Distribution Agreements”) with Wells Fargo Securities, LLC, BNY Mellon Capital Markets, LLC, Capital One Securities, Inc., Citigroup Global Markets Inc., Goldman Sachs & Co. LLC, J.P. Morgan Securities LLC, KeyBanc Capital Markets Inc. and SunTrust Robinson Humphrey, Inc. relating to the issuance of up to $250.0 million of our common shares from time to time. Issuances of our common shares are made at market prices prevailing at the time of issuance. We may use net proceeds from the issuance of common shares under this program for general corporate purposes, including, without limitation, working capital, the acquisition, renovation, expansion, improvement, development or redevelopment of income producing properties or the repayment of debt. During the first quarter of 2020, we issued 46,500 shares under this program at a weighted average price of $31.07 for net proceeds of $1.2 million. We did not issue common shares under the Equity Distribution Agreements during the 2020 Quarter or 2019 Period.
We have a dividend reinvestment program, whereby shareholders may use their dividends and optional cash payments to purchase common shares. The common shares sold under this program may either be common shares issued by us or common shares purchased in the open market. Net proceeds under this program were used for general corporate purposes.
Our issuances and net proceeds on the dividend reinvestment program for the three and six months ended June 30, 2020 and 2019 are as follows:
| | | | | | | | | | | | | | | | | | | | | | | |
| Three Months Ended June 30, | | | | Six Months Ended June 30, | | |
| 2020 | | 2019 | | 2020 | | 2019 |
| Issuance of common shares | 6 | | | 21 | | | 41 | | | 64 | |
| Weighted average price per share | $ | 22.68 | | | $ | 26.97 | | | $ | 26.38 | | | $ | 26.23 | |
| Net proceeds | $ | 144 | | | $ | 576 | | | $ | 1,065 | | | $ | 1,673 | |
ITEM 2: MANAGEMENT’S DISCUSSION AND ANALYSIS OF FINANCIAL CONDITION AND RESULTS OF OPERATIONS
The following discussion should be read in conjunction with our consolidated financial statements and the notes thereto appearing in Item 1 of this report and the more detailed information contained in our Annual Report on Form 10-K for the year ended December 31, 2019 filed with the Securities and Exchange Commission (“SEC”) on February 19, 2020, as amended by Amendment No. 1 to the Annual Report on Form 10-K filed on March 6, 2020.
We refer to the three months ended June 30, 2020 and June 30, 2019 as the “2020 Quarter” and the “2019 Quarter,” respectively, and the six months ended June 30, 2020 and June 30, 2019 as the “2020 Period” and the “2019 Period”, respectively.
Forward-Looking Statements
This Form 10-Q contains forward-looking statements which involve risks and uncertainties. Forward-looking statements relate to expectations, beliefs, projections, future plans and strategies, anticipated events or trends and similar expressions concerning matters that are not historical facts. In some cases, you can identify forward looking statements by the use of forward-looking terminology such as “may,” “will,” “should,” “expects,” “intends,” “plans,” “anticipates,” “believes,” “estimates,” “predicts,” or “potential” or the negative of these words and phrases or similar words or phrases which are predictions of or indicate future events or trends and which do not relate solely to historical matters. Such statements involve known and unknown risks, uncertainties, and other factors which may cause the actual results, performance, or achievements of WashREIT to be materially different from future results, performance or achievements expressed or implied by such forward-looking statements. Currently, one of the most significant factors is the adverse effect of the COVID-19 virus and ensuing economic turmoil on the financial condition, results of operations, cash flows and performance of WashREIT, particularly the impact of our ability to collect rent on schedule or at all and the percentage of rent collected, our ability to lease or re-lease our commercial spaces, and increased credit losses, on the performance of our tenants generally, and on the global economy and financial markets. The extent to which COVID-19 impacts WashREIT and its tenants will depend on future developments, which are highly uncertain and cannot be predicted with confidence, including the scope, severity and duration of the pandemic, the actions taken to contain the pandemic or mitigate its impact, and the direct and indirect economic effects of the pandemic and containment measures, among others. Moreover, investors are cautioned to interpret many of the risks identified in the risk factors discussed in this 10-Q and our Annual Report on Form 10-K for the year ended December 31, 2019, as amended by Amendment No. 1 to the Annual Report on Form 10-K, filed on March 6, 2020, as well as the risks set forth below, as being heightened as a result of the ongoing and numerous adverse impacts of COVID-19. Additional factors which may cause the actual results, performance, or achievements of WashREIT to be materially different from future results, performance or achievements expressed or implied by such forward-looking statements include, but are not limited to the risks associated with the ownership of real estate in general and our real estate assets in particular; the economic health of the greater Washington metro region; the risk of failure to enter into/and or complete contemplated acquisitions and dispositions at all, within the price ranges anticipated and on the terms and timing anticipated; changes in the composition of our portfolio; fluctuations in interest rates; reductions in or actual or threatened changes to the timing of federal government spending; the risks related to use of third-party providers and joint venture partners; the ability to control our operating expenses; the economic health of our tenants; the supply of competing properties; shifts away from brick and mortar stores to e-commerce; the availability and terms of financing and capital and the general volatility of securities markets; compliance with applicable laws, including those concerning the environment and access by persons with disabilities; terrorist attacks or actions and/or cyber-attacks; weather conditions, natural disasters and pandemics; ability to maintain key personnel; failure to qualify and maintain our qualification as a REIT and the risks of changes in laws affecting REITs; and other risks and uncertainties detailed from time to time in our filings with the SEC, including our 2019 Form 10-K, as amended by Amendment No. 1 to the Annual Report on Form 10-K, filed on March 6, 2020, and subsequent Quarterly Reports on Form 10-Q. While forward-looking statements reflect our good faith beliefs, they are not guarantees of future performance. We undertake no obligation to update our forward-looking statements or risk factors to reflect new information, future events, or otherwise.
General
Introductory Matters
We provide our Management’s Discussion and Analysis of Financial Condition and Results of Operations (“MD&A”) in addition to the accompanying consolidated financial statements and notes to assist readers in understanding our results of operations and financial condition. We organize the MD&A as follows:
•Overview. Discussion of our business outlook, operating results, investment activity, financing activity and capital requirements to provide context for the remainder of MD&A.
•Results of Operations. Discussion of our financial results comparing the 2020 Quarter to the 2019 Quarter and the 2020 Period to 2019 Period.
•Liquidity and Capital Resources. Discussion of our financial condition and analysis of changes in our capital structure and cash flows.
•Funds From Operations. Calculation of NAREIT Funds From Operations (“NAREIT FFO”), a non-GAAP supplemental measure to net income.
•Critical Accounting Policies and Estimates. Descriptions of accounting policies that reflect significant judgments and estimates used in the preparation of our consolidated financial statements.
When evaluating our financial condition and operating performance, we focus on the following financial and non-financial indicators:
•Net operating income (“NOI”), calculated as set forth below under the caption "Results of Operations - Net Operating Income." NOI is a non-GAAP supplemental measure to net income.
•Funds From Operations (“NAREIT FFO”), calculated as set forth below under the caption “Funds from Operations.” NAREIT FFO is a non-GAAP supplemental measure to net income.
•Ending occupancy, calculated as occupied square footage or multifamily units as a percentage of total square footage or multifamily units, respectively, as of the last day of that period.
•Leased percentage, calculated as the percentage of available physical net rentable area leased for our commercial properties and percentage of apartments leased for our multifamily properties.
•Leasing activity, including new leases, renewals and expirations.
For purposes of evaluating comparative operating performance, we categorize our properties as “same-store”, “non-same-store” or discontinued operations. Same-store properties include properties that were owned for the entirety of the years being compared, and exclude properties under redevelopment or development and properties acquired, sold or classified as held for sale during the years being compared. We define development properties as those for which we have planned or ongoing major construction activities on existing or acquired land pursuant to an authorized development plan. We consider a property's development activities to be complete when the property is ready for its intended use. The property is categorized as same-store when it has been ready for its intended use for the entirety of the years being compared. We define redevelopment properties as those for which we have planned or ongoing significant development and construction activities on existing or acquired buildings pursuant to an authorized plan, which has an impact on current operating results, occupancy and the ability to lease space with the intended result of a higher economic return on the property. We categorize a redevelopment property as same-store when redevelopment activities have been complete for the majority of each year being compared.
Overview
Our revenues are derived primarily from the ownership and operation of income producing properties in the greater Washington metro region. As of June 30, 2020, we owned a diversified portfolio of 45 properties, totaling approximately 3.7 million square feet of commercial space and 6,861 multifamily units, and land held for development. These 45 properties consisted of 15 office properties, 8 retail centers and 22 multifamily properties.
Outlook
On March 11, 2020, the World Health Organization declared COVID-19, a respiratory illness caused by the novel coronavirus, a pandemic, and on March 13, 2020, the United States declared a national emergency with respect to COVID-19. The COVID-19 pandemic caused state and local governments within the Washington metro region to institute quarantines, "shelter-in-place" rules and restrictions on travel, the types of business that may continue to operate, and/or the types of construction projects that may continue. These actions resulted in modifications to our normal operations, including requiring our employees to work remotely with the exception of essential building personnel.
In June 2020, shelter-in-place orders began to phase out in the Washington metro region. As many of our commercial tenants have begun returning to their leased space, we have implemented robust plans to reduce the risk of exposure and further spread of the virus in our properties and continue to follow the mandates of public health officials and government agencies. We are adhering to occupancy restrictions at our properties where required.
The effects of the COVID-19 pandemic had a significant impact on our operating results for the 2020 Quarter. Beginning late in the first quarter of 2020 and continuing into the second quarter of 2020, many of our commercial tenants were closed or were
operating at significantly reduced capacity. Starting in April 2020, we began working with our commercial tenants on a case-by-case basis to the extent they demonstrated hardship as a result of the pandemic and financial ability to work through a satisfactory arrangement on a variety of relief options, generally involving negotiated deferral payment plans, early blend-and-extend renewals or abatement of rent. As of July 22, 2020, we collected 97% and 72% of office and retail cash rent during the 2020 Quarter, respectively, excluding the impact of contractual rent deferral agreements. By mid-June, most of our retail tenants had reopened. The effects of COVID-19 on our commercial tenants have been reflected in an increase in credit losses of $0.6 million for the 2020 Quarter compared to the first quarter of 2020. At our multifamily properties, we temporarily froze rents on full-year lease renewals, waived late fees and offered a payment deferral plan to residents who have been adversely financially impacted by COVID-19. As of June 30, 2020, we had collected 99% of multifamily cash rent during the 2020 Quarter excluding rent that has been deferred.
As of July 22, 2020, we agreed to defer $1.2 million, $1.0 million, and $0.1 million of rent due from office, retail, and multifamily tenants, respectively. The expected timing of the executed deferred rent paybacks is as follows:
______________________________
(1) Includes paybacks on deferred rent beginning July 1, 2020.
We had a decline in average occupancy of approximately 0.9% for the 2020 Quarter compared to both the first quarter of 2020 and second quarter of 2019, excluding the Trove which began lease-up in the first quarter of 2020. We continue to monitor and communicate with our commercial tenants to assess their needs and ability to pay rent. The effects of the COVID-19 pandemic have also impacted our ability to lease up available commercial space as physical touring stopped during shelter in place orders and lease decisions have been slower for prospective tenants as they re-evaluate re-entry and space plans. New gross leasing square footage for the 2020 Quarter declined by 38% and 99% for office and retail space, respectively, compared to the 2019 Quarter. As of June 30, 2020, we had approximately 420,000 square feet of vacant commercial space and approximately 140,000 square feet of commercial lease expirations scheduled for the remainder of 2020. For our multifamily properties, we expect the economic disruptions caused by the COVID-19 pandemic to limit our ability to increase rental rates for the foreseeable future. To help mitigate the impact on our operating results of the COVID-19 pandemic, we have initiated various operational cost saving initiatives across our portfolio.
We expect the COVID-19 outbreak will continue to affect our financial condition and results of operations going forward, including but not limited to, real estate rental revenues, credit losses and leasing activity. Given our concentration in a single region, the Washington metro region, our entire portfolio could be impacted for the foreseeable future by quarantines, "shelter-in-place" rules and various other restrictions imposed or re-imposed in response to a surge in COVID-19 cases. Due to the uncertainty of the future impacts of the COVID-19 pandemic, the extent of the financial impact cannot be reasonably estimated at this time. For more information, see Part II - Item 1A. Risk Factors” included elsewhere in this Quarterly Report on Form 10-Q.
New legislation was enacted during the 2020 Period to provide relief to businesses in response to the COVID-19 pandemic. We continue to evaluate the relief options available, such as the Coronavirus Aid, Relief, and Economic Securities Act (“CARES Act”), as well as other emergency relief initiatives and stimulus packages instituted by the federal government. A number of the relief options contain restrictions on future business activities, including ability to repurchase shares and pay dividends that require careful evaluation and consideration. We will continue to assess these options and any subsequent legislation or other relief packages, including the accompanying restrictions on our business, as the pandemic continues to evolve. The legislation did not have a material impact on our results of operations for the 2020 Quarter or 2020 Period.
Operating Results
Net (loss) income attributable to the controlling interests, NOI and NAREIT FFO for the three months ended June 30, 2020 and 2019 were as follows (in thousands):
| | | | | | | | | | | | | | | | | | | | | | | |
| Three Months Ended June 30, | | | | | | |
| 2020 | | 2019 | | $ Change | | % Change |
| Net (loss) income attributable to the controlling interests | $ | (5,406) | | | $ | 987 | | | $ | (6,393) | | | (647.7) | % |
NOI (1) | 45,985 | | | 48,686 | | | (2,701) | | | (5.5) | % |
NAREIT FFO (2) | $ | 31,732 | | | $ | 37,454 | | | $ | (5,722) | | | (15.3) | % |
______________________________ | | | | | | | |
(1) See page 31 of the MD&A for a reconciliation of NOI to net income. | | | | | | | |
(2) See page 41 of the MD&A for a reconciliation of NAREIT FFO to net income. | | | | | | | |
The decrease in net income attributable to the controlling interests is primarily due to lower income from discontinued operations ($7.2 million), higher loss on sale of real estate ($6.5 million), lower NOI ($2.7 million) and loss on extinguishment of debt ($0.2 million), partially offset by lower interest expense ($6.5 million), lower depreciation and amortization ($3.4 million) and lower general and administrative expenses ($0.2 million) in the 2020 Quarter.
The lower NOI is primarily due to the sales of 1776 G Street ($2.2 million) and Quantico Corporate Center ($0.9 million) during 2019 and John Marshall II ($0.9 million) during the 2020 Quarter and lower NOI from same-store properties ($1.8 million) partially offset by the acquisitions of seven suburban Class B apartment communities in northern Virginia and Montgomery County, Maryland (“Assembly Portfolio”), and Cascade at Landmark ($3.2 million) during 2019. The lower same-store NOI is explained in further detail beginning on page 28 (Results of Operations - 2020 Quarter Compared to 2019 Quarter). Same-store ending occupancy decreased to 90.0% as of June 30, 2020 from 92.2% as of June 30, 2019, due to lower occupancy across the portfolio.
The lower NAREIT FFO is primarily attributable to lower income from discontinued operations net of depreciation and amortization ($9.5 million) and lower NOI ($2.7 million), partially offset by lower interest expense ($6.5 million).
Investment and Financing Activity
Significant investment and financing transactions during the 2020 Period included the following:
•The prepayment of the $45.6 million mortgage note secured by Yale West, which was scheduled to mature in 2052. As a result of the transaction, we recognized a gain on extinguishment of debt of $0.5 million related to the write-off of an unamortized mortgage premium of $1.4 million, partially offset by a prepayment penalty of $0.9 million.
•The disposition of John Marshall II, a 223,000 square foot office property in Tysons, Virginia, for a contract sales price of $57.0 million. As a result of this transaction, we recognized a loss on sale of real estate of $6.9 million.
•The prepayment of the $250.0 million of 4.95% Senior Notes without penalty using borrowings from our Revolving Credit Facility.
•The execution of the one-year, $150.0 million 2020 Term Loan, maturing on May 5, 2021 with a one-year extension option. The 2020 Term Loan bears interest at LIBOR + 1.50%, which margin is subject to change based on our credit ratings, with a 0.50% floor for the LIBOR rate. We used the proceeds to repay borrowings under our Revolving Credit Facility.
As of June 30, 2020, the interest rate on the $700.0 million unsecured revolving credit facility (“Revolving Credit Facility”) was one month LIBOR plus 1.00% and the facility fee was 0.20%. As of July 27, 2020, our Revolving Credit Facility has a borrowing capacity of $496.0 million.
Capital Requirements
As described in the preceding section, during the 2020 Period we prepaid the mortgage note payable secured by Yale West. Following this prepayment, we have no mortgage notes.
We have no remaining debt maturities in 2020. We expect to have additional capital requirements as set forth on page 31 (Liquidity and Capital Resources - Capital Requirements).
Results of Operations
The discussion that follows is based on our consolidated results of operations for the 2020 Quarter and 2020 Period and 2019 Quarter and 2019 Period. The ability to compare one period to another is significantly affected by acquisitions completed and dispositions made during 2020 and 2019 (see note 3 to the consolidated financial statements). Additionally, the COVID-19 pandemic adversely impacted our operating results for the 2020 Quarter, and we expect that the COVID-19 outbreak will continue to adversely affect our business, financial condition, results of operations and cash flows going forward, including but not limited to, real estate rental revenues, credit losses, and leasing activity, in ways that may vary widely depending on the duration and magnitude of the COVID-19 pandemic and ensuing economic turmoil, as well as numerous factors, many of which are outside of our control, as discussed under “Risk Factors.”
Net Operating Income
NOI, defined as real estate rental revenue less real estate expenses, is a non-GAAP measure. NOI is calculated as net income, less non-real estate revenue and the results of discontinued operations (including the gain or loss on sale, if any), plus interest expense, depreciation and amortization, lease origination expenses, general and administrative expenses, real estate impairment and gain or loss on extinguishment of debt. We believe that NOI is useful as a performance measure because, when compared across periods, NOI reflects the impact on operations of trends in occupancy rates, rental rates and operating costs on an unleveraged basis, providing perspective not immediately apparent from net income. NOI excludes certain components from net income in order to provide results more closely related to a property’s results of operations. For example, interest expense is not necessarily linked to the operating performance of a real estate asset. In addition, depreciation and amortization, because of historical cost accounting and useful life estimates, may distort operating performance at the property level. As a result of the foregoing, we provide NOI as a supplement to net income, calculated in accordance with GAAP. NOI does not represent net income or income from continuing operations, in either case calculated in accordance with GAAP. As such, it should not be considered an alternative to these measures as an indication of our operating performance. A reconciliation of NOI to net income follows.
2020 Quarter Compared to 2019 Quarter
The following table reconciles NOI to net income attributable to the controlling interests and provides the basis for our discussion of our consolidated results of operations and NOI in the 2020 Quarter compared to the 2019 Quarter. All amounts are in thousands, except percentage amounts.
| | | | | | | | | | | | | | | | | | | | | | | | | | | | | | | | | | | | | | | | | | | | | | | | | | | | | | | | | | | | | | | | | | | | | | | | | | | | | | | | | | | |
| | | | | | | | | Non-Same-Store | | | | | | | | | | | | | | | | | | |
| | Same-Store | | | | | | | | Acquisitions (1) | | | | Development/ Re-development (2) | | | | Held for Sale or Sold (3) | | | | Consolidated | | | | | | |
| | 2020 | | 2019 | | $
Change | | %
Change | | 2020 | | 2019 | | 2020 | | 2019 | | 2020 | | 2019 | | 2020 | | 2019 | | $
Change | | %
Change |
| Real estate rental revenue | $ | 60,998 | | | $ | 64,545 | | | $ | (3,547) | | | (5.5) | % | | $ | 11,276 | | | $ | 5,453 | | | $ | 214 | | | $ | — | | | $ | 382 | | | $ | 6,822 | | | $ | 72,870 | | | $ | 76,820 | | | $ | (3,950) | | | (5.1) | % |
Real estate expenses | 21,800 | | | 23,518 | | | (1,718) | | | (7.3) | % | | 4,625 | | | 2,047 | | | 304 | | | — | | | 156 | | | 2,569 | | | 26,885 | | | 28,134 | | | (1,249) | | | (4.4) | % |
| NOI | $ | 39,198 | | | $ | 41,027 | | | $ | (1,829) | | | (4.5) | % | | $ | 6,651 | | | $ | 3,406 | | | $ | (90) | | | $ | — | | | $ | 226 | | | $ | 4,253 | | | $ | 45,985 | | | $ | 48,686 | | | $ | (2,701) | | | (5.5) | % |
| Reconciliation to net income attributable to the controlling interests: | | | | | | | | | | | | | | | | | | | | | | | | | | | |
| Depreciation and amortization | | | | | | | | | | | | | | | | | | | | | (29,599) | | | (33,044) | | | 3,445 | | | (10.4) | % |
| | | | | | | | | | | | | | | | | | | | | | | | | | | |
| General and administrative expenses | | | | | | | | | | | | | | | | | | | | | (5,296) | | | (5,535) | | | 239 | | | (4.3) | % |
| | | | | | | | | | | | | | | | | | | | | | | | | | | |
| | | | | | | | | | | | | | | | | | | | | | | | | | | |
| | | | | | | | | | | | | | | | | | | | | | | | | | | |
| Loss on sale of real estate | | | | | | | | | | | | | | | | | | | | | (7,539) | | | (1,046) | | | (6,493) | | | 620.7 | % |
| Interest expense | | | | | | | | | | | | | | | | | | | | | (8,751) | | | (15,252) | | | 6,501 | | | (42.6) | % |
| | | | | | | | | | | | | | | | | | | | | | | | | | | |
| Loss on extinguishment of debt | | | | | | | | | | | | | | | | | | | | | (206) | | | — | | | (206) | | | |
| | | | | | | | | | | | | | | | | | | | | | | | | | | |
Discontinued operations (4): | | | | | | | | | | | | | | | | | | | | | | | | | | | |
| Income from properties sold or held for sale | | | | | | | | | | | | | | | | | | | | | — | | | 7,178 | | | (7,178) | | | (100.0) | % |
| | | | | | | | | | | | | | | | | | | | | | | | | | | |
| | | | | | | | | | | | | | | | | | | | | | | | | | | |
| Net (loss) income | | | | | | | | | | | | | | | | | | | | | (5,406) | | | 987 | | | (6,393) | | | (647.7) | % |
| Less: Net income attributable to noncontrolling interests | | | | | | | | | | | | | | | | | | | | | — | | | — | | | — | | | — | % |
| Net (loss) income attributable to the controlling interests | | | | | | | | | | | | | | | | | | | | | $ | (5,406) | | | $ | 987 | | | $ | (6,393) | | | (647.7) | % |
______________________________
(1)Acquisitions:
2019 Multifamily - Assembly Portfolio and Cascade at Landmark
(2)Development/redevelopment:
Multifamily - The Trove
(3)Sold (classified as continuing operations):
2020 Office - John Marshall II
2019 Office - Quantico Corporate Center and 1776 G Street
(4)Discontinued operations:
2019 Retail - Wheaton Park, Bradlee Shopping Center, Shoppes of Foxchase, Gateway Overlook, Olney Village Center, Frederick County Square, Centre at Hagerstown and Frederick Crossing
Real Estate Rental Revenue
Real estate rental revenue is comprised of (a) minimum base rent, which includes rental revenues recognized on a straight-line basis, (b) revenue from the recovery of operating expenses from our tenants, (c) credit losses on lease related receivables, (d) revenue from the collection of lease termination fees and (e) parking and other tenant charges such as percentage rents.
Real estate rental revenue from same-store properties by segment was as follows (in thousands):
| | | | | | | | | | | | | | | | | | | | | | | |
| | Three Months Ended June 30, | | | | | | |
| | 2020 | | 2019 | | $ Change | | % Change |
Multifamily | $ | 24,548 | | | $ | 24,434 | | | $ | 114 | | | 0.5 | % |
| Office | 32,532 | | | 35,239 | | | (2,707) | | | (7.7) | % |
Other | 3,918 | | | 4,872 | | | (954) | | | (19.6) | % |
| Total same-store real estate rental revenue | $ | 60,998 | | | $ | 64,545 | | | $ | (3,547) | | | (5.5) | % |
•Multifamily: Increase primarily due to higher rental revenue ($0.3 million) caused by higher rental rates, partially offset by waived fees ($0.1 million) and higher credit losses ($0.1 million) related to the COVID-19 pandemic.
•Office: Decrease primarily due to lower parking income ($0.9 million), lower termination fees ($0.8 million), lower rental revenue ($0.4 million), higher credit losses ($0.4 million) and lower recoveries ($0.3 million), partially offset by higher specialty leasing ($0.2 million). The lower parking income and higher credit losses were primarily due to the COVID-19 pandemic.
Real estate rental revenue from acquisitions increased due to the acquisitions of Assembly Portfolio ($4.2 million) during the 2019 Quarter and Cascade at Landmark ($1.6 million) during the third quarter of 2019.
Real estate rental revenue from held for sale and sold properties classified as continuing operations decreased due to the sale of 1776 G Street ($3.5 million) during the fourth quarter of 2019, Quantico Corporate Center ($1.4 million) during the second quarter of 2019 and John Marshall II ($1.5 million) during the 2020 Quarter.
Ending occupancy for properties classified as continuing operations by segment for the 2020 Quarter and 2019 Quarter was as follows:
| | | | | | | | | | | | | | | | | | | | | | | | | | | | | | | | | | | | | | | | | | | | | | | | | | | | | |
| June 30, 2020 | | | | | | June 30, 2019 | | | | | | (Decrease) increase | | | | |
| Segment | Same-Store | | Non-Same-Store | | Total | | Same-Store | | Non-Same-Store | | Total | | Same-Store | | Non-Same-Store | | Total |
| Multifamily | 93.8 | % | | 83.7 | % | | 89.8 | % | | 95.2 | % | | 95.4 | % | | 95.3 | % | | (1.4) | % | | (11.7) | % | | (5.5) | % |
| Office | 86.8 | % | | N/A | | 86.8 | % | | 89.2 | % | | 100.0 | % | | 90.7 | % | | (2.4) | % | | N/A | | (3.9) | % |
| Other | 84.0 | % | | N/A | | 84.0 | % | | 88.7 | % | | N/A | | 88.7 | % | | (4.7) | % | | N/A | | (4.7) | % |
| Total | 90.0 | % | | 83.7 | % | | 89.4 | % | | 92.2 | % | | 96.3 | % | | 93.2 | % | | (2.2) | % | | (12.6) | % | | (3.8) | % |
•Multifamily: Decrease in same-store ending occupancy was primarily due to lower ending occupancy at The Ashby, 3801 Connecticut Avenue, The Maxwell and The Paramount, partially offset by higher ending occupancy at The Kenmore.
•Office: Decrease in same-store ending occupancy was primarily due to lower ending occupancy at 1220 19th Street, 515 King Street, 1775 Eye Street and Fairgate at Ballston, partially offset by higher ending occupancy at Watergate 600.
During the 2020 Quarter, we executed new and renewal leases in our office segment as follows:
| | | | | | | | | | | | | | | | | | | | | | | | | | | | | | | |
| Square Feet
(in thousands) | | Average Rental Rate
(per square foot) | | % Rental Rate Increase (Decrease) | | Leasing Costs (1) (per square foot) | | Free Rent (weighted average months) | | |
| Office | 35 | | | $ | 53.82 | | | 7.9 | % | | $ | 61.83 | | | 6.0 | | | |
______________________________
(1) Consists of tenant improvements and leasing commissions.
Real Estate Expenses
Real estate expenses as a percentage of revenue for the 2020 Quarter and 2019 Quarter were 36.9% and 36.6%, respectively.
Real estate expenses from same-store properties by segment were as follows (in thousands):
| | | | | | | | | | | | | | | | | | | | | | | |
| | Three Months Ended June 30, | | | | | | |
| | 2020 | | 2019 | | $ Change | | % Change |
Multifamily | $ | 9,181 | | | $ | 9,179 | | | $ | 2 | | | — | % |
| Office | 11,361 | | | 12,996 | | | (1,635) | | | (12.6) | % |
Other | 1,258 | | | 1,343 | | | (85) | | | (6.3) | % |
| Total same-store real estate expenses | $ | 21,800 | | | $ | 23,518 | | | $ | (1,718) | | | (7.3) | % |
•Multifamily: Increase primarily due to higher real estate taxes ($0.1 million), partially offset by lower repairs and maintenance ($0.1 million) expenses.
•Office: Decrease primarily due to lower utilities ($0.7 million), lower contract maintenance ($0.5 million) and lower administrative ($0.4 million) expenses.
Other Income and Expenses
Depreciation and Amortization: Decrease primarily due to the amortization of intangible lease assets at the Assembly Portfolio ($2.8 million) in 2019 and the dispositions of John Marshall II ($0.8 million), 1776 G Street ($0.7 million) and Quantico Corporate Center ($0.2 million), and by lower depreciation and amortization at same-store properties ($0.3 million). These decreases were
partially offset by the acquisition of Cascade at Landmark ($0.6 million) and placing into service a portion of The Trove development ($0.7 million).
General and administrative expenses: Decrease primarily due to lower short-term incentive compensation ($0.8 million), partially offset by the reversal of a tax liability related to a prior acquisition ($0.7 million) during the 2019 Quarter.
Loss on sale of real estate: The loss during 2020 Quarter is due to the sale of John Marshall II. The loss during 2019 Quarter is due to the sale of Quantico Corporate Center.
Interest Expense: Interest expense by debt type for the three months ended June 30, 2020 and 2019 was as follows (in thousands):
| | | | | | | | | | | | | | | | | | | | | | | |
| Three Months Ended June 30, | | | | | | |
| Debt Type | 2020 | | 2019 | | $ Change | | % Change |
| Notes payable | $ | 7,562 | | | $ | 13,168 | | | $ | (5,606) | | | (42.6) | % |
| Mortgage notes payable | — | | | 519 | | | (519) | | | (100.0) | % |
| Line of credit | 1,725 | | | 2,354 | | | (629) | | | (26.7) | % |
| Capitalized interest | (536) | | | (789) | | | 253 | | | (32.1) | % |
| Total | $ | 8,751 | | | $ | 15,252 | | | $ | (6,501) | | | (42.6) | % |
•Notes payable: Decrease primarily due to prepayment of the $250.0 million of 4.95% Senior Notes in April 2020 and executing a six-month $450.0 million 2019 Term Loan in April 2019 which was repaid in the third quarter of 2019, partially offset by a new $150.0 million 2020 Term Loan executed in May 2020.
•Mortgage notes payable: Decrease due to repayments of the mortgage note secured by Olney Village Center in July 2019 and the mortgage note secured by Yale West Apartments in January 2020.
•Line of credit: Decrease primarily due to weighted average interest rate of 1.5% during the 2020 Quarter, as compared to 3.5% during the 2019 Quarter. The impact of the lower weighted average interest rate was partially offset by higher weighted average borrowings of $269.1 million in 2020 Quarter, as compared to $190.8 million during the 2019 Quarter.
•Capitalized interest: Decrease primarily due to placing into service assets at The Trove, the multifamily development adjacent to The Wellington.
Loss on extinguishment of debt: We recognized a $0.2 million loss on extinguishment of debt during the 2020 Quarter related to the prepayment of the $250.0 million of 4.95% Senior Notes that were scheduled to mature in October 2020.
Discontinued operations:
Income from properties sold or held for sale: Decrease primarily due to the sale of the properties classified as discontinued operations during the third quarter of 2019.
2020 Period Compared to 2019 Period
The following tables reconcile NOI to net income attributable to the controlling interests and provide the basis for our discussion of our consolidated results of operations and NOI in the 2020 Period compared to the 2019 Period. All amounts are in thousands, except percentage amounts.
| | | | | | | | | | | | | | | | | | | | | | | | | | | | | | | | | | | | | | | | | | | | | | | | | | | | | | | | | | | | | | | | | | | | | | | | | | | | | | | | | | | |
| | | | | | | | | Non-Same-Store | | | | | | | | | | | | | | | | | | |
| | Same-Store | | | | | | | | Acquisitions (1) | | | | Development/Redevelopment (2) | | | | Held for Sale or Sold (3) | | | | All Properties | | | | | | |
| | 2020 | | 2019 | | $
Change | | %
Change | | 2020 | | 2019 | | 2020 | | 2019 | | 2020 | | 2019 | | 2020 | | 2019 | | $
Change | | %
Change |
| Real estate rental revenue | $ | 124,527 | | | $ | 129,198 | | | $ | (4,671) | | | (3.6) | % | | $ | 22,713 | | | $ | 5,453 | | | $ | 251 | | | $ | — | | | $ | 2,171 | | | $ | 13,603 | | | $ | 149,662 | | | $ | 148,254 | | | $ | 1,408 | | | 0.9 | % |
Real estate expenses | 44,998 | | | 47,193 | | | (2,195) | | | (4.7) | % | | 9,136 | | | 2,047 | | | 551 | | | — | | | 839 | | | 5,037 | | | 55,524 | | | 54,277 | | | 1,247 | | | 2.3 | % |
| NOI | $ | 79,529 | | | $ | 82,005 | | | $ | (2,476) | | | (3.0) | % | | $ | 13,577 | | | $ | 3,406 | | | $ | (300) | | | $ | — | | | $ | 1,332 | | | $ | 8,566 | | | $ | 94,138 | | | $ | 93,977 | | | $ | 161 | | | 0.2 | % |
| Reconciliation to net income attributable to the controlling interests: | | | | | | | | | | | | | | | | | | | | | | | | | | | |
| Depreciation and amortization | | | | | | | | | | | | | | | | | | | | | (59,319) | | | (60,101) | | | 782 | | | (1.3) | % |
| | | | | | | | | | | | | | | | | | | | | | | | | | | |
| General and administrative expenses | | | | | | | | | | | | | | | | | | | | | (11,633) | | | (13,342) | | | 1,709 | | | (12.8) | % |
| | | | | | | | | | | | | | | | | | | | | | | | | | | |
| | | | | | | | | | | | | | | | | | | | | | | | | | | |
| Real estate impairment | | | | | | | | | | | | | | | | | | | | | — | | | (8,374) | | | 8,374 | | | (100.0) | % |
| Loss on sale of real estate | | | | | | | | | | | | | | | | | | | | | (7,539) | | | (1,046) | | | (6,493) | | | 620.7 | % |
| Interest expense | | | | | | | | | | | | | | | | | | | | | (19,596) | | | (27,748) | | | 8,152 | | | (29.4) | % |
| | | | | | | | | | | | | | | | | | | | | | | | | | | |
| Gain on extinguishment of debt | | | | | | | | | | | | | | | | | | | | | 262 | | | — | | | 262 | | | |
| | | | | | | | | | | | | | | | | | | | | | | | | | | |
| | | | | | | | | | | | | | | | | | | | | | | | | | | |
Discontinued operations (4): | | | | | | | | | | | | | | | | | | | | | | | | | | | |
| Income from properties sold or held for sale | | | | | | | | | | | | | | | | | | | | | — | | | 13,216 | | | (13,216) | | | (100.0) | % |
| | | | | | | | | | | | | | | | | | | | | | | | | | | |
| | | | | | | | | | | | | | | | | | | | | | | | | | | |
| Net loss | | | | | | | | | | | | | | | | | | | | | (3,687) | | | (3,418) | | | (269) | | | 7.9 | % |
| Less: Net income attributable to noncontrolling interests | | | | | | | | | | | | | | | | | | | | | — | | | — | | | — | | | — | % |
| Net loss attributable to the controlling interests | | | | | | | | | | | | | | | | | | | | | $ | (3,687) | | | $ | (3,418) | | | $ | (269) | | | 7.9 | % |
(1)Acquisitions:
2019 Multifamily - Assembly Portfolio and Cascade at Landmark
(2)Development/redevelopment:
Multifamily – The Trove
(3)Sold (classified as continuing operations):
2020 Office - John Marshall II
2019 Office - Quantico Corporate Center and 1776 G Street
(4)Discontinued operations:
2019 Retail - Wheaton Park, Bradlee Shopping Center, Shoppes of Foxchase, Gateway Overlook, Olney Village Center, Frederick County Square, Centre at Hagerstown and Frederick Crossing
Real Estate Rental Revenue
Real estate rental revenue is comprised of (a) minimum base rent, which includes rental revenues recognized on a straight-line basis, (b) revenue from the recovery of operating expenses from our tenants, (c) credit losses on lease related receivables, (d) revenue from the collection of lease termination fees and (e) parking and other tenant charges such as percentage rents.
Real estate rental revenue from same-store properties by segment was as follows (in thousands):
| | | | | | | | | | | | | | | | | | | | | | | |
| | Six Months Ended June 30, | | | | | | |
| | 2020 | | 2019 | | $ Change | | % Change |
Multifamily | $ | 49,652 | | | $ | 48,769 | | | $ | 883 | | | 1.8 | % |
| Office | 66,413 | | | 70,751 | | | (4,338) | | | (6.1) | % |
Other | 8,462 | | | 9,678 | | | (1,216) | | | (12.6) | % |
| Total same-store real estate rental revenue | $ | 124,527 | | | $ | 129,198 | | | $ | (4,671) | | | (3.6) | % |
•Multifamily: Increase primarily due to higher rental rates ($1.0 million) and parking income ($0.1 million), partially offset by higher waived fees ($0.1 million) and credit losses ($0.1 million) related to the COVID-19 pandemic.
•Office: Decrease primarily due to lower rental income ($1.2 million) due to lease expirations at 1220 19th Street, 1227 25th Street, 1775 Eye Street and Arlington Tower, partially offset by new leases at Watergate 600, lower lease termination fees ($1.2 million), lower parking income ($0.9 million), higher credit losses ($0.9 million) and lower recoveries ($0.8 million). The lower parking income and higher credit losses are primarily due to the COVID-19 pandemic. These decreases were partially offset by higher specialty leasing ($0.4 million) and lower rent abatements ($0.2 million).
Real estate rental revenue from acquisitions increased due to the acquisitions of the Assembly Portfolio ($14.1 million) during the 2019 Quarter and Cascade at Landmark ($3.2 million) during the third quarter of 2019.
Real estate rental revenue from sold properties classified as continuing operations decreased due to the sale of 1776 G Street ($7.0 million) during the fourth quarter of 2019, Quantico Corporate Center ($2.8 million) during the second quarter of 2019 and John Marshall II ($1.6 million) during the 2020 Quarter.
During the 2020 Period, we executed new and renewal leases in our office segment as follows:
| | | | | | | | | | | | | | | | | | | | | | | | | | | | | | | |
| Square Feet
(in thousands) | | Average Rental Rate
(per square foot) | | % Rental Rate Increase | | Leasing Costs (1)
(per square foot) | | Free Rent (weighted average months) | | |
| Office | 124 | | | $ | 48.91 | | | 13.4 | % | | $ | 25.73 | | | 2.8 | | | |
| | | | | | | | | | | |
| | | | | | | | | | | |
______________________________
(1) Consists of tenant improvements and leasing commissions.
Real Estate Expenses
Real estate expenses as a percentage of revenue for the 2020 Period and 2019 Period were 37.1% and 36.6%, respectively.
Real estate expenses from same-store properties by segment were as follows (in thousands):
| | | | | | | | | | | | | | | | | | | | | | | |
| | Six Months Ended June 30, | | | | | | |
| | 2020 | | 2019 | | $ Change | | % Change |
Multifamily | $ | 18,408 | | | $ | 18,649 | | | (241) | | | (1.3) | % |
| Office | 23,995 | | | 25,752 | | | (1,757) | | | (6.8) | % |
Other | 2,595 | | | 2,792 | | | (197) | | | (7.1) | % |
| Total same-store real estate expenses | $ | 44,998 | | | $ | 47,193 | | | $ | (2,195) | | | (4.7) | % |
•Multifamily: Decrease primarily due to lower utilities ($0.3 million), repairs and maintenance ($0.1 million) and contract maintenance ($0.1 million) expenses, partially offset by higher real estate tax ($0.2 million) and insurance ($0.1 million) expenses.
•Office: Decrease primarily due to lower utilities ($0.8 million), contract maintenance ($0.5 million) and administrative ($0.4 million) expenses.
Other Income and Expenses
Depreciation and Amortization: Decrease primarily due to the dispositions of John Marshall II ($1.5 million), 1776 G Street ($1.4 million), Quantico Corporate Center ($0.8 million) and by lower depreciation and amortization at same-store properties ($1.2 million). These decreases were partially offset by the acquisitions of Assembly Portfolio ($1.9 million) and Cascade at Landmark ($1.3 million) and placing into service a portion of The Trove development ($0.9 million) during the 2020 Period.
General and administrative expenses: Decrease primarily due to severance expenses ($0.7 million) and lower payroll ($0.5 million) related to a corporate restructuring in the 2019 Period, and due to lower short term incentive compensation ($0.8 million) and lower share-based compensation ($0.6 million) in the 2020 Period, partially offset by the reversal of a transfer tax liability related to a prior year acquisition ($0.7 million).
Real estate impairment: The real estate impairment charge of $8.4 million during the first quarter of 2019 reduced the carrying value of Quantico Corporate Center to its estimated fair value (see note 3 to the consolidated financial statements).
Loss on sale of real estate: The loss during 2020 Period is due to the sale of John Marshall II. The loss during the 2019 Period is due to the sale of Quantico Corporate Center.
Gain on extinguishment of debt: We recognized a gain on extinguishment of debt $0.5 million during the first quarter of 2020 related to the prepayment of the mortgage note secured by Yale West Apartments. This was partially offset by a loss on extinguishment of debt of $0.2 million during the 2020 Quarter related to the prepayment of the $250.0 million of 4.95% Senior Notes that were scheduled to mature in October 2020.
Interest Expense: Interest expense by debt type for the six months ended June 30, 2020 and 2019 was as follows (in thousands):
| | | | | | | | | | | | | | | | | | | | | | | |
| Six Months Ended June 30, | | | | | | |
| Debt Type | 2020 | | 2019 | | $ Change | | % Change |
| Notes payable | $ | 17,721 | | | $ | 23,300 | | | $ | (5,579) | | | (23.9) | % |
| Mortgage notes payable | 172 | | | 1,040 | | | (868) | | | (83.5) | % |
| Line of credit | 3,123 | | | 4,910 | | | (1,787) | | | (36.4) | % |
| Capitalized interest | (1,420) | | | (1,502) | | | 82 | | | (5.5) | % |
| Total | $ | 19,596 | | | $ | 27,748 | | | $ | (8,152) | | | (29.4) | % |
•Notes payable: Decrease primarily due to prepayment of the $250.0 million of 4.95% Senior Notes in April 2020 and the execution of a six-month $450.0 million 2019 Term Loan in April 2019 that was repaid in the third quarter of 2019, partially offset by the new $150.0 million 2020 Term Loan executed in May 2020.
•Mortgage notes payable: Decrease due to repayments of the mortgage note secured by Olney Village Center in July 2019 and the mortgage note secured by Yale West Apartments in January 2020.
•Line of credit: Decrease primarily due to lower weighted average borrowings of $188.6 million and a lower weighted average interest rate of 1.8% during the 2020 Period, as compared to $200.5 million and 3.5%, respectively, during the 2019 Period.
•Capitalized interest: Decrease primarily due to placing into service assets at The Trove, the multifamily development adjacent to The Wellington. This decrease was partially offset by higher spending related to The Trove and the multifamily development adjacent to Riverside Apartments.
Discontinued operations:
Income from properties sold or held for sale: Decrease primarily due to the sale of the properties classified as discontinued operations during third quarter of 2019.
Liquidity and Capital Resources
As the local and global economies have weakened as a result of COVID-19, ensuring adequate liquidity is critical. We believe we have access to adequate resources to meet the needs of our existing operations, mandatory capital expenditures, dividend payments, and working capital, to the extent not funded by cash provided by operating activities. However, we expect the COVID-19 pandemic to continue to adversely impact our future operating cash flows. Such adverse impacts include the inability of some of our tenants to pay their rent on time or at all, longer lease-up periods for both anticipated and unanticipated vacancies and temporary rental rate freezes.
In April 2020, we prepaid without penalty our $250.0 million of 4.95% unsecured notes using borrowings on our Revolving Credit Facility. Following that prepayment, we have no remaining debt maturities in 2020 and $150 million of debt maturities in 2021.
In April 2020, we executed an amendment to John Marshall II purchase and sale agreement decreasing the contract sale price to $57.0 million and closed on the sale on April 21, 2020.
In May 2020, the Company closed on a one-year unsecured term loan, with a one-year extension option, in a principal amount of $150.0 million. We used the proceeds to repay borrowings under our Revolving Credit Facility. As of July 27, 2020, we had $204.0 million of borrowings outstanding on our Revolving Credit Facility, leaving $496.0 million of borrowing capacity.
Due to our remaining borrowing capacity on our Revolving Credit Facility and the fact that we do not have any debt maturities for the remainder of 2020, we believe we have adequate liquidity to meet any major capital needs and commitments for the remainder of 2020.
We believe we have the ability to raise capital through the equity, debt and credit markets, market conditions permitting. However, disruptions in these markets may negatively impact our ability to access capital. These events may also make it more difficult or costly for us to raise capital through the issuance of our securities or through private financings, and may require us to adjust our planned expenditures for the year accordingly.
In addition, we believe we have the ability to access Agency debt, such as Fannie Mae or Freddie Mac secured loans, using a part of our unencumbered multifamily portfolio, if necessary. However, there can be no assurances that such loans would be available or that they would be available on reasonable terms.
Capital Requirements
In response to the COVID-19 pandemic, we have significantly reduced our estimated capital requirements as compared to the estimates we disclosed in our Annual Report on Form 10-K for the year ended December 31, 2019. We have reduced 2020 assumed capital expenditures for the balance of the year by approximately $40 million, including by deferring non-essential building restorations, some tenant improvements and leasing costs for speculative leasing, and lower multifamily renovation capital expenditures, as well as decreasing our anticipated development spending as we no longer expect to break ground on the new Riverside development this year. As of the end of the second quarter of 2020, our full-year 2020 capital requirements are currently expected to consist of the following:
•Funding dividends and distributions to our shareholders;
•Approximately $55.0 - $60.0 million to invest in our existing portfolio of operating assets, including approximately $20.0 - $25.0 million to fund tenant-related capital requirements and leasing commissions;
•Approximately $30.0 - $35.0 million to invest in our development and redevelopment projects; and
•Funding for potential property acquisitions during 2020, offset by proceeds from potential property dispositions.
Debt Financing
We generally use secured or unsecured, corporate-level debt, including unsecured notes, our Revolving Credit Facility, bank term loans and mortgages, to meet our borrowing needs. Long-term, we generally use fixed rate debt instruments in order to match the returns from our real estate assets. If we issue unsecured debt in the future, we would seek to “ladder” the maturities of our debt to mitigate exposure to interest rate risk in any particular future year. We also utilize variable rate debt for short-term financing purposes. At times, our mix of variable and fixed rate debt may not suit our needs. At those times, we may use derivative financial instruments including interest rate swaps and caps, forward interest rate options or interest rate options in order to assist us in managing our debt mix. We may hedge our variable rate debt to give it an effective fixed interest rate and hedge fixed rate debt to give it an effective variable interest rate.
In January 2020, we prepaid the $45.6 million mortgage note payable secured by Yale West, recognizing a gain on extinguishment of debt of $0.5 million using borrowings on our Revolving Credit Facility. Following the repayment of this mortgage note, we have no mortgage notes outstanding.
Our future debt principal payments are scheduled as follows (in thousands):
| | | | | | | | | | | | | | | | | | | | | | | | | |
| | | Future Maturities of Debt | | | | | | |
| Year | | | Unsecured Debt | | Revolving Credit Facility | | Total Debt | | Average Interest Rate |
| 2020 | | | $ | — | | | $ | — | | | $ | — | | | —% |
| 2021 | | | 150,000 | | (1) | — | | | 150,000 | | | 2.7% |
| 2022 | | | 450,000 | | (2) | — | | | 450,000 | | | 3.3% |
| 2023 | | | 250,000 | | (3) | 181,000 | | (4) | 431,000 | | | 2.2% |
| 2024 | | | — | | | — | | | — | | | —% |
| 2025 | | | — | | | — | | | — | | | —% |
| Thereafter | | | 50,000 | | | — | | | 50,000 | | | 7.3% |
| Scheduled principal payments | | | $ | 900,000 | | | $ | 181,000 | | | $ | 1,081,000 | | | 3.0% |
| | | | | | | | | |
| Net premiums/discounts | | | (551) | | | — | | | (551) | | | |
| Loan costs, net of amortization | | | (2,389) | | | — | | | (2,389) | | | |
| Total | | | $ | 897,060 | | | $ | 181,000 | | | $ | 1,078,060 | | | 3.0% |
______________________________
(1) WashREIT entered into interest rate swaps to effectively fix a LIBOR plus 110 basis points floating interest rate to a 2.72% all-in fixed interest rate through the term loan maturity of March 2021.
(2) Maturity date for the $150.0 million term loan of May 2022 assumes election of option for an additional one-year period.
(3) WashREIT entered into interest rate swaps to effectively fix a LIBOR plus 110 basis points floating interest rate to a 2.31% all-in fixed interest rate for $150.0 million portion of the term loan. For the remaining $100.0 million portion of the term loan, WashREIT entered into interest rate swaps to effectively fix a LIBOR plus 100 basis points floating interest rate to a 3.71% all-in fixed interest rate. The interest rates are fixed through the term loan maturity of July 2023. The 2018 Term Loan has an all-in fixed interest rate of 2.87%.
(4) Maturity date for credit facility of March 2023 assumes election of option for two additional 6-month periods.
The weighted average maturity for our debt is 2.4 years. If principal amounts due at maturity cannot be refinanced, extended or paid with proceeds of other capital transactions, such as new equity capital, our cash flow may be insufficient to repay all maturing debt. Prevailing interest rates or other factors at the time of a refinancing, such as possible reluctance of lenders to make commercial real estate loans, may result in higher interest rates and increased interest expense or inhibit our ability to finance our obligations.
From time to time, we may seek to repurchase and cancel our outstanding unsecured notes and term loans through open market purchases, privately negotiated transactions or otherwise. Such repurchases, if any, will depend on prevailing market conditions, our liquidity requirements, contractual restrictions and other factors. The amounts involved may be material.
Debt Covenants
Our Revolving Credit Facility contains financial and other covenants with which we must comply. Some of these covenants include:
•ratio of total debt to total asset value of not more than 0.60 to 1.00 (subject to a higher level following material acquisitions);
•ratio of adjusted EBITDA (earnings before noncontrolling interests, interest expense, income tax expense, depreciation, amortization, acquisition costs, and extraordinary, unusual or nonrecurring gains and losses) to fixed charges of not less than 1.50 to 1.00;
•ratio of secured indebtedness to total asset value of not more than 0.40 to 1.00;
•ratio of adjusted net operating income from unencumbered properties satisfying certain criteria specified in the amended and restated credit agreement (“Credit Agreement”) to interest expense on unsecured indebtedness of not less than 1.75 to 1.00; and
•ratio of unsecured indebtedness to the unencumbered pool value of properties satisfying certain criteria specified in, and valued per the terms of, the Credit Agreement of not more than 0.60 to 1.00 (subject to a higher level following material acquisitions).
Our unsecured notes contain covenants with which we must comply, including:
•A maximum ratio of 65.0% of total indebtedness to total assets;
•A maximum ratio of 40.0% of secured indebtedness to total assets;
•A minimum ratio of 1.50 of our income available for debt service payments to required debt service payments; and
•A minimum ratio of 1.50 of total unencumbered assets to total unsecured indebtedness.
Failure to comply with any of the covenants under our Revolving Credit Facility, unsecured notes or other debt instruments could result in a default under one or more of our debt covenants. This could cause our lenders to accelerate the timing of payments and could therefore have a material adverse effect on our business, operations, financial condition and liquidity. In addition, our ability to draw on our Revolving Credit Facility or incur other unsecured debt in the future could be restricted by the debt covenants.
As of June 30, 2020, we were in compliance with the covenants related to our Revolving Credit Facility and unsecured notes. We expect to be able to continue to comply with these ratios and covenants for the remainder of 2020, but no assurance can be given that we will be able to maintain compliance with these ratios and other debt covenants, particularly if conditions worsen.
Common Equity
We have authorized for issuance 100.0 million common shares, of which 82.3 million shares were outstanding at June 30, 2020.
On May 4, 2018, we entered into eight separate equity distribution agreements (collectively, the “Equity Distribution Agreements”) with each of Wells Fargo Securities, LLC, BNY Mellon Capital Markets, LLC, Capital One Securities, Inc., Citigroup Global Markets Inc., Goldman Sachs & Co. LLC, J.P. Morgan Securities LLC, KeyBanc Capital Markets Inc. and SunTrust Robinson Humphrey, Inc. relating to the issuance of up to $250.0 million of our common shares from time to time. Issuances of our common shares are made at market prices prevailing at the time of issuance. We may use net proceeds from the issuance of common shares under this program for general corporate purposes, including, without limitation, working capital, the acquisition, renovation, expansion, improvement, development or redevelopment of income producing properties or the repayment of debt. During the first quarter of 2020, we issued 46,500 shares under this program at a weighted average price of $31.07 for net proceeds of $1.2 million. We did not issue common shares under the Equity Distribution Agreements during the 2020 Quarter and 2019 Period.
We have a dividend reinvestment program, whereby shareholders may use their dividends and optional cash payments to purchase common shares. The common shares sold under this program may either be common shares issued by us or common shares purchased in the open market.
Our issuances and net proceeds on the dividend reinvestment program for the 2020 Quarter and 2019 Quarter and 2020 Period and 2019 Period were as follows (in thousands, except per share data):
| | | | | | | | | | | | | | | | | | | | | | | |
| Three Months Ended June 30, | | | | Six Months Ended June 30, | | |
| 2020 | | 2019 | | 2020 | | 2019 |
| Issuance of common shares | 6 | | | 21 | | | 41 | | | 64 | |
| Weighted average price per share | $ | 22.68 | | | $ | 26.97 | | | $ | 26.38 | | | $ | 26.23 | |
| Net proceeds | $ | 144 | | | $ | 576 | | | $ | 1,065 | | | $ | 1,673 | |
Preferred Equity
WashREIT’s board of trustees can, at its discretion, authorize the issuance of up to 10.0 million preferred shares. The ability to issue preferred equity provides WashREIT an additional financing tool that may be used to raise capital for future acquisitions or other business purposes. As of June 30, 2020, no preferred shares were issued or outstanding.
Historical Cash Flows
Cash flows from operations are an important factor in our ability to sustain our dividend at its current rate. If our cash flows from operations were to decline significantly from current levels, we may have to reduce our dividend. Consolidated cash flow information is summarized as follows (in thousands):
| | | | | | | | | | | | | | | | | | | | | | | |
| | Six Months Ended June 30, | | | | Change | | |
| | 2020 | | 2019 | | $ | | % |
| Net cash provided by operating activities | $ | 51,182 | | | $ | 60,543 | | | $ | (9,361) | | | (15.5) | % |
| Net cash provided by (used in) investing activities | 12,131 | | | (467,214) | | | 479,345 | | | 102.6 | % |
| Net cash (used in) provided by financing activities | (69,463) | | | 406,437 | | | (475,900) | | | (117.1) | % |
Net cash provided by operating activities decreased primarily due to the sales of the Retail Portfolio, Quantico Corporate Center and 1776 G Street during the 2019 Period.
Net cash provided by investing activities increased primarily due to the acquisition of the Assembly Portfolio during the 2019 Quarter.
Net cash used in financing activities increased primarily due to the prepayment of the 2020 Senior Notes during the 2020 Quarter and higher proceeds from the 2019 Term Loan in the 2019 Quarter, partially offset by higher net borrowings on the Revolving Credit Facility in the 2020 Period.
Off-Balance Sheet Arrangements
We have no off-balance sheet arrangements as of June 30, 2020 that are reasonably likely to have a current or future material effect on our financial condition, revenues or expenses, results of operations, liquidity, capital expenditures or capital resources.
Funds From Operations
NAREIT FFO is a widely used measure of operating performance for real estate companies. We provide NAREIT FFO as a supplemental measure to net income calculated in accordance with GAAP. Although NAREIT FFO is a widely used measure of operating performance for REITs, NAREIT FFO does not represent net income calculated in accordance with GAAP. As such, it should not be considered an alternative to net income as an indication of our operating performance. In addition, NAREIT FFO does not represent cash generated from operating activities in accordance with GAAP, nor does it represent cash available to pay distributions and should not be considered as an alternative to cash flow from operating activities, determined in accordance with GAAP, as a measure of our liquidity. NAREIT FFO is defined by the National Association of Real Estate Investment Trusts, Inc. (“NAREIT”) in its NAREIT FFO White Paper - 2018 Restatement as net income (computed in accordance with GAAP) excluding gains (or losses) associated with sales of properties; impairments of depreciable real estate, and real estate depreciation and amortization. We consider NAREIT FFO to be a standard supplemental measure for equity real estate investment trusts (REITs) because it facilitates an understanding of the operating performance of our properties without giving effect to real estate depreciation and amortization, which historically assumes that the value of real estate assets diminishes predictably over time. Since real estate values have instead historically risen or fallen with market conditions, we believe that NAREIT FFO more accurately provides investors an indication of our ability to incur and service debt, make capital expenditures and fund other needs. Our NAREIT FFO may not be comparable to FFO reported by other REITs. These other REITs may not define the term in accordance with the current NAREIT definition or may interpret the current NAREIT definition differently.
The following table provides the calculation of our NAREIT FFO and a reconciliation of NAREIT FFO to net income for the three and six months ended June 30, 2020 and 2019 (in thousands):
| | | | | | | | | | | | | | | | | | | | | | | |
| | Three Months Ended June 30, | | | | Six Months Ended June 30, | | |
| | 2020 | | 2019 | | 2020 | | 2019 |
| Net (loss) income | $ | (5,406) | | | $ | 987 | | | $ | (3,687) | | | $ | (3,418) | |
| Adjustments: | | | | | | | |
| Depreciation and amortization | 29,599 | | | 33,044 | | | 59,319 | | | 60,101 | |
| | | | | | | |
| Real estate impairment | — | | | — | | | — | | | 8,374 | |
| Loss on sale of depreciable real estate | 7,539 | | | 1,046 | | | 7,539 | | | 1,046 | |
| Discontinued operations: | | | | | | | |
| Depreciation and amortization | — | | | 2,377 | | | — | | | 4,867 | |
| | | | | | | |
| | | | | | | |
| | | | | | | |
| NAREIT FFO | $ | 31,732 | | | $ | 37,454 | | | $ | 63,171 | | | $ | 70,970 | |
Critical Accounting Policies and Estimates
We base the discussion and analysis of our financial condition and results of operations upon our consolidated financial statements, which have been prepared in accordance with accounting principles generally accepted in the United States. The preparation of these financial statements requires us to make estimates and judgments that affect the reported amounts of assets, liabilities, revenues and expenses. There were no changes made by management to the critical accounting policies in the three months ended June 30, 2020. We discuss the most critical estimates in our Annual Report on Form 10-K for the year ended December 31, 2019 filed with the SEC on February 19, 2020, as amended by Amendment No. 1 to the Annual Report on Form 10-K, filed on March 6, 2020.
ITEM 3: QUANTITATIVE AND QUALITATIVE DISCLOSURES ABOUT MARKET RISK
The principal material financial market risk to which we are exposed is interest rate risk. Our exposure to market risk for changes in interest rates relates primarily to refinancing long-term fixed rate obligations, the opportunity cost of fixed rate obligations in a falling interest rate environment and our variable rate line of credit. Following the prepayment of the Yale West mortgage note, we are no longer exposed to interest rate risk related to mortgages.
The table below presents principal, interest and related weighted average fair value interest rates by year of maturity, with respect to debt outstanding on June 30, 2020 (in thousands):
| | | | | | | | | | | | | | | | | | | | | | | | | | | | | | | | | | | | | | | | | | | | | | | |
| 2020 | | 2021 | | 2022 | | 2023 | | 2024 | | Thereafter | | Total | | Fair Value |
Unsecured fixed rate debt (1)(2) | | | | | | | | | | | | | | | |
Principal (3) | $ | — | | | $ | 150,000 | | | $ | 450,000 | | | $ | 250,000 | | | $ | — | | | $ | 50,000 | | | $ | 900,000 | | | $ | 919,929 | |
| Interest payments | $ | 14,864 | | | $ | 26,665 | | | $ | 23,894 | | | $ | 7,807 | | | $ | 3,625 | | | $ | 12,688 | | | $ | 89,543 | | | |
| Interest rate on debt maturities | — | % | | 2.7 | % | | 3.3 | % | | 2.9 | % | | — | % | | 7.3 | % | | 3.0 | % | | |
Unsecured variable rate debt (4) | | | | | | | | | | | | | | | |
| Principal | $ | — | | | $ | — | | | $ | — | | | $ | 181,000 | | | $ | — | | | $ | — | | | $ | 181,000 | | | $ | 181,000 | |
| Variable interest rate on debt maturities | | | | | | | 1.2 | % | | | | | | 1.2 | % | | |
______________________________
(1) Includes $150.0 million and $250.0 million term loans with floating interest rates. The interest rates on the $150.0 million and $250.0 million term loans are effectively fixed by interest rate swap arrangements at 2.7% and 2.9%, respectively.
(2) Maturity date for the $150.0 million term loan of May 2022 assumes election of option for an additional one-year period.
(3) In April 2020, WashREIT prepaid without penalty the $250.0 million of 4.95% Senior Notes that were scheduled to mature in October 2020 using borrowings on our Revolving Credit Facility.
(4) Maturity date on the unsecured credit facility of 2023 assumes the election of two additional six-month options.
We enter into interest rate swap arrangements designated and qualifying as cash flow hedges to reduce our exposure to the variability in future cash flows attributable to changes in interest rates. Derivative instruments expose us to credit risk in the event of non-performance by the counterparty under the terms of the interest rate hedge agreement. We believe that we minimize our credit risk on these transactions by dealing with major, creditworthy financial institutions. As part of our ongoing control procedures, we monitor the credit ratings of counterparties and our exposure to any single entity, thus minimizing our credit risk concentration.
The following table sets forth information pertaining to interest rate swap contracts in place as of June 30, 2020 and December 31, 2019 and their respective fair values (in thousands):
| | | | | | | | | | | | | | | | | | | | | | | | | | | | | | | | | | | | | | |
| Notional Amount | | | | Floating Index Rate | | | | | | Fair Value as of: | | |
| | Fixed Rate | | | | Effective Date | | Expiration Date | | June 30, 2020 | | December 31, 2019 |
| $ | 75,000 | | | 1.619% | | One-Month USD-LIBOR | | 10/15/2015 | | 3/15/2021 | | $ | (775) | | | $ | (28) | |
| 75,000 | | | 1.626% | | One-Month USD-LIBOR | | 10/15/2015 | | 3/15/2021 | | (778) | | | (34) | |
| 100,000 | | | 1.205% | | One-Month USD-LIBOR | | 3/31/2017 | | 7/21/2023 | | (3,247) | | | 1,218 | |
| 50,000 | | | 1.208% | | One-Month USD-LIBOR | | 3/31/2017 | | 7/21/2023 | | (1,627) | | | 607 | |
| 25,000 | | | 2.610% | | One-Month USD-LIBOR | | 6/29/2018 | | 7/21/2023 | | (1,876) | | | (917) | |
| 25,000 | | | 2.610% | | One-Month USD-LIBOR | | 6/29/2018 | | 7/21/2023 | | (1,876) | | | (915) | |
| 25,000 | | | 2.610% | | One-Month USD-LIBOR | | 6/29/2018 | | 7/21/2023 | | (1,876) | | | (917) | |
| 25,000 | | | 2.610% | | One-Month USD-LIBOR | | 6/29/2018 | | 7/21/2023 | | (1,876) | | | (915) | |
| 50,000 | | | 1.680% | | Three-Month USD-LIBOR | | 4/1/2020 | | 4/1/2030 | | (5,242) | | | 844 | |
| 50,000 | | | 1.680% | | Three-Month USD-LIBOR | | 4/1/2020 | | 4/1/2030 | | (5,242) | | | 844 | |
| 50,000 | | | 1.718% | | Three-Month USD-LIBOR | | 4/1/2020 | | 4/1/2030 | | (5,059) | | | 1,018 | |
| 50,000 | | | 1.718% | | Three-Month USD-LIBOR | | 4/1/2020 | | 4/1/2030 | | (5,059) | | | 1,018 | |
| $ | 600,000 | | | | | | | | | | | $ | (34,533) | | | $ | 1,823 | |
We enter into debt obligations primarily to support general corporate purposes including acquisition of real estate properties, capital improvements and working capital needs.
As the majority of our outstanding debt is long-term, fixed rate debt, other than the prepayment of the Yale West mortgage note that eliminated our exposure to interest rate risk in connection with mortgages, our interest rate risk has not changed significantly from what was disclosed in our Annual Report on Form 10-K for the year ended December 31, 2019 filed with the SEC on February 19, 2020, as amended by Amendment No. 1 to the Annual Report on Form 10-K, filed on March 6, 2020. See “Management’s Discussion and Analysis of Financial Condition and Results of Operations – Liquidity and Capital Resources – Debt Financing.”
ITEM 4: CONTROLS AND PROCEDURES
We maintain disclosure controls and procedures that are designed to ensure that information required to be disclosed in our Securities Exchange Act reports is recorded, processed, summarized and reported within the time periods specified in the SEC’s rules and forms, and that such information is accumulated and communicated to our management, including our Chief Executive Officer, Chief Financial Officer and Chief Accounting Officer, as appropriate, to allow timely decisions regarding required disclosure. In designing and evaluating the disclosure controls and procedures, management recognized that any controls and procedures, no matter how well designed and operated, can provide only reasonable assurance of achieving the desired control objectives, and management necessarily was required to apply its judgment in evaluating the cost-benefit relationship of possible controls and procedures.
We carried out an evaluation, under the supervision and with the participation of our management, including our Chief Executive Officer, Chief Financial Officer and Chief Accounting Officer, of the effectiveness of the design and operation of our disclosure controls and procedures as of the end of the period covered by this report. Based on the foregoing, our Chief Executive Officer, Chief Financial Officer and Chief Accounting Officer concluded that our disclosure controls and procedures were effective at the reasonable assurance level.
There have not been any changes in WashREIT’s internal control over financial reporting (as defined by Rule 13a-15(f)) that occurred during the period covered by the report that have materially affected, or are reasonably likely to materially affect, WashREIT’s internal control over financial reporting.
PART II
OTHER INFORMATION
ITEM 1: LEGAL PROCEEDINGS
None.
ITEM 1A: RISK FACTORS
Other than as noted below, there have been no material changes from the risk factors previously disclosed in response to “Part I - Item 1A. Risk Factors” of our Annual Report on Form 10-K for the year ended December 31, 2019, as amended by Amendment No. 1 to the Annual Report on Form 10-K, filed on March 6, 2020.
Risks Related to COVID-19
The current outbreak of the novel coronavirus (COVID-19), and the resulting volatility it has created, has disrupted our business and we expect that the COVID-19 pandemic, will significantly and adversely impact our business, financial condition and results of operations going forward, and that other potential pandemics or outbreaks, could materially adversely affect our business, financial condition, results of operations and cash flows in the future. Further, the spread of the COVID-19 outbreak has caused severe disruptions in the U.S. and global economy and financial markets and could potentially create widespread business continuity issues of an unknown magnitude and duration.
Since being reported in December 2019, COVID-19 has spread globally, including to every state in the United States. On March 11, 2020, the World Health Organization declared COVID-19 a pandemic, and on March 13, 2020, the United States declared a national emergency with respect to COVID-19.
The COVID-19 pandemic has had and continues to have, and another pandemic in the future could have, repercussions across regional and global economies and financial markets. The global impact of the outbreak has been rapidly evolving and many countries, including the United States (including the states and cities that comprise the Washington metro region, where we own properties and have development sites) have also instituted quarantines, "shelter in place" rules, and restrictions on travel, the types of business that may continue to operate, and/or the types of construction projects that may continue. As a result, the COVID-19 pandemic is negatively impacting almost every industry, both inside and outside the Washington metro region, directly or indirectly. A number of our commercial tenants have announced temporary closures of their offices or stores and requested rent deferral or rent abatement during this pandemic. In addition, jurisdictions in the Washington metro region have implemented or may implement rent freezes or other similar restrictions. The full extent of the impacts on our business are largely uncertain and dependent on a number of factors beyond our control, including a potential increase in the number of cases in the Washington metro region.
The COVID-19 outbreak has caused and continues to cause severe disruptions in the U.S. and global economy and financial markets and could potentially create widespread business continuity issues of an as yet unknown magnitude and duration. COVID-19 has disrupted our business and is expected to continue to have a significant adverse effect on our business, financial performance and condition, operating results and cash flows due to, among other factors:
•a decrease in real estate rental revenue (our primary source of operating cash flow), as a result of temporary rent freezes impacting new and renewal rental rates on multifamily properties, longer lease-up periods for both anticipated and unanticipated vacancies, including as a result of a shift from physical to virtual tours, lower revenue recognized as a result of waiving late fees and a reduction in parking revenue, as well as our tenants’ ability and willingness to pay rent, our ability to continue to collect rents, on a timely basis or at all (for example, 3% of cash rents in our office portfolio, 28% of cash rents in our retail portfolio and 1% of cash rents in our multifamily portfolio were uncollected during the 2020 Quarter, as of July 22, 2020), and increased credit losses;
•a complete or partial closure of one or more of our properties resulting from government or tenant action (as of July 27, 2020, our commercial properties are operating on a limited basis pursuant to local government orders, except for essential businesses);
•reductions in demand for commercial space in the Washington, D.C. metropolitan area and the inability to provide physical tours of either our commercial and multifamily spaces may result in our inability to renew leases, re-lease space as leases expire, or lease vacant space, particularly without concessions, or a decline in rental rates on new leases, particularly at our retail assets (approximately 5% of our office leases and 2% of our other leases are scheduled to expire in 2020);
•the inability of one or more major tenants to pay rent, or the bankruptcy or insolvency of one or more major tenants, due to a downturn in its business or a weakening of its financial condition related to the pandemic;
•the inability to decrease certain fixed expenses at our properties despite decreased operations at such properties;
•the inability of our third-party service providers to adequately perform their property management and/or leasing activities at our properties due to decreased on-site staff;
•difficulty accessing debt and equity capital on attractive terms, or at all, and a severe disruption and instability in the global financial markets or deterioration in credit and financing conditions, which may affect our access to capital and our commercial tenants' ability to fund their business operations and meet their obligations to us;
•the financial impact of the COVID-19 pandemic could negatively impact our future compliance with financial covenants of debt agreements;
•a decline in the market value of real estate in the Washington, D.C. region may result in the carrying value of certain real estate assets exceeding their fair value, which may require us to recognize an impairment to those assets;
•future delays in the supply of products or services may negatively impact our ability to complete the development, redevelopment, renovations and lease-up of our buildings on schedule or for their original estimated cost;
•loss of cash balances that we periodically invest in a variety of short-term investments in order to preserve principal and maintain a high degree of liquidity while providing current income could result in a lower level of liquidity;
•a general decline in business activity and demand for real estate transactions could adversely affect our ability or desire to grow or change the complexion of our portfolio of properties;
•our insurance may not cover loss of revenue or other expenses resulting from the pandemic and related shelter-in-place rules;
•unanticipated costs and operating expenses and decreased anticipated revenue related to compliance with regulations, such as additional expenses related to staff working remotely, requirements to provide employees with additional mandatory paid time off and increased expenses related to sanitation measures performed at each of our properties, as well as additional expenses incurred to protect the welfare of our employees, such as expanded access to health services;
•the potential for one or more members of our senior management team to become sick with COVID-19 and the loss of such services could adversely affect our business
•the increased vulnerability to cyber-attacks or cyber intrusions while employees are working remotely has the potential to disrupt our operations or cause material harm to our financial condition; and
•complying with REIT requirements during a period of reduced cash flow could cause us to liquidate otherwise attractive investments or borrow funds on unfavorable conditions.
The significance, extent and duration of the impact of COVID-19 remains largely uncertain and dependent on future developments that cannot be accurately predicted at this time, such as a potential increase in cases in the Washington metro region, the continued severity, duration, transmission rate and geographic spread of COVID-19, the extent and effectiveness of the containment measures taken, and the response of the overall economy, the financial markets and the population, particularly in the Washington metro region, once the current containment measures are lifted.
The rapid development and volatility of this situation precludes us from making any prediction as to the ultimate adverse impact of COVID-19. As a result, we cannot provide an estimate of the overall impact of the COVID-19 pandemic on our business or when, or if, we will be able to resume normal operations. Nevertheless, COVID-19 presents material uncertainty and risk with respect to our business, financial performance and condition, operating results and cash flows.
ITEM 2: UNREGISTERED SALES OF EQUITY SECURITIES AND USE OF PROCEEDS
None.
ITEM 3: DEFAULTS UPON SENIOR SECURITIES
None.
ITEM 4: MINE SAFETY DISCLOSURES
None.
ITEM 5: OTHER INFORMATION
None.
ITEM 6: EXHIBITS
| | | | | | | | | | | | | | | | | | | | | | | | | | | | | | | | | | | |
| | | | Incorporated by Reference | | | | | | | | |
Exhibit
Number | Exhibit Description | | Form | | File
Number | | Exhibit | | Filing Date | | Filed
Herewith |
| 31.1 | | | | | | | | | | | X |
| 31.2 | | | | | | | | | | | X |
| 31.3 | | | | | | | | | | | X |
| 32 | | | | | | | | | | | X |
| 101.INS | XBRL Instance Document - the instance document does not appear in the Interactive Data File because its XBRL tags are embedded within the Inline XBRL document. | | | | | | | | | | X |
| 101.SCH | Inline XBRL Taxonomy Extension Schema Document | | | | | | | | | | X |
| 101.CAL | Inline XBRL Taxonomy Extension Calculation Linkbase Document | | | | | | | | | | X |
| 101.DEF | Inline XBRL Taxonomy Extension Definition Linkbase Document | | | | | | | | | | X |
| 101.LAB | Inline XBRL Taxonomy Extension Label Linkbase Document | | | | | | | | | | X |
| 101.PRE | Inline XBRL Taxonomy Extension Presentation Linkbase Document | | | | | | | | | | X |
| 104 | Cover Page Interactive Data File (embedded within the Inline XBRL document and contained in Exhibit 101) | | | | | | | | | | |
SIGNATURES
Pursuant to the requirements of the Securities Exchange Act of 1934, the registrant has duly caused this report to be signed on its behalf by the undersigned, thereunto duly authorized.
| | | | | | | | |
| WASHINGTON REAL ESTATE INVESTMENT TRUST | | |
| | |
| | /s/ Paul T. McDermott |
| | Paul T. McDermott |
| | President and Chief Executive Officer |
| | |
| | /s/ Stephen E. Riffee |
| | Stephen E. Riffee |
| | Executive Vice President and Chief Financial Officer
(Principal Financial Officer) |
| | |
| | /s/ W. Drew Hammond |
| | W. Drew Hammond |
| | Vice President, Chief Accounting Officer and Treasurer
(Principal Accounting Officer) |
DATE: July 29, 2020