00001048942020FYfalseus-gaap:RealEstateMemberus-gaap:RealEstateMemberus-gaap:RealEstateMemberus-gaap:RealEstateMemberus-gaap:RealEstateMemberus-gaap:RealEstateMemberus-gaap:RentalPropertiesus-gaap:AccountsPayableAndAccruedLiabilitiesCurrentAndNoncurrentus-gaap:AccountsPayableAndAccruedLiabilitiesCurrentAndNoncurrent0.333300001048942020-01-012020-12-31iso4217:USD00001048942020-06-30xbrli:shares00001048942021-02-1100001048942020-12-3100001048942019-12-31iso4217:USDxbrli:shares00001048942019-01-012019-12-3100001048942018-01-012018-12-310000104894us-gaap:CommonStockMember2017-12-310000104894us-gaap:AdditionalPaidInCapitalMember2017-12-310000104894us-gaap:AccumulatedDistributionsInExcessOfNetIncomeMember2017-12-310000104894us-gaap:AccumulatedOtherComprehensiveIncomeMember2017-12-310000104894us-gaap:ParentMember2017-12-310000104894us-gaap:NoncontrollingInterestMember2017-12-3100001048942017-12-310000104894us-gaap:AccumulatedDistributionsInExcessOfNetIncomeMember2018-01-012018-12-310000104894us-gaap:ParentMember2018-01-012018-12-310000104894us-gaap:AccumulatedOtherComprehensiveIncomeMember2018-01-012018-12-310000104894us-gaap:NoncontrollingInterestMember2018-01-012018-12-310000104894us-gaap:CommonStockMember2018-01-012018-12-310000104894us-gaap:AdditionalPaidInCapitalMember2018-01-012018-12-310000104894us-gaap:CommonStockMember2018-12-310000104894us-gaap:AdditionalPaidInCapitalMember2018-12-310000104894us-gaap:AccumulatedDistributionsInExcessOfNetIncomeMember2018-12-310000104894us-gaap:AccumulatedOtherComprehensiveIncomeMember2018-12-310000104894us-gaap:ParentMember2018-12-310000104894us-gaap:NoncontrollingInterestMember2018-12-3100001048942018-12-310000104894us-gaap:AccumulatedDistributionsInExcessOfNetIncomeMembersrt:CumulativeEffectPeriodOfAdoptionAdjustmentMember2018-12-310000104894us-gaap:ParentMembersrt:CumulativeEffectPeriodOfAdoptionAdjustmentMember2018-12-310000104894srt:CumulativeEffectPeriodOfAdoptionAdjustmentMember2018-12-310000104894us-gaap:AccumulatedDistributionsInExcessOfNetIncomeMember2019-01-012019-12-310000104894us-gaap:ParentMember2019-01-012019-12-310000104894us-gaap:AccumulatedOtherComprehensiveIncomeMember2019-01-012019-12-310000104894us-gaap:NoncontrollingInterestMember2019-01-012019-12-310000104894us-gaap:CommonStockMember2019-01-012019-12-310000104894us-gaap:AdditionalPaidInCapitalMember2019-01-012019-12-310000104894us-gaap:CommonStockMember2019-12-310000104894us-gaap:AdditionalPaidInCapitalMember2019-12-310000104894us-gaap:AccumulatedDistributionsInExcessOfNetIncomeMember2019-12-310000104894us-gaap:AccumulatedOtherComprehensiveIncomeMember2019-12-310000104894us-gaap:ParentMember2019-12-310000104894us-gaap:NoncontrollingInterestMember2019-12-310000104894us-gaap:AccumulatedDistributionsInExcessOfNetIncomeMember2020-01-012020-12-310000104894us-gaap:ParentMember2020-01-012020-12-310000104894us-gaap:AccumulatedOtherComprehensiveIncomeMember2020-01-012020-12-310000104894us-gaap:NoncontrollingInterestMember2020-01-012020-12-310000104894us-gaap:CommonStockMember2020-01-012020-12-310000104894us-gaap:AdditionalPaidInCapitalMember2020-01-012020-12-310000104894us-gaap:CommonStockMember2020-12-310000104894us-gaap:AdditionalPaidInCapitalMember2020-12-310000104894us-gaap:AccumulatedDistributionsInExcessOfNetIncomeMember2020-12-310000104894us-gaap:AccumulatedOtherComprehensiveIncomeMember2020-12-310000104894us-gaap:ParentMember2020-12-310000104894us-gaap:NoncontrollingInterestMember2020-12-310000104894wre:TwoThousandTwentyPropertiesSoldGroupMembersrt:OfficeBuildingMemberus-gaap:DisposalGroupDisposedOfBySaleNotDiscontinuedOperationsMemberwre:JohnMarshallIiMember2020-04-212020-04-210000104894wre:TwoThousandTwentyPropertiesSoldGroupMembersrt:OfficeBuildingMemberus-gaap:DisposalGroupDisposedOfBySaleNotDiscontinuedOperationsMemberwre:MonumentIiMember2020-12-022020-12-020000104894wre:A122725ThStreetMemberwre:TwoThousandTwentyPropertiesSoldGroupMembersrt:OfficeBuildingMemberus-gaap:DisposalGroupDisposedOfBySaleNotDiscontinuedOperationsMember2020-12-172020-12-170000104894wre:TwoThousandTwentyPropertiesSoldGroupMember2020-01-012020-12-310000104894wre:TwoThousandNineteenPropertiesSoldGroupMembersrt:OfficeBuildingMemberwre:QuanticoCorporateCenterMemberus-gaap:DisposalGroupDisposedOfBySaleNotDiscontinuedOperationsMember2019-06-262019-06-260000104894wre:TwoThousandNineteenPropertiesSoldGroupMemberus-gaap:DiscontinuedOperationsHeldForSaleOrDisposedOfBySaleMemberwre:ShoppingCenterPortfolioMembersrt:RetailSiteMember2019-07-232019-07-230000104894wre:TwoThousandNineteenPropertiesSoldGroupMemberus-gaap:DiscontinuedOperationsHeldForSaleOrDisposedOfBySaleMembersrt:RetailSiteMemberwre:FrederickCrossingAndFrederickCountySquareMember2019-08-212019-08-210000104894wre:TwoThousandNineteenPropertiesSoldGroupMemberus-gaap:DiscontinuedOperationsHeldForSaleOrDisposedOfBySaleMemberwre:CentreatHagerstownMembersrt:RetailSiteMember2019-08-272019-08-270000104894wre:TwoThousandNineteenPropertiesSoldGroupMembersrt:OfficeBuildingMemberwre:A1776GStreetMemberus-gaap:DisposalGroupDisposedOfBySaleNotDiscontinuedOperationsMember2019-12-192019-12-190000104894wre:TwoThousandNineteenPropertiesSoldGroupMember2019-01-012019-12-310000104894wre:BraddockMetroCenterMembersrt:OfficeBuildingMemberus-gaap:DisposalGroupDisposedOfBySaleNotDiscontinuedOperationsMemberwre:TwoThousandEighteenPropertiesSoldGroupMember2018-01-192018-01-190000104894srt:OfficeBuildingMemberwre:MStreet2445Memberus-gaap:DisposalGroupDisposedOfBySaleNotDiscontinuedOperationsMemberwre:TwoThousandEighteenPropertiesSoldGroupMember2018-06-282018-06-280000104894wre:TwoThousandEighteenPropertiesSoldGroupMember2018-01-012018-12-31wre:property0000104894wre:TaxableReitSubsidiaryMember2019-12-310000104894wre:TaxableReitSubsidiaryMember2020-12-31xbrli:pure0000104894srt:MultifamilyMember2020-12-310000104894wre:OfficeBuildingAndRetailSiteMember2020-12-310000104894us-gaap:AccumulatedDistributionsInExcessOfNetIncomeMemberus-gaap:AccountingStandardsUpdate201602Membersrt:CumulativeEffectPeriodOfAdoptionAdjustmentMember2018-12-310000104894srt:MinimumMemberus-gaap:BuildingMember2020-01-012020-12-310000104894srt:MaximumMemberus-gaap:BuildingMember2020-01-012020-12-310000104894us-gaap:BuildingImprovementsMembersrt:MinimumMember2020-01-012020-12-310000104894srt:MaximumMemberus-gaap:BuildingImprovementsMember2020-01-012020-12-310000104894srt:MultifamilyMember2019-12-310000104894srt:OfficeBuildingMember2020-12-310000104894srt:OfficeBuildingMember2019-12-310000104894srt:OtherPropertyMember2020-12-310000104894srt:OtherPropertyMember2019-12-310000104894wre:TheTroveMember2020-12-31wre:unit0000104894wre:TheTroveMember2020-01-012020-12-310000104894wre:RiversideDevelopmentsMember2020-12-310000104894srt:MultifamilyMemberwre:AcquisitionGroup2019Memberwre:AssemblyPortfolioVirginiaMember2019-04-300000104894srt:MultifamilyMemberwre:AcquisitionGroup2019Memberwre:AssemblyPortfolioVirginiaMember2019-04-302019-04-300000104894srt:MultifamilyMemberwre:AssemblyPortfolioMarylandMemberwre:AcquisitionGroup2019Member2019-06-270000104894srt:MultifamilyMemberwre:AssemblyPortfolioMarylandMemberwre:AcquisitionGroup2019Member2019-06-272019-06-270000104894srt:MultifamilyMemberwre:CascadeAtLandmarkMemberwre:AcquisitionGroup2019Member2019-07-230000104894srt:MultifamilyMemberwre:CascadeAtLandmarkMemberwre:AcquisitionGroup2019Member2019-07-232019-07-230000104894wre:AcquisitionGroup2019Member2019-12-310000104894wre:AcquisitionGroup2019Member2019-01-012019-12-31utr:sqft0000104894srt:OfficeBuildingMemberwre:ArlingtonTowerMemberwre:AcquisitionGroup2018Member2018-01-180000104894srt:OfficeBuildingMemberwre:ArlingtonTowerMemberwre:AcquisitionGroup2018Member2018-01-182018-01-180000104894wre:AcquisitionGroup2018Member2018-01-012018-12-310000104894us-gaap:LandMemberwre:AcquisitionGroup2019Member2019-01-012019-12-310000104894us-gaap:LandMemberwre:AcquisitionGroup2018Member2018-01-012018-12-310000104894us-gaap:BuildingAndBuildingImprovementsMemberwre:AcquisitionGroup2019Member2019-01-012019-12-310000104894wre:AcquisitionGroup2018Memberus-gaap:BuildingAndBuildingImprovementsMember2018-01-012018-12-310000104894wre:TenantOriginationCostsMemberwre:AcquisitionGroup2019Member2019-01-012019-12-310000104894wre:TenantOriginationCostsMemberwre:AcquisitionGroup2018Member2018-01-012018-12-310000104894wre:LeasingCommissionsAbsorptionCostsMemberwre:AcquisitionGroup2019Member2019-01-012019-12-310000104894wre:AcquisitionGroup2018Memberwre:LeasingCommissionsAbsorptionCostsMember2018-01-012018-12-310000104894wre:NetLeaseIntangibleAssetsMemberwre:AcquisitionGroup2019Member2019-01-012019-12-310000104894wre:NetLeaseIntangibleAssetsMemberwre:AcquisitionGroup2018Member2018-01-012018-12-310000104894wre:ArlingtonTowerMember2018-01-012018-12-310000104894wre:TenantOriginationCostsMember2020-12-310000104894wre:TenantOriginationCostsMember2019-12-310000104894wre:LeasingCommissionsAbsorptionCostsMember2020-12-310000104894wre:LeasingCommissionsAbsorptionCostsMember2019-12-310000104894wre:NetLeaseIntangibleAssetsMember2020-12-310000104894wre:NetLeaseIntangibleAssetsMember2019-12-310000104894wre:NetLeaseIntangibleLiabilitiesMember2020-12-310000104894wre:NetLeaseIntangibleLiabilitiesMember2019-12-310000104894wre:LeasesAcquiredInPlaceBelowMarketGroundLeaseMember2020-12-310000104894wre:LeasesAcquiredInPlaceBelowMarketGroundLeaseMember2019-12-310000104894us-gaap:LeasesAcquiredInPlaceMember2020-01-012020-12-310000104894us-gaap:LeasesAcquiredInPlaceMember2019-01-012019-12-310000104894us-gaap:LeasesAcquiredInPlaceMember2018-01-012018-12-310000104894us-gaap:LeasesAcquiredInPlaceMember2020-12-310000104894wre:TwoThousandTwentyPropertiesSoldGroupMembersrt:OfficeBuildingMemberus-gaap:DisposalGroupDisposedOfBySaleNotDiscontinuedOperationsMemberwre:JohnMarshallIiMember2020-04-210000104894wre:TwoThousandTwentyPropertiesSoldGroupMembersrt:OfficeBuildingMemberus-gaap:DisposalGroupDisposedOfBySaleNotDiscontinuedOperationsMemberwre:MonumentIiMember2020-12-020000104894wre:A122725ThStreetMemberwre:TwoThousandTwentyPropertiesSoldGroupMembersrt:OfficeBuildingMemberus-gaap:DisposalGroupDisposedOfBySaleNotDiscontinuedOperationsMember2020-12-170000104894wre:TwoThousandTwentyPropertiesSoldGroupMember2020-12-310000104894wre:TwoThousandNineteenPropertiesSoldGroupMembersrt:OfficeBuildingMemberwre:QuanticoCorporateCenterMemberus-gaap:DisposalGroupDisposedOfBySaleNotDiscontinuedOperationsMember2019-06-260000104894wre:TwoThousandNineteenPropertiesSoldGroupMemberus-gaap:DiscontinuedOperationsHeldForSaleOrDisposedOfBySaleMemberwre:ShoppingCenterPortfolioMembersrt:RetailSiteMember2019-07-230000104894wre:TwoThousandNineteenPropertiesSoldGroupMemberus-gaap:DiscontinuedOperationsHeldForSaleOrDisposedOfBySaleMembersrt:RetailSiteMemberwre:FrederickCrossingAndFrederickCountySquareMember2019-08-210000104894wre:TwoThousandNineteenPropertiesSoldGroupMemberus-gaap:DiscontinuedOperationsHeldForSaleOrDisposedOfBySaleMemberwre:CentreatHagerstownMembersrt:RetailSiteMember2019-08-270000104894wre:TwoThousandNineteenPropertiesSoldGroupMembersrt:OfficeBuildingMemberwre:A1776GStreetMemberus-gaap:DisposalGroupDisposedOfBySaleNotDiscontinuedOperationsMember2019-12-190000104894wre:TwoThousandNineteenPropertiesSoldGroupMember2019-12-310000104894wre:BraddockMetroCenterMembersrt:OfficeBuildingMemberus-gaap:DisposalGroupDisposedOfBySaleNotDiscontinuedOperationsMemberwre:TwoThousandEighteenPropertiesSoldGroupMember2018-01-190000104894srt:OfficeBuildingMemberwre:MStreet2445Memberus-gaap:DisposalGroupDisposedOfBySaleNotDiscontinuedOperationsMemberwre:TwoThousandEighteenPropertiesSoldGroupMember2018-06-280000104894wre:TwoThousandEighteenPropertiesSoldGroupMember2018-12-310000104894wre:TwoThousandTwentyPropertiesSoldGroupMembersrt:OfficeBuildingMemberus-gaap:DisposalGroupDisposedOfBySaleNotDiscontinuedOperationsMemberwre:JohnMarshallIiMember2019-12-31wre:building0000104894wre:TwoThousandNineteenPropertiesSoldGroupMembersrt:OfficeBuildingMemberwre:QuanticoCorporateCenterMemberus-gaap:DisposalGroupDisposedOfBySaleNotDiscontinuedOperationsMember2019-01-012019-03-31wre:agreement0000104894wre:ShoppingCenterPortfolioAndPowerCenterPortfolioMember2019-06-012019-06-30wre:buyer0000104894wre:TwoThousandNineteenPropertiesSoldGroupMemberus-gaap:DiscontinuedOperationsHeldForSaleOrDisposedOfBySaleMember2019-07-012019-09-300000104894wre:BraddockMetroCenterMembersrt:OfficeBuildingMemberus-gaap:DisposalGroupDisposedOfBySaleNotDiscontinuedOperationsMemberwre:TwoThousandEighteenPropertiesSoldGroupMember2017-01-012017-12-310000104894srt:OfficeBuildingMemberwre:MStreet2445Memberus-gaap:DisposalGroupDisposedOfBySaleNotDiscontinuedOperationsMemberwre:TwoThousandEighteenPropertiesSoldGroupMember2018-03-310000104894srt:OfficeBuildingMemberwre:MStreet2445Memberus-gaap:DisposalGroupDisposedOfBySaleNotDiscontinuedOperationsMemberwre:TwoThousandEighteenPropertiesSoldGroupMember2017-01-012017-12-310000104894srt:OfficeBuildingMemberwre:MStreet2445Memberus-gaap:DisposalGroupDisposedOfBySaleNotDiscontinuedOperationsMemberwre:TwoThousandEighteenPropertiesSoldGroupMember2018-01-012018-03-310000104894us-gaap:DiscontinuedOperationsHeldForSaleOrDisposedOfBySaleMemberwre:RetailPortfolioMember2019-01-012019-12-310000104894us-gaap:DiscontinuedOperationsHeldForSaleOrDisposedOfBySaleMemberwre:RetailPortfolioMember2018-01-012018-12-3100001048942019-01-010000104894wre:YaleWestMemberus-gaap:MortgagesMember2020-01-012020-01-310000104894us-gaap:MortgagesMember2020-12-31wre:debt_instrument0000104894us-gaap:MortgagesMember2019-12-310000104894wre:YaleWestMemberus-gaap:MortgagesMember2019-12-310000104894us-gaap:LineOfCreditMember2020-01-012020-12-310000104894us-gaap:RevolvingCreditFacilityMember2018-03-310000104894us-gaap:LoansPayableMemberwre:A2015TermLoanMember2018-03-310000104894wre:A2018TermLoanMemberus-gaap:LoansPayableMember2018-03-310000104894us-gaap:RevolvingCreditFacilityMember2018-01-012018-03-31wre:extension_option0000104894wre:CreditAgreementAmendedAndRestatedMember2018-03-310000104894us-gaap:LoansPayableMemberwre:A2016TermLoanMember2017-12-310000104894us-gaap:LondonInterbankOfferedRateLIBORMemberwre:A2018TermLoanMemberus-gaap:LoansPayableMembersrt:MinimumMember2020-01-012020-12-310000104894us-gaap:LondonInterbankOfferedRateLIBORMemberwre:A2018TermLoanMembersrt:MaximumMemberus-gaap:LoansPayableMember2020-01-012020-12-310000104894wre:A2018TermLoanMemberus-gaap:BaseRateMemberus-gaap:LoansPayableMembersrt:MinimumMember2020-01-012020-12-310000104894wre:A2018TermLoanMembersrt:MaximumMemberus-gaap:BaseRateMemberus-gaap:LoansPayableMember2020-01-012020-12-310000104894wre:A2018TermLoanAMemberus-gaap:InterestRateSwapMember2020-12-310000104894us-gaap:InterestRateSwapMemberwre:A2018TermLoanBMember2020-12-310000104894wre:A2018TermLoanMemberus-gaap:LoansPayableMember2020-12-310000104894us-gaap:RevolvingCreditFacilityMember2020-12-310000104894us-gaap:RevolvingCreditFacilityMember2019-12-310000104894us-gaap:RevolvingCreditFacilityMember2020-01-012020-12-310000104894us-gaap:LondonInterbankOfferedRateLIBORMembersrt:MinimumMemberus-gaap:RevolvingCreditFacilityMember2020-01-012020-12-310000104894us-gaap:LondonInterbankOfferedRateLIBORMembersrt:MaximumMemberus-gaap:RevolvingCreditFacilityMember2020-01-012020-12-310000104894us-gaap:BaseRateMembersrt:MinimumMemberus-gaap:RevolvingCreditFacilityMember2020-01-012020-12-310000104894srt:MaximumMemberus-gaap:BaseRateMemberus-gaap:RevolvingCreditFacilityMember2020-01-012020-12-310000104894us-gaap:FederalFundsEffectiveSwapRateMemberus-gaap:RevolvingCreditFacilityMember2020-01-012020-12-310000104894us-gaap:LondonInterbankOfferedRateLIBORMemberus-gaap:RevolvingCreditFacilityMember2020-01-012020-12-310000104894srt:MinimumMemberus-gaap:RevolvingCreditFacilityMember2020-01-012020-12-310000104894srt:MaximumMemberus-gaap:RevolvingCreditFacilityMember2020-01-012020-12-310000104894us-gaap:LondonInterbankOfferedRateLIBORMemberus-gaap:RevolvingCreditFacilityMember2020-12-312020-12-310000104894us-gaap:RevolvingCreditFacilityMember2020-12-312020-12-310000104894us-gaap:NotesPayableOtherPayablesMember2020-01-012020-12-310000104894wre:A10YearUnsecuredNotes5053Memberus-gaap:UnsecuredDebtMember2020-12-310000104894wre:A10YearUnsecuredNotes5053Memberus-gaap:UnsecuredDebtMember2019-12-310000104894wre:A10YearUnsecuredNotes5053Memberus-gaap:UnsecuredDebtMember2020-01-012020-12-310000104894us-gaap:LondonInterbankOfferedRateLIBORMemberwre:A2015TermLoanMemberus-gaap:UnsecuredDebtMember2020-01-012020-12-310000104894wre:A2015TermLoanMemberus-gaap:UnsecuredDebtMember2020-12-310000104894wre:A2015TermLoanMemberus-gaap:UnsecuredDebtMember2019-12-310000104894wre:A2015TermLoanMemberus-gaap:UnsecuredDebtMember2020-01-012020-12-310000104894wre:ThreePointNineFivePercentUnsecuredNotesMemberus-gaap:UnsecuredDebtMember2020-12-310000104894wre:ThreePointNineFivePercentUnsecuredNotesMemberus-gaap:UnsecuredDebtMember2019-12-310000104894wre:ThreePointNineFivePercentUnsecuredNotesMemberus-gaap:UnsecuredDebtMember2020-01-012020-12-310000104894us-gaap:LondonInterbankOfferedRateLIBORMemberwre:A2018TermLoanMemberus-gaap:UnsecuredDebtMember2020-01-012020-12-310000104894wre:A2018TermLoanMemberus-gaap:UnsecuredDebtMember2020-12-310000104894wre:A2018TermLoanMemberus-gaap:UnsecuredDebtMember2019-12-310000104894wre:A2018TermLoanMemberus-gaap:UnsecuredDebtMember2020-01-012020-12-310000104894wre:A30YearUnsecuredNotesMemberMemberus-gaap:UnsecuredDebtMember2020-12-310000104894wre:A30YearUnsecuredNotesMemberMemberus-gaap:UnsecuredDebtMember2019-12-310000104894wre:A30YearUnsecuredNotesMemberMemberus-gaap:UnsecuredDebtMember2020-01-012020-12-310000104894us-gaap:UnsecuredDebtMemberwre:A2020GreenBondsMember2020-12-310000104894us-gaap:UnsecuredDebtMemberwre:A2020GreenBondsMember2019-12-310000104894us-gaap:UnsecuredDebtMemberwre:A2020GreenBondsMember2020-01-012020-12-310000104894us-gaap:UnsecuredDebtMember2020-12-310000104894us-gaap:UnsecuredDebtMember2019-12-310000104894us-gaap:UnsecuredDebtMember2020-01-012020-12-310000104894wre:A10YearUnsecuredNotes5053Memberus-gaap:NotesPayableOtherPayablesMember2020-04-012020-04-300000104894wre:A10YearUnsecuredNotes5053Memberus-gaap:NotesPayableOtherPayablesMember2020-04-300000104894wre:May2020TermLoanMemberus-gaap:LoansPayableMember2020-05-052020-05-050000104894wre:May2020TermLoanMemberus-gaap:LoansPayableMember2020-05-050000104894us-gaap:LondonInterbankOfferedRateLIBORMemberwre:May2020TermLoanMemberus-gaap:LoansPayableMember2020-05-052020-05-050000104894us-gaap:LondonInterbankOfferedRateLIBORMembersrt:MinimumMemberwre:May2020TermLoanMemberus-gaap:LoansPayableMember2020-05-052020-05-050000104894wre:A2020GreenBondsMemberus-gaap:NotesPayableOtherPayablesMember2020-09-290000104894wre:A2020GreenBondsMemberus-gaap:NotesPayableOtherPayablesMember2020-09-292020-09-290000104894us-gaap:LoansPayableMemberwre:A2015TermLoanMember2020-10-012020-12-310000104894wre:May2020TermLoanMemberus-gaap:LoansPayableMember2020-10-012020-12-3100001048942020-10-012020-12-310000104894wre:A2019TermLoanMemberus-gaap:LoansPayableMember2019-04-302019-04-300000104894wre:A2019TermLoanMemberus-gaap:LoansPayableMember2019-04-300000104894us-gaap:LondonInterbankOfferedRateLIBORMemberwre:A2019TermLoanMembersrt:MinimumMemberus-gaap:LoansPayableMember2019-04-302019-09-300000104894us-gaap:LondonInterbankOfferedRateLIBORMembersrt:MaximumMemberwre:A2019TermLoanMemberus-gaap:LoansPayableMember2019-04-302019-09-300000104894us-gaap:BaseRateMemberwre:A2019TermLoanMembersrt:MinimumMemberus-gaap:LoansPayableMember2019-04-302019-09-300000104894srt:MaximumMemberus-gaap:BaseRateMemberwre:A2019TermLoanMemberus-gaap:LoansPayableMember2019-04-302019-09-300000104894us-gaap:FederalFundsEffectiveSwapRateMemberwre:A2019TermLoanMemberus-gaap:LoansPayableMember2019-04-302019-09-300000104894us-gaap:LondonInterbankOfferedRateLIBORMemberwre:A2019TermLoanMemberus-gaap:LoansPayableMember2019-04-302019-09-300000104894wre:A2019TermLoanMemberus-gaap:LoansPayableMember2019-07-012019-09-30wre:arrangement0000104894us-gaap:InterestRateSwapMemberwre:A2015TermLoanMember2015-09-150000104894wre:A2015TermLoanMember2015-09-150000104894us-gaap:InterestRateSwapMemberwre:A2016TermLoanMember2016-07-220000104894wre:A2016TermLoanMember2016-07-220000104894wre:A2018TermLoanMember2018-03-290000104894wre:A2018TermLoanAMemberus-gaap:InterestRateSwapMember2018-03-290000104894us-gaap:InterestRateSwapMemberwre:A2018TermLoanBMember2018-03-290000104894wre:A2018TermLoanBMember2018-03-290000104894wre:A2018TermLoanMemberus-gaap:InterestRateSwapMember2018-03-290000104894us-gaap:InterestRateSwapMemberwre:ForwardSwapsForFutureDebtReplacementMember2019-11-300000104894wre:A10YearUnsecuredNotes5053Member2019-11-300000104894wre:A10YearUnsecuredNotes5053Member2019-11-012019-11-300000104894us-gaap:InterestRateSwapMemberwre:ForwardSwapsForFutureDebtReplacementMember2020-09-300000104894wre:A2020GreenBondsMember2020-09-302020-09-300000104894us-gaap:InterestRateSwapMemberwre:ForwardSwapsForFutureDebtReplacementMember2020-10-022020-10-020000104894us-gaap:InterestRateSwapMemberwre:A2015TermLoanMember2020-12-012020-12-3100001048942020-12-012020-12-310000104894us-gaap:InterestRateSwapMemberwre:A2015TermLoanMember2019-12-310000104894us-gaap:AccountsPayableAndAccruedLiabilitiesMemberus-gaap:InterestRateSwapMemberwre:A2015TermLoanMember2020-12-310000104894us-gaap:AccountsPayableAndAccruedLiabilitiesMemberus-gaap:InterestRateSwapMemberwre:A2015TermLoanMember2019-12-310000104894us-gaap:AccountsPayableAndAccruedLiabilitiesMemberwre:A2018TermLoanAMemberus-gaap:InterestRateSwapMember2020-12-310000104894wre:A2018TermLoanAMemberus-gaap:PrepaidExpensesAndOtherCurrentAssetsMemberus-gaap:InterestRateSwapMember2019-12-310000104894us-gaap:AccountsPayableAndAccruedLiabilitiesMemberus-gaap:InterestRateSwapMemberwre:A2018TermLoanBMember2020-12-310000104894us-gaap:AccountsPayableAndAccruedLiabilitiesMemberus-gaap:InterestRateSwapMemberwre:A2018TermLoanBMember2019-12-310000104894us-gaap:InterestRateSwapMemberwre:ForwardSwapsForFutureDebtReplacementMember2019-12-310000104894us-gaap:PrepaidExpensesAndOtherCurrentAssetsMemberwre:ForwardSwapsForFutureDebtReplacementMemberus-gaap:InterestRateSwapMember2020-12-310000104894us-gaap:PrepaidExpensesAndOtherCurrentAssetsMemberwre:ForwardSwapsForFutureDebtReplacementMemberus-gaap:InterestRateSwapMember2019-12-310000104894us-gaap:InterestRateSwapMember2020-12-310000104894us-gaap:InterestRateSwapMember2019-12-310000104894us-gaap:InterestRateSwapMember2020-01-012020-12-310000104894us-gaap:SupplementalEmployeeRetirementPlanDefinedBenefitMemberus-gaap:FairValueMeasurementsRecurringMember2020-12-310000104894us-gaap:FairValueInputsLevel1Memberus-gaap:SupplementalEmployeeRetirementPlanDefinedBenefitMemberus-gaap:FairValueMeasurementsRecurringMember2020-12-310000104894us-gaap:FairValueInputsLevel2Memberus-gaap:SupplementalEmployeeRetirementPlanDefinedBenefitMemberus-gaap:FairValueMeasurementsRecurringMember2020-12-310000104894us-gaap:SupplementalEmployeeRetirementPlanDefinedBenefitMemberus-gaap:FairValueMeasurementsRecurringMemberus-gaap:FairValueInputsLevel3Member2020-12-310000104894us-gaap:SupplementalEmployeeRetirementPlanDefinedBenefitMemberus-gaap:FairValueMeasurementsRecurringMember2019-12-310000104894us-gaap:FairValueInputsLevel1Memberus-gaap:SupplementalEmployeeRetirementPlanDefinedBenefitMemberus-gaap:FairValueMeasurementsRecurringMember2019-12-310000104894us-gaap:FairValueInputsLevel2Memberus-gaap:SupplementalEmployeeRetirementPlanDefinedBenefitMemberus-gaap:FairValueMeasurementsRecurringMember2019-12-310000104894us-gaap:SupplementalEmployeeRetirementPlanDefinedBenefitMemberus-gaap:FairValueMeasurementsRecurringMemberus-gaap:FairValueInputsLevel3Member2019-12-310000104894us-gaap:InterestRateSwapMemberus-gaap:FairValueMeasurementsRecurringMember2020-12-310000104894us-gaap:FairValueInputsLevel1Memberus-gaap:InterestRateSwapMemberus-gaap:FairValueMeasurementsRecurringMember2020-12-310000104894us-gaap:FairValueInputsLevel2Memberus-gaap:InterestRateSwapMemberus-gaap:FairValueMeasurementsRecurringMember2020-12-310000104894us-gaap:InterestRateSwapMemberus-gaap:FairValueMeasurementsRecurringMemberus-gaap:FairValueInputsLevel3Member2020-12-310000104894us-gaap:InterestRateSwapMemberus-gaap:FairValueMeasurementsRecurringMember2019-12-310000104894us-gaap:FairValueInputsLevel1Memberus-gaap:InterestRateSwapMemberus-gaap:FairValueMeasurementsRecurringMember2019-12-310000104894us-gaap:FairValueInputsLevel2Memberus-gaap:InterestRateSwapMemberus-gaap:FairValueMeasurementsRecurringMember2019-12-310000104894us-gaap:InterestRateSwapMemberus-gaap:FairValueMeasurementsRecurringMemberus-gaap:FairValueInputsLevel3Member2019-12-310000104894us-gaap:CarryingReportedAmountFairValueDisclosureMember2020-12-310000104894us-gaap:EstimateOfFairValueFairValueDisclosureMember2020-12-310000104894us-gaap:CarryingReportedAmountFairValueDisclosureMember2019-12-310000104894us-gaap:EstimateOfFairValueFairValueDisclosureMember2019-12-310000104894wre:WashingtonRealEstateInvestmentTrust2016OmnibusIncentivePlanMember2020-12-310000104894wre:WashingtonRealEstateInvestmentTrust2016OmnibusIncentivePlanMember2020-01-012020-12-310000104894wre:WashingtonRealEstateInvestmentTrust2016OmnibusIncentivePlanMember2019-12-310000104894wre:OfficerShortTermIncentivePlanMember2020-12-310000104894us-gaap:PerformanceSharesMembersrt:ChiefExecutiveOfficerMemberwre:OfficerShortTermIncentivePlanMember2020-12-310000104894us-gaap:PerformanceSharesMembersrt:ExecutiveVicePresidentMemberwre:OfficerShortTermIncentivePlanMember2020-12-310000104894us-gaap:PerformanceSharesMemberwre:OfficerShortTermIncentivePlanMembersrt:VicePresidentMember2020-12-310000104894wre:OfficerLongTermIncentivePlanMember2020-12-310000104894us-gaap:PerformanceSharesMemberwre:OfficerLongTermIncentivePlanMembersrt:ChiefExecutiveOfficerMember2020-12-310000104894us-gaap:PerformanceSharesMembersrt:ExecutiveVicePresidentMemberwre:OfficerLongTermIncentivePlanMember2020-12-310000104894us-gaap:PerformanceSharesMemberwre:OfficerLongTermIncentivePlanMembersrt:VicePresidentMember2020-12-310000104894wre:OfficerLongTermIncentivePlanMemberwre:TimeBasedSharesMember2020-01-012020-12-310000104894us-gaap:PerformanceSharesMemberwre:OfficerLongTermIncentivePlanMember2020-12-310000104894wre:PriorSTIPMembersrt:ExecutiveOfficerMember2019-01-012019-12-310000104894wre:RestrictedShareAwardsMemberwre:PriorSTIPMembersrt:ExecutiveOfficerMember2019-01-012019-12-310000104894wre:WashingtonRealEstateInvestmentTrust2007OmnibusLongTermIncentivePlanMember2019-12-310000104894wre:PriorSTIPMemberwre:NonExecutiveOfficerAndStaffMember2019-01-012019-12-310000104894wre:PriorLTIPMembersrt:ExecutiveOfficerMember2019-01-012019-12-310000104894wre:PriorLTIPMembersrt:ExecutiveOfficerMember2017-01-012017-12-310000104894wre:PriorLTIPMembersrt:ExecutiveOfficerMember2018-01-012018-12-310000104894wre:PriorLTIPMembersrt:MinimumMembersrt:ExecutiveOfficerMember2018-01-012018-12-310000104894wre:PriorLTIPMembersrt:MaximumMembersrt:ExecutiveOfficerMember2018-01-012018-12-310000104894wre:PriorLTIPMembersrt:ExecutiveOfficerMemberwre:UnrestrictedShareAwardsMember2018-01-012018-12-310000104894wre:PriorLTIPMemberwre:RestrictedShareAwardsMembersrt:ExecutiveOfficerMember2018-01-012018-12-310000104894wre:PriorLTIPMembersrt:ExecutiveOfficerMemberwre:UnrestrictedShareAwardsMember2020-01-012020-12-310000104894wre:PriorLTIPMembersrt:ExecutiveOfficerMember2020-01-012020-12-310000104894wre:PriorLTIPMemberwre:RestrictedShareAwardsMembersrt:ExecutiveOfficerMember2020-01-012020-12-310000104894wre:OfficerLTIPAndPriorLTIPMember2020-01-012020-12-310000104894wre:OfficerLTIPAndPriorLTIPMember2019-01-012019-12-310000104894wre:OfficerLTIPAndPriorLTIPMember2018-01-012018-12-310000104894wre:OfficerLTIPAndPriorLTIPMembersrt:MinimumMember2019-01-012019-12-310000104894srt:MaximumMemberwre:OfficerLTIPAndPriorLTIPMember2019-01-012019-12-310000104894wre:OfficerLTIPAndPriorLTIPMembersrt:MinimumMember2018-01-012018-12-310000104894srt:MaximumMemberwre:OfficerLTIPAndPriorLTIPMember2018-01-012018-12-310000104894wre:OfficerLTIPAndPriorLTIPMember2020-12-310000104894wre:OfficerLTIPAndPriorLTIPMember2019-12-310000104894wre:OfficerLTIPAndPriorLTIPMember2018-12-310000104894wre:PriorLTIPMembersrt:MinimumMembersrt:ExecutiveOfficerMember2020-01-012020-12-310000104894wre:PriorLTIPMembersrt:MaximumMembersrt:ExecutiveOfficerMember2020-01-012020-12-310000104894wre:PriorLTIPMembersrt:MinimumMembersrt:ExecutiveOfficerMember2019-01-012019-12-310000104894wre:PriorLTIPMembersrt:MaximumMembersrt:ExecutiveOfficerMember2019-01-012019-12-310000104894wre:RestrictedShareAwardsMembersrt:ChiefExecutiveOfficerMember2017-01-012017-12-310000104894wre:LongTermIncentivePlanForNonExecutiveOfficersAndStaffMember2020-01-012020-12-31wre:employment_year0000104894wre:RestrictedShareAwardsMember2020-01-012020-12-310000104894srt:DirectorMember2018-01-012018-12-310000104894srt:DirectorMember2020-01-012020-12-310000104894srt:DirectorMember2019-01-012019-12-310000104894wre:RestrictedShareAwardsMember2017-12-310000104894wre:RestrictedShareAwardsMember2018-01-012018-12-310000104894wre:RestrictedShareAwardsMember2018-12-310000104894wre:RestrictedShareAwardsMember2019-01-012019-12-310000104894wre:RestrictedShareAwardsMember2019-12-310000104894wre:RestrictedShareAwardsMember2020-12-310000104894wre:UnrestrictedShareAwardsMarketBasedRelativeMember2020-01-012020-12-310000104894wre:RestrictedShareAwardsMarketBasedRelativeMember2019-01-012019-12-310000104894wre:UnrestrictedShareAwardsMarketBasedRelativeMember2019-01-012019-12-310000104894wre:RestrictedShareAwardsMarketBasedRelativeMember2018-01-012018-12-310000104894wre:UnrestrictedShareAwardsMarketBasedRelativeMember2018-01-012018-12-310000104894wre:UnrestrictedShareAwardsMarketBasedAbsoluteMember2020-01-012020-12-310000104894wre:RestrictedShareAwardsMarketBasedAbsoluteMember2019-01-012019-12-310000104894wre:UnrestrictedShareAwardsMarketBasedAbsoluteMember2019-01-012019-12-310000104894wre:RestrictedShareAwardsMarketBasedAbsoluteMember2018-01-012018-12-310000104894wre:UnrestrictedShareAwardsMarketBasedAbsoluteMember2018-01-012018-12-310000104894wre:UnrestrictedShareAwardsMarketBasedRelativeMemberwre:Awards2020Member2020-12-310000104894wre:Awards2019Memberwre:RestrictedShareAwardsMarketBasedRelativeMember2020-12-310000104894wre:Awards2019Memberwre:UnrestrictedShareAwardsMarketBasedRelativeMember2020-12-310000104894wre:RestrictedShareAwardsMarketBasedRelativeMemberwre:Awards2018Member2020-12-310000104894wre:UnrestrictedShareAwardsMarketBasedRelativeMemberwre:Awards2018Member2020-12-310000104894wre:Awards2020Memberwre:UnrestrictedShareAwardsMarketBasedAbsoluteMember2020-12-310000104894wre:Awards2019Memberwre:RestrictedShareAwardsMarketBasedAbsoluteMember2020-12-310000104894wre:Awards2019Memberwre:UnrestrictedShareAwardsMarketBasedAbsoluteMember2020-12-310000104894wre:Awards2018Memberwre:RestrictedShareAwardsMarketBasedAbsoluteMember2020-12-310000104894wre:UnrestrictedShareAwardsMarketBasedAbsoluteMemberwre:Awards2018Member2020-12-310000104894wre:Awards2020Memberwre:UnrestrictedShareAwardsMarketBasedAbsoluteMember2020-01-012020-12-310000104894wre:Awards2019AndAwards2018Memberwre:UnrestrictedShareAwardsMarketBasedAbsoluteMember2019-01-012019-12-310000104894wre:Awards2019AndAwards2018Memberwre:RestrictedShareAwardsMarketBasedAbsoluteMember2019-01-012019-12-310000104894wre:ShareAwardsMarketBasedRelativeMember2020-01-012020-12-310000104894wre:ShareAwardsMarketBasedRelativeMember2019-01-012019-12-310000104894wre:ShareAwardsMarketBasedRelativeMember2018-01-012018-12-310000104894srt:OfficerMember2020-12-310000104894srt:OfficerMember2019-12-31wre:segment0000104894us-gaap:OperatingSegmentsMemberwre:MultifamilySegmentMember2020-01-012020-12-310000104894us-gaap:OperatingSegmentsMemberwre:MultifamilySegmentMember2019-01-012019-12-310000104894us-gaap:OperatingSegmentsMemberwre:MultifamilySegmentMember2018-01-012018-12-310000104894us-gaap:OperatingSegmentsMemberwre:OfficeSegmentMember2020-01-012020-12-310000104894us-gaap:OperatingSegmentsMemberwre:OfficeSegmentMember2019-01-012019-12-310000104894us-gaap:OperatingSegmentsMemberwre:OfficeSegmentMember2018-01-012018-12-310000104894us-gaap:CorporateNonSegmentMember2020-01-012020-12-310000104894us-gaap:CorporateNonSegmentMember2019-01-012019-12-310000104894us-gaap:CorporateNonSegmentMember2018-01-012018-12-310000104894us-gaap:OperatingSegmentsMemberwre:OfficeSegmentMember2020-12-310000104894us-gaap:OperatingSegmentsMemberwre:MultifamilySegmentMember2020-12-310000104894us-gaap:CorporateNonSegmentMember2020-12-310000104894us-gaap:OperatingSegmentsMemberwre:OfficeSegmentMember2019-12-310000104894us-gaap:OperatingSegmentsMemberwre:MultifamilySegmentMember2019-12-310000104894us-gaap:CorporateNonSegmentMember2019-12-310000104894us-gaap:OperatingSegmentsMemberwre:OfficeSegmentMember2018-12-310000104894us-gaap:OperatingSegmentsMemberwre:MultifamilySegmentMember2018-12-310000104894us-gaap:CorporateNonSegmentMember2018-12-3100001048942020-01-012020-03-3100001048942020-04-012020-06-3000001048942020-07-012020-09-3000001048942019-01-012019-03-3100001048942019-04-012019-06-3000001048942019-07-012019-09-3000001048942019-10-012019-12-3100001048942018-05-040000104894us-gaap:ValuationAllowanceOfDeferredTaxAssetsMember2019-12-310000104894us-gaap:ValuationAllowanceOfDeferredTaxAssetsMember2020-01-012020-12-310000104894us-gaap:ValuationAllowanceOfDeferredTaxAssetsMember2020-12-310000104894us-gaap:ValuationAllowanceOfDeferredTaxAssetsMember2018-12-310000104894us-gaap:ValuationAllowanceOfDeferredTaxAssetsMember2019-01-012019-12-310000104894us-gaap:ValuationAllowanceOfDeferredTaxAssetsMember2017-12-310000104894us-gaap:ValuationAllowanceOfDeferredTaxAssetsMember2018-01-012018-12-310000104894srt:MultifamilyMemberstpr:DCwre:A3801ConnecticutMember2020-12-310000104894srt:MultifamilyMemberstpr:DCwre:A3801ConnecticutMember2020-01-012020-12-310000104894stpr:VAsrt:MultifamilyMemberwre:RooseveltTowersMember2020-12-310000104894stpr:VAsrt:MultifamilyMemberwre:RooseveltTowersMember2020-01-012020-12-310000104894stpr:VAsrt:MultifamilyMemberwre:ParkAdamsMember2020-12-310000104894stpr:VAsrt:MultifamilyMemberwre:ParkAdamsMember2020-01-012020-12-310000104894stpr:VAsrt:MultifamilyMemberwre:AshbyAtMcleanMember2020-12-310000104894stpr:VAsrt:MultifamilyMemberwre:AshbyAtMcleanMember2020-01-012020-12-310000104894srt:MultifamilyMemberstpr:MDwre:BethesdaHillApartmentsMember2020-12-310000104894srt:MultifamilyMemberstpr:MDwre:BethesdaHillApartmentsMember2020-01-012020-12-310000104894stpr:VAsrt:MultifamilyMemberwre:BennettParkMember2020-12-310000104894stpr:VAsrt:MultifamilyMemberwre:BennettParkMember2020-01-012020-12-310000104894stpr:VAsrt:MultifamilyMemberwre:ClayborneMember2020-12-310000104894stpr:VAsrt:MultifamilyMemberwre:ClayborneMember2020-01-012020-12-310000104894srt:MultifamilyMemberstpr:DCwre:KenmoreMember2020-12-310000104894srt:MultifamilyMemberstpr:DCwre:KenmoreMember2020-01-012020-12-310000104894stpr:VAsrt:MultifamilyMemberwre:TheMaxwellMember2020-12-310000104894stpr:VAsrt:MultifamilyMemberwre:TheMaxwellMember2020-01-012020-12-310000104894srt:MultifamilyMemberwre:YaleWestMemberstpr:DC2020-12-310000104894stpr:VAsrt:MultifamilyMemberwre:TheParamountMember2020-12-310000104894stpr:VAsrt:MultifamilyMemberwre:TheParamountMember2020-01-012020-12-310000104894srt:MultifamilyMemberwre:YaleWestMemberstpr:DC2020-01-012020-12-310000104894stpr:VAwre:TheWellingtonMembersrt:MultifamilyMember2020-12-310000104894stpr:VAwre:TheWellingtonMembersrt:MultifamilyMember2020-01-012020-12-310000104894stpr:VAwre:TheTroveMembersrt:MultifamilyMember2020-12-310000104894stpr:VAwre:TheTroveMembersrt:MultifamilyMember2020-01-012020-12-310000104894stpr:VAsrt:MultifamilyMemberwre:RiversideApartmentsMember2020-12-310000104894stpr:VAsrt:MultifamilyMemberwre:RiversideApartmentsMember2020-01-012020-12-310000104894stpr:VAsrt:MultifamilyMemberwre:RiversideApartmentslandparcelMember2020-12-310000104894stpr:VAsrt:MultifamilyMemberwre:AssemblyAlexandriaMember2020-12-310000104894stpr:VAsrt:MultifamilyMemberwre:AssemblyAlexandriaMember2020-01-012020-12-310000104894stpr:VAsrt:MultifamilyMemberwre:AssemblyManassasMember2020-12-310000104894stpr:VAsrt:MultifamilyMemberwre:AssemblyManassasMember2020-01-012020-12-310000104894stpr:VAsrt:MultifamilyMemberwre:AssemblyDullesMember2020-12-310000104894stpr:VAsrt:MultifamilyMemberwre:AssemblyDullesMember2020-01-012020-12-310000104894stpr:VAsrt:MultifamilyMemberwre:AssemblyLeesburgMember2020-12-310000104894stpr:VAsrt:MultifamilyMemberwre:AssemblyLeesburgMember2020-01-012020-12-310000104894stpr:VAsrt:MultifamilyMemberwre:AssemblyHerndonMember2020-12-310000104894stpr:VAsrt:MultifamilyMemberwre:AssemblyHerndonMember2020-01-012020-12-310000104894wre:AssemblyGermantownMembersrt:MultifamilyMemberstpr:MD2020-12-310000104894wre:AssemblyGermantownMembersrt:MultifamilyMemberstpr:MD2020-01-012020-12-310000104894srt:MultifamilyMemberstpr:MDwre:AssemblyWatkinsMillMember2020-12-310000104894srt:MultifamilyMemberstpr:MDwre:AssemblyWatkinsMillMember2020-01-012020-12-310000104894stpr:VAsrt:MultifamilyMemberwre:CascadeAtLandmarkMember2020-12-310000104894stpr:VAsrt:MultifamilyMemberwre:CascadeAtLandmarkMember2020-01-012020-12-310000104894srt:MultifamilyMember2020-01-012020-12-310000104894srt:OfficeBuildingMemberstpr:DCwre:A1901PennsylvaniaAvenueMember2020-12-310000104894srt:OfficeBuildingMemberstpr:DCwre:A1901PennsylvaniaAvenueMember2020-01-012020-12-310000104894stpr:VAwre:A515KingStreetMembersrt:OfficeBuildingMember2020-12-310000104894stpr:VAwre:A515KingStreetMembersrt:OfficeBuildingMember2020-01-012020-12-310000104894wre:A122019ThStreetMembersrt:OfficeBuildingMemberstpr:DC2020-12-310000104894wre:A122019ThStreetMembersrt:OfficeBuildingMemberstpr:DC2020-01-012020-12-310000104894stpr:VAsrt:OfficeBuildingMemberwre:A1600WilsonBoulevardMember2020-12-310000104894stpr:VAsrt:OfficeBuildingMemberwre:A1600WilsonBoulevardMember2020-01-012020-12-310000104894stpr:VAsrt:OfficeBuildingMemberwre:SilverlineCenterMember2020-12-310000104894stpr:VAsrt:OfficeBuildingMemberwre:SilverlineCenterMember2020-01-012020-12-310000104894stpr:VAwre:CourthouseSquareMembersrt:OfficeBuildingMember2020-12-310000104894stpr:VAwre:CourthouseSquareMembersrt:OfficeBuildingMember2020-01-012020-12-310000104894srt:OfficeBuildingMemberstpr:DCwre:A2000MStreetMember2020-12-310000104894srt:OfficeBuildingMemberstpr:DCwre:A2000MStreetMember2020-01-012020-12-310000104894wre:A1140ConnecticutAvenueMembersrt:OfficeBuildingMemberstpr:DC2020-12-310000104894wre:A1140ConnecticutAvenueMembersrt:OfficeBuildingMemberstpr:DC2020-01-012020-12-310000104894stpr:VAsrt:OfficeBuildingMemberwre:FairgateAtBallstonMember2020-12-310000104894stpr:VAsrt:OfficeBuildingMemberwre:FairgateAtBallstonMember2020-01-012020-12-310000104894srt:OfficeBuildingMemberwre:TheArmyNavyClubBuildingMemberstpr:DC2020-12-310000104894srt:OfficeBuildingMemberwre:TheArmyNavyClubBuildingMemberstpr:DC2020-01-012020-12-310000104894srt:OfficeBuildingMemberstpr:DCwre:A1775EyeStreetMember2020-12-310000104894srt:OfficeBuildingMemberstpr:DCwre:A1775EyeStreetMember2020-01-012020-12-310000104894srt:OfficeBuildingMemberstpr:DCwre:Watergate600Member2020-12-310000104894srt:OfficeBuildingMemberstpr:DCwre:Watergate600Member2020-01-012020-12-310000104894stpr:VAsrt:OfficeBuildingMemberwre:ArlingtonTowerMember2020-12-310000104894stpr:VAsrt:OfficeBuildingMemberwre:ArlingtonTowerMember2020-01-012020-12-310000104894wre:WestminsterMembersrt:RetailSiteMemberstpr:MD2020-12-310000104894wre:WestminsterMembersrt:RetailSiteMemberstpr:MD2020-01-012020-12-310000104894stpr:VAwre:ConcordCentreMembersrt:RetailSiteMember2020-12-310000104894stpr:VAwre:ConcordCentreMembersrt:RetailSiteMember2020-01-012020-12-310000104894wre:TakomaParkMembersrt:RetailSiteMemberstpr:MD2020-12-310000104894wre:TakomaParkMembersrt:RetailSiteMemberstpr:MD2020-01-012020-12-310000104894wre:ChevyChaseMetroPlazaMemberstpr:DCsrt:RetailSiteMember2020-12-310000104894wre:ChevyChaseMetroPlazaMemberstpr:DCsrt:RetailSiteMember2020-01-012020-12-310000104894stpr:VAsrt:RetailSiteMemberwre:A800SWashingtonStreetMember2020-12-310000104894stpr:VAsrt:RetailSiteMemberwre:A800SWashingtonStreetMember2020-01-012020-12-310000104894wre:RandolphShoppingCenterMembersrt:RetailSiteMemberstpr:MD2020-12-310000104894wre:RandolphShoppingCenterMembersrt:RetailSiteMemberstpr:MD2020-01-012020-12-310000104894wre:MontroseShoppingCenterMembersrt:RetailSiteMemberstpr:MD2020-12-310000104894wre:MontroseShoppingCenterMembersrt:RetailSiteMemberstpr:MD2020-01-012020-12-310000104894stpr:DCwre:SpringVallyRetailCenterMembersrt:RetailSiteMember2020-12-310000104894stpr:DCwre:SpringVallyRetailCenterMembersrt:RetailSiteMember2020-01-012020-12-310000104894srt:RetailSiteMember2020-12-310000104894srt:MinimumMemberus-gaap:BuildingAndBuildingImprovementsMember2020-01-012020-12-310000104894srt:MaximumMemberus-gaap:BuildingAndBuildingImprovementsMember2020-01-012020-12-310000104894wre:VariousDevelopmentProjectsMember2020-12-31
UNITED STATES
SECURITIES AND EXCHANGE COMMISSION
Washington, D.C. 20549
___________________________________________________
FORM 10-K
___________________________________________________
| | | | | |
| ☒ | ANNUAL REPORT PURSUANT TO SECTION 13 OR 15(d) OF THE SECURITIES EXCHANGE ACT OF 1934 |
For fiscal year ended December 31, 2020
OR
| | | | | |
| ☐ | TRANSITION REPORT PURSUANT TO SECTION 13 OR 15(d) OF THE SECURITIES EXCHANGE ACT OF 1934 |
COMMISSION FILE NO. 001-06622
___________________________________________________
WASHINGTON REAL ESTATE INVESTMENT TRUST
(Exact name of registrant as specified in its charter)
___________________________________________________
| | | | | | | | |
| Maryland | | 53-0261100 |
| (State of incorporation) | | (IRS Employer Identification Number) |
1775 EYE STREET, NW, SUITE 1000, WASHINGTON, DC 20006
(Address of principal executive office) (Zip code)
Registrant’s telephone number, including area code: (202) 774-3200
___________________________________________________
Securities registered pursuant to Section 12(b) of the Act:
| | | | | | | | |
| Title of each class | Trading Symbol(s) | Name of each exchange on which registered |
| Shares of Beneficial Interest | WRE | NYSE |
Securities registered pursuant to Section 12(g) of the Act: None
___________________________________________________
Indicate by check mark if the registrant is a well-known seasoned issuer, as defined in Rule 405 of the Securities Act. Yes ☒ No ☐
Indicate by check mark if the registrant is not required to file reports pursuant to Section 13 or Section 15(d) of the Act. Yes ☐ No ☒
Indicate by check mark whether the registrant (1) has filed all reports required to be filed by Section 13 or 15(d) of the Securities Exchange Act of 1934 during the preceding 12 months (or such shorter period that the registrant was required to file such reports) and (2) has been subject to such filing requirements for the past 90 days. Yes ☒ No ☐
Indicate by check mark whether the registrant has submitted electronically every Interactive Data File required to be submitted pursuant to Rule 405 of Regulation S-T (§232.405 of this chapter) during the preceding 12 months (or for such shorter period that the registrant was required to submit such files). Yes ☒ No ☐
Indicate by check mark whether the registrant is a large accelerated filer, an accelerated filer, a non-accelerated filer or a smaller reporting company. See definition of “large accelerated filer,” “accelerated filer,” “smaller reporting company,” and "emerging growth company" in Rule 12b-2 of the Exchange Act.
| | | | | | | | | | | |
| Large accelerated filer | ☒ | Accelerated filer | ☐ |
| Non-accelerated filer | ☐ | Smaller reporting company | ☐ |
| | Emerging growth company | ☐ |
If an emerging growth company, indicate by check mark if the registrant has elected not to use the extended transition period for complying with any new or revised financial accounting standards provided pursuant to Section 13(a) of the Exchange Act. ☐
Indicate by check mark whether the registrant has filed a report on and attestation to its management’s assessment of the effectiveness of its internal control over financial reporting under Section 404(b) of the Sarbanes-Oxley Act (15 U.S.C. 7262(b)) by the registered public accounting firm that prepared or issued its audit report. ☒
Indicate by check mark whether the registrant is a shell company (as defined in Rule 12b-2 of the Act). Yes ☐ No ☒
As of June 30, 2020, the aggregate market value of such shares held by non-affiliates of the registrant was $1,811,606,216 (based on the closing price of the stock on June 30, 2020).
As of February 11, 2021, 84,559,065 common shares were outstanding.
___________________________________________________
DOCUMENTS INCORPORATED BY REFERENCE
Portions of our definitive Proxy Statement relating to the 2021 Annual Meeting of Shareholders, to be filed with the Securities and Exchange Commission, are incorporated by reference in Part III, Items 10-14 of this Annual Report on Form 10-K as indicated herein.
WASHINGTON REAL ESTATE INVESTMENT TRUST
2020 FORM 10-K ANNUAL REPORT
INDEX
| | | | | | | | | | | |
| PART I | | | Page |
| | | |
| Item 1. | Business | |
| Item 1A. | Risk Factors | |
| Item 1B. | Unresolved Staff Comments | |
| Item 2. | Properties | |
| Item 3. | Legal Proceedings | |
| Item 4. | Mine Safety Disclosures | |
| | | |
| PART II | | | |
| | | |
| Item 5. | Market for the Registrant's Common Equity, Related Stockholder Matters and Issuer Purchases of Equity Securities | |
| Item 6. | Selected Financial Data | |
| Item 7. | Management’s Discussion and Analysis of Financial Condition and Results of Operations | |
| Item 7A. | Qualitative and Quantitative Disclosures about Market Risk | |
| Item 8. | Financial Statements and Supplementary Data | |
| Item 9. | Changes in and Disagreements with Accountants on Accounting and Financial Disclosure | |
| Item 9A. | Controls and Procedures | |
| Item 9B. | Other Information | |
| | | |
| PART III | | | |
| | | |
| Item 10. | Directors, Executive Officers and Corporate Governance | |
| Item 11. | Executive Compensation | |
| Item 12. | Security Ownership of Certain Beneficial Owners and Management and Related Stockholder Matters | |
| Item 13. | Certain Relationships and Related Transactions, and Director Independence | |
| Item 14. | Principal Accountant Fees and Services | |
| | | |
| PART IV | | | |
| | | |
| Item 15. | Exhibits and Financial Statement Schedules | |
| Item 16. | Form 10-K Summary | |
| | Signatures | |
PART I
ITEM 1: BUSINESS
WashREIT Overview
Washington Real Estate Investment Trust (“WashREIT”) is a self-administered equity real estate investment trust (“REIT”), successor to a trust organized in 1960. Our business consists of the ownership and operation of income producing real estate properties in the greater Washington metro region. We own a portfolio of multifamily and commercial (office and retail) properties.
Our strategy is to generate returns and maximize shareholder value through proactive asset management and prudent capital allocation decisions. Consistent with this strategy, we invest in additional income producing properties through acquisitions, development and redevelopment. We invest in properties where we believe we will be able to improve the operating results and increase the value of the property. We focus on properties in the Washington metro region, near major transportation nodes and in areas with strong employment drivers and superior growth demographics. We will seek to continue to upgrade our portfolio as opportunities arise, funding development and acquisitions with a combination of cash, equity, debt and proceeds from property sales.
While we have historically focused most of our investments in the greater Washington metro region, in order to maximize acquisition opportunities we also may consider opportunities to replicate our strategy in other geographic markets which meet the criteria described above.
Our Regional Economy and Real Estate Markets
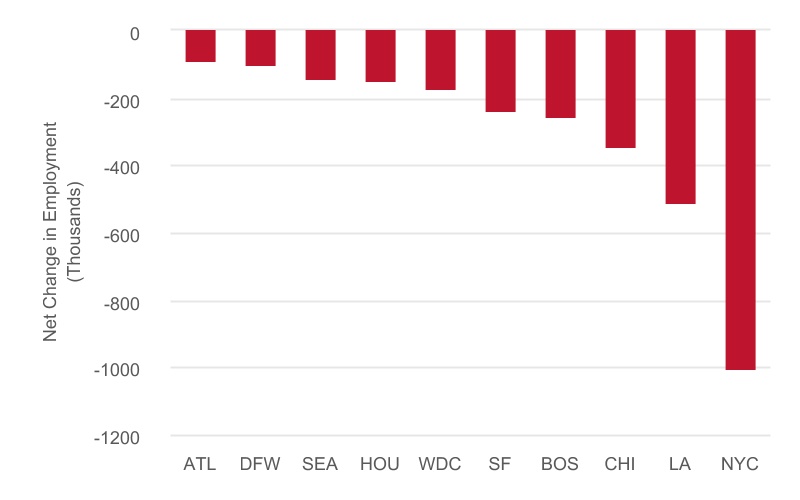
The Washington metro region continues to slowly recover from the economic shock resulting from the COVID-19 pandemic. Positive monthly job growth through November 2020 brought back much of the Washington metro region’s jobs that were initially lost in the spring. However, the 12-month job growth figure remains sharply negative at approximately 179,700 net job losses, according to Delta Associates / Transwestern Commercial Services (“Delta”), a national full-service real estate firm that provides market research and evaluation services for commercial property.
Payroll Job Growth
Major Metro Areas
12 Months Ending November 2020
______________________________
Source: U.S. Bureau of Labor Statistics; January 2021
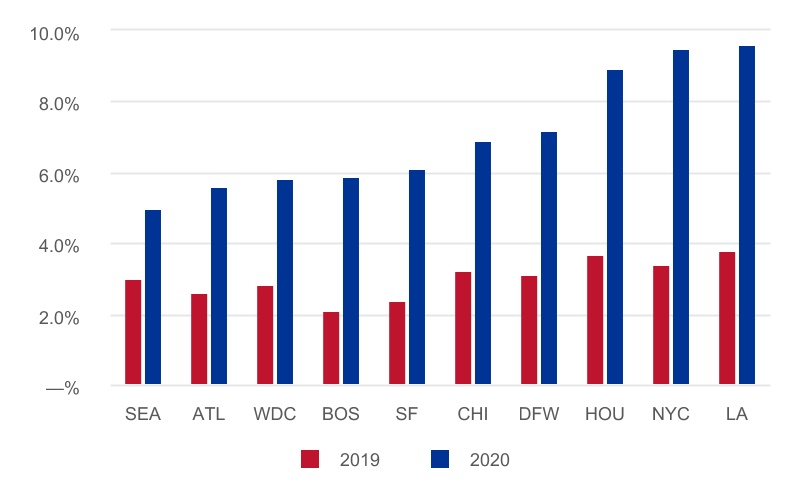
The unemployment rate in the Washington metro region was 5.8% in November 2020, a 300-basis point increase over November 2019, but 400 basis points less than the pandemic peak of 9.8% in April, according to Delta. The Washington metro region retains one of the lowest unemployment rates in the country and is well under the national unemployment rate of 6.4%, according to Delta.
Unemployment Rate
Major Metro Areas
November 2020 vs. November 2019
______________________________
Source: U.S. Bureau of Labor Statistics; January 2021
Certain market statistics and information from several third-party providers for the Washington metro region are set forth below:
Multifamily
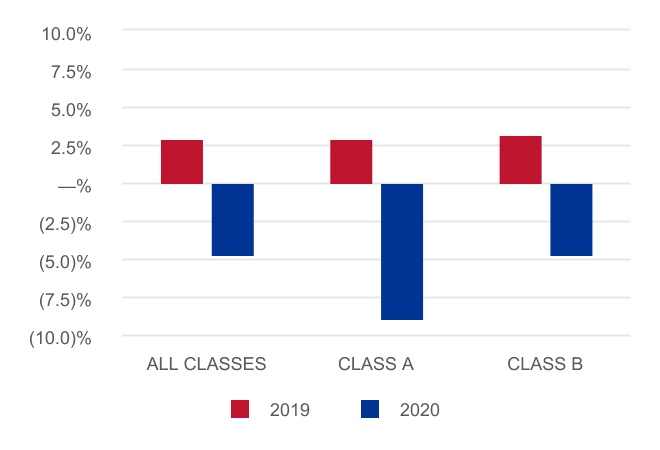
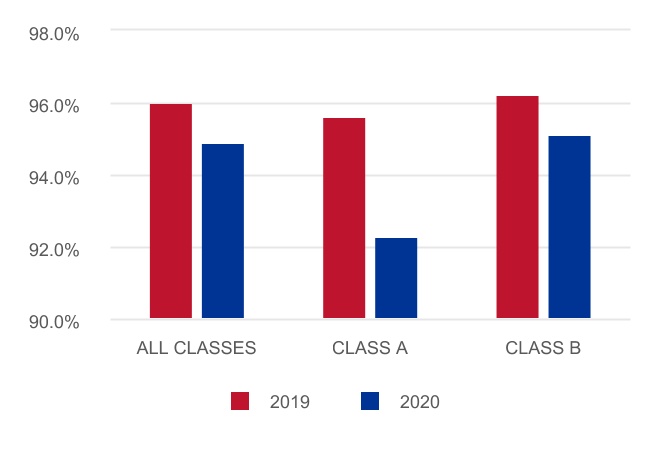
The multifamily real estate market had lower effective rents and occupancy rates in 2020, reflecting disruption from the COVID-19 pandemic, according to statistics from RealPage Market Analytics, a commercial real estate management software company that provides market research:
Year-Over-Year Year-Over-Year
Apartment Effective Rent Change Apartment Occupancy
Washington Metro 2020 vs. 2019 Washington Metro 2020 vs. 2019
______________________________
Source: RealPage Market Analytics; January 2021
Demand in the Washington metro region has continued to fall since the pandemic began, a trend also seen among some of the nation’s gateway markets (i.e., San Francisco, Los Angeles, New York City and Boston).
The development pipeline for the Washington metro region remains elevated and is expected to suppress occupancy and rental rates in 2021 as approximately 14,800 new deliveries are expected while approximately 32,000 units are under construction.
Class A (1) properties are expected to struggle the most as new lease-ups should create significant competition throughout 2021. Class B (2) properties, especially properties located in suburban areas, have outperformed Class A properties during the COVID-19 pandemic and are expected to continue to outperform Class A units as no new supply of Class B units are expected to be added to the market in 2021.
______________________________
(1) Defined by Delta as product generally built in 1995 or later and offering a separate clubhouse, decorated model units, two bedroom/ two bath units, and a large community amenity package most often including a fitness center and swimming pool.
(2)Defined by Delta as product that is well maintained, older, generally built in the 1960’s or 1970’s, and which does not offer a separate clubhouse nor decorated model unit nor two bedroom/two bathroom floor plans. Class B communities typically offer limited project amenities.
Office
| | | | | | | | | | | |
| Washington Metro Region | 2020 | | 2019 |
| Average asking rent per square foot | $ | 43.72 | | | $ | 43.30 | |
| Total vacancy rate at year end | 18.7 | % | | 16.1 | % |
Net absorption (in millions of square feet) (1) | (5.2) | | | 4.5 | |
| Office space under construction at year end (in millions of square feet) | 7.0 | | | 9.8 | |
______________________________
(1) Net absorption is defined as the change in occupied, standing inventory from one year to the next.
Source: Jones Lang LaSalle ("JLL"), a commercial real estate services firm
The Washington metro region's office market performance in 2020 reflected the stress of the COVID-19 pandemic. Total vacancy rose to 15.8% in Washington, D.C. and 20.0% in Northern Virginia, according to JLL. Direct asking rents remained relatively stable, as landlords increased focus on concessions to secure transactions. Net effective rents declined by approximately 12.5% in Washington, D.C. and 25% in Northern Virginia. Leasing volume declined across the Washington metro region. In Washington, D.C., overall leasing volume decreased by 49% compared to 2019, with renewals representing over two-thirds of the annual volume. In Northern Virginia, despite a record year for government contract awards, leasing volume was down 32% year over year. In the second half of 2020, renewals accounted for 68% of leasing volume in Northern Virginia as tenants continue to delay space decisions. Construction has slowed in Washington, D.C. as 2.7 million square feet is under construction, with 56% pre-leased. In Northern Virginia, 677,000 of the 5 million square feet of space under construction is available for lease, with 64% of the space owner-built, 21% build to suit and 15% speculative development.
Historically, there has been a positive correlation between political alignment in the federal government and leasing in the Washington metro region for the office market. For example, since 2000, aligned government correlated to 14.9 million square feet of absorption compared to periods of divided government, which resulted in only 5.7 million square feet of absorption in Washington, D.C. JLL notes that elevated contract awards under a new presidential administration could provide a lift to the market over the intermediate term, particularly in Northern Virginia, but the actual effect remains to be seen. In the near term, elevated vacancy and subdued leasing demand will drive office leasing performance metrics.
Our Portfolio
As of December 31, 2020, we owned a diversified portfolio of 43 properties, totaling approximately 3.4 million square feet of commercial space and 7,059 residential units and land held for development. These 43 properties consist of 22 multifamily properties, 13 office properties and 8 retail centers. The percentage of total real estate rental revenue from continuing operations by property type for the three years ended December 31, 2020, 2019 and 2018, and the percent leased as of December 31, 2020, were as follows:
| | | | | | | | | | | | | | | | | | | | |
Percent Leased at December 31, 2020(1) | | % of Total Real Estate Rental Revenue |
| | 2020 | | 2019 | | 2018 |
| 92% | Multifamily | 49 | % | | 41 | % | | 33 | % |
| 87% | Office | 45 | % | | 53 | % | | 61 | % |
| 89% | Other | 6 | % | | 6 | % | | 6 | % |
| | 100 | % | | 100 | % | | 100 | % |
______________________________
(1) Calculated as the percentage of physical net rentable area leased, except for multifamily, which is calculated as the percentage of units leased. The net rentable area leased for office and retail properties includes temporary lease agreements.
On a combined basis, our commercial portfolio (i.e., our office and retail properties, excluding properties classified as discontinued operations) was 87%, 93% and 93% leased at December 31, 2020, 2019 and 2018, respectively.
Total real estate rental revenue from continuing operations for each of the three years ended December 31, 2020 was $294.1 million, $309.2 million and $291.7 million, respectively. During the three years ended December 31, 2020, we acquired eight multifamily properties and one office property, and substantially completed major construction activities at one retail redevelopment project and one multifamily development project. During that same period, we sold eight retail properties and seven office properties. See note 14 to the consolidated financial statements for further discussion of our operating results by segment.
The commercial lease expirations for the next ten years and thereafter are as follows:
| | | | | | | | | | | | | | | | | | | | | | | | |
| # of Leases | | Square Feet | | Gross Annual Rent
(in thousands) | | Percentage of Total Gross Annual Rent | |
| Office: | | | | | | | | |
| 2021 | 49 | | | 205,717 | | | $ | 8,644 | | | 7 | % | |
| 2022 | 46 | | | 375,218 | | | 18,663 | | | 15 | % | |
| 2023 | 55 | | | 317,740 | | | 16,101 | | | 13 | % | |
| 2024 | 52 | | | 257,568 | | | 14,188 | | | 11 | % | |
| 2025 | 43 | | | 190,367 | | | 10,461 | | | 8 | % | |
| 2026 | 28 | | | 183,715 | | | 11,163 | | | 9 | % | |
| 2027 | 25 | | | 273,483 | | | 18,047 | | | 14 | % | |
| 2028 | 16 | | | 78,455 | | | 4,989 | | | 4 | % | |
| 2029 | 12 | | | 50,801 | | | 3,074 | | | 2 | % | |
| 2030 | 13 | | | 120,279 | | | 7,660 | | | 6 | % | |
| Thereafter | 16 | | | 175,724 | | | 12,621 | | | 11 | % | |
| Total | 355 | | | 2,229,067 | | | $ | 125,611 | | | 100 | % | |
| | | | | | | | |
| Other: | | | | | | | | |
| 2021 | 11 | | | 70,127 | | | $ | 1,368 | | | 9 | % | |
| 2022 | 14 | | | 92,934 | | | 1,934 | | | 13 | % | |
| 2023 | 18 | | | 65,858 | | | 1,630 | | | 11 | % | |
| 2024 | 17 | | | 134,586 | | | 3,172 | | | 21 | % | |
| 2025 | 11 | | | 79,292 | | | 1,476 | | | 10 | % | |
| 2026 | 7 | | | 29,239 | | | 968 | | | 7 | % | |
| 2027 | 5 | | | 47,611 | | | 1,109 | | | 7 | % | |
| 2028 | 5 | | | 21,582 | | | 785 | | | 5 | % | |
| 2029 | 5 | | | 18,133 | | | 913 | | | 6 | % | |
| 2030 | 4 | | | 21,831 | | | 607 | | | 5 | % | |
| Thereafter | 3 | | | 13,415 | | | 917 | | | 6 | % | |
| Total | 100 | | | 594,608 | | | $ | 14,879 | | | 100 | % | |
According to Delta, the professional/business services and government sectors constituted over 45% of payroll jobs in the Washington metro region at the end of 2020. Due to our geographic concentration in the Washington metro region, a significant number of our tenants have historically been concentrated in the professional/business services and government sectors, although the exact number will vary from time to time. As a result of this concentration, we are susceptible to business trends (both positive and negative) that affect the outlook for these sectors.
No single tenant accounted for more than 3% of real estate rental revenue in 2020 and no more than 5% in 2019 or 2018. All federal government tenants in the aggregate accounted for less than 1% of our real estate rental revenue in 2020.
Our ten largest commercial tenants, in terms of real estate rental revenue for 2020, are as follows:
| | | | | |
| 1. | Atlantic Media, Inc. |
| 2. | Capital One, N.A. |
| 3. | EIG Management Company, LLC |
| 4. | B. Riley Financial, Inc. |
| 5. | Epstein, Becker & Green, P.C. |
| 6. | Hughes Hubbard & Reed LLP |
| 7. | Morgan Stanley Smith Barney Financing |
| 8. | Promontory Interfinancial Network, LLC |
| 9. | Graham Holdings Company |
| 10. | Raytheon BBN Technologies Corporation |
We enter into arrangements from time to time by which various service providers conduct day-to-day property management and/or leasing activities at our properties. Bozzuto Management Company ("Bozzuto") and Greystar Real Estate Partners ("Greystar") currently provide property management and leasing services at our multifamily properties. Bozzuto and Greystar provide such services under individual property management agreements for each property, each of which is separately terminable by us or Bozzuto/Greystar, as applicable. Although they vary by property, on average, the fees charged by the service provider under each agreement are approximately 3% of revenues at each property.
We expect to continue investing in additional income-producing properties through acquisitions, development and redevelopment and plan to allocate more capital to multifamily as an asset class over time than we currently allocate. We invest in properties where we believe we will be able to improve the operating results and increase the value of the property. Our properties typically compete for residents and tenants with other properties on the basis of location, quality and rental rates.
We make capital improvements to our properties on an ongoing basis for the purpose of maintaining and increasing their value and income. However, we reduced our capital improvement spending for the year ended December 31, 2020 as a cost-saving measure due to the COVID-19 pandemic. Major improvements and/or renovations to the properties during the three years ended December 31, 2020 are discussed in Item 7, Management’s Discussion and Analysis of Financial Condition and Results of Operations, under the heading “Capital Improvements and Development Costs.”
Further description of the properties is contained in Item 2, Properties, and note 14 to the consolidated financial statements, Segment Information, and in Schedule III. Reference is also made to Item 7, Management’s Discussion and Analysis of Financial Condition and Results of Operations.
Human Capital
Employees, Training and Development
On February 11, 2021, we had 112 employees including 48 persons engaged in property management functions and 64 persons engaged in corporate, financial, leasing, asset management and other functions. All of our officers and substantially all of our employees live and work in or near the greater Washington metro region.
Our human capital resources objectives include identifying, recruiting, retaining, incentivizing and integrating our existing and new employees. At WashREIT, we place great value on employee growth through goals, feedback and professional and leadership development offerings. Our leadership courses are internally developed and delivered through multi-session, cohort-based experiential learning environments and are offered to employees at multiple levels. A certified executive leadership coach provides ongoing development support for leadership program participants and the employee population at large. We financially support employees pursuing industry-specific training and certification programs. Also, we encourage individuals to join professional organizations that offer technical, soft skill and leadership development workshops.
We also survey our employees regularly on a variety of topics including strategic initiatives, employee engagement, diversity, town hall meetings, community service, and others and incorporate the feedback to ensure our programs and initiatives are best serving employee needs.
Additionally, our equity and cash incentive plans are designed to attract, retain and reward our workforce through the granting
of stock-based and cash-based compensation awards, with the goal of motivating such individuals to perform to the best of their abilities and achieve our objectives, including increasing stockholder value.
Health, Safety and Well-being
We support our employees with a robust employee benefits program, including a flexible vacation policy, parental leave, 401(k) matching, tuition reimbursement, an Employee Assistance Program, and other programs.
Additionally, we have a wellness program that provides fun, engaging challenges to encourage employees to continuously improve their physical, mental, and financial well-being. Programs we run throughout the year include biometric screenings, personal finance check-ups, and healthy lunch challenges. In our corporate offices, we recently improved our wellness room by doubling the space for employees to take a break to decompress. The rooms also provide nursing mothers a peaceful place to meet their needs.
Our technological advances and multiple properties around the DC metro area allow our teams the flexibility to work from anywhere that suits their needs at any time. This allows us to easily meet our tenants’ needs as well as those of our employees, which has been especially important during the COVID-19 pandemic.
Diversity and Inclusion
WashREIT’s Diversity, Equity, Inclusion, and Belonging Initiative ("DEIB") is a long-term commitment to promote an environment where each individual feels comfortable being their most authentic selves. We believe diversity of backgrounds, experiences, cultures, ethnicities, and interests leads to new ways of thinking and drives organizational success. Our diverse 17 member DEIB Council is overseen by WashREIT’s senior leadership team and Board of Trustees. The DEIB Council both tracks and monitors our diversity metrics and facilitates learning and training opportunities that include: Diversity Speaker Series, targeted recruitment and relationship development of historically black colleges and universities and other diverse industry groups for internships, annual inclusion and belonging employee survey, partnership with diverse local non-profit to provide tutoring for school aged children among others.
Community Engagement
As a real estate investment trust, investing is at the core of what we do. But the most valuable investments we make are not in our buildings—they are in our people and our community. With more than five decades of experience operating exclusively in the Washington metro region, we’re passionate about making a difference in the region we call home.
We are committed to improving the lives of those in need, and our employees participate in a wide variety of philanthropic activities throughout the year. Whether volunteering at a food bank, running a toy drive, walking for a cause, or participating in our company-wide community service day, we’re proud to foster a culture of giving back.
Regulation
REIT Tax Status
We believe that we qualify as a REIT under Sections 856-860 of the Internal Revenue Code of 1986, as amended (the "Code"), and intend to continue to qualify as such. To maintain our status as a REIT, we are among other things required to distribute 90% of our REIT taxable income (determined before the deduction for dividends paid and excluding net capital gains), to our shareholders on an annual basis. When selling a property, we generally have the option of (a) reinvesting the sales proceeds of property sold, in a way that allows us to defer recognition of some or all of the taxable gain realized on the sale, (b) distributing gains to the shareholders with no tax to us or (c) treating net long-term capital gains as having been distributed to our shareholders, paying the tax on the gain deemed distributed and allocating the tax paid as a credit to our shareholders.
Generally, and subject to our ongoing qualification as a REIT, no provisions for income taxes are necessary except for taxes on undistributed taxable income and taxes on the income generated by our taxable REIT subsidiaries (“TRSs”). Our TRSs are subject to corporate U.S. federal, state and local income tax on their taxable income at regular statutory rates (see note 1 to the consolidated financial statements for further disclosure).
Americans with Disabilities Act ("ADA")
The properties in our portfolio must comply with Title III of the ADA, to the extent that such properties are “public accommodations” as defined by the ADA. The ADA may require removal of structural barriers to access by persons with disabilities in certain public areas of our properties where such removal is readily achievable. We believe that our properties are in substantial compliance with the ADA and that we will not be required to make substantial capital expenditures to address the requirements of the ADA. However, noncompliance with the ADA could result in imposition of fines or an award of damages to private litigants. The obligation to make readily accessible accommodations is an ongoing one, and we will continue to assess our properties and make alterations as appropriate in this respect.
Fair Housing Act ("FHA")
The FHA, its state law counterparts and the regulations promulgated by the U.S. Department of Housing and Urban Development and various state agencies, prohibit discrimination in housing on the basis of race or color, national origin, religion, sex, familial status (including children under the age of 18 living with parents or legal custodians, pregnant women and people securing custody of children under 18) or handicap (disability) and, in some states, financial capability or other bases. A failure to comply with these laws in our operations could result in litigation, fines, penalties or other adverse claims, or could result in limitations or restrictions on our ability to operate, any of which could materially and adversely affect us. We believe that we operate our properties in substantial compliance with the FHA.
Environmental Matters
We are subject to numerous federal, state and local environmental, health, safety and zoning laws and regulations that govern our operations, including with respect to air emissions, wastewater, and the use, storage and disposal of hazardous and toxic substances and petroleum products. If we fail to comply with such laws, including if we fail to obtain any required permits or licenses, we could face substantial fines or possible revocation of our authority to conduct some of our operations.
In addition, under various federal, state and local laws and regulations relating to the environment, as a current or former owner or operator of real property, we may be liable for costs and damages resulting from the presence or discharge of hazardous or toxic substances, waste or petroleum products at, on, in, under, or migrating from such property, including costs to investigate and clean up such contamination and liability for natural resources damage. In addition, we also may be liable for the costs of remediating contamination at off-site waste disposal facilities to which we have arranged for the disposal or treatment of hazardous substances, without regard to whether we complied with environmental laws in doing so. Such laws often impose liability without regard to whether the owner or operator knew of, or was responsible for, the presence of such contamination, and the liability may be joint and several. These liabilities could be substantial and the cost of any required remediation, removal, fines, or other costs could exceed the value of the property and/or our aggregate assets. In addition, the presence of contamination or the failure to remediate contamination at our properties may expose us to third-party liability for costs of remediation and/or bodily injury or property damage or materially adversely affect our ability to sell, lease or develop our properties or to borrow using the properties as collateral. In addition, environmental laws may create liens on contaminated sites in favor of the government for damages and costs it incurs to address such contamination. Moreover, if contamination is discovered on our properties, environmental laws may impose restrictions on the manner in which property may be used or businesses may be operated, and these restrictions may require substantial expenditures.
Availability of Reports
Copies of this Annual Report on Form 10-K, as well as our Quarterly Reports on Form 10-Q, Current Reports on Form 8-K and any amendments to such reports are available, free of charge, on our website www.washreit.com. All required reports are made available on the website as soon as reasonably practicable after they are electronically filed with or furnished to the Securities and Exchange Commission. The reference to our website address does not constitute incorporation by reference of the information contained in the website and such information should not be considered part of this document.
The Securities and Exchange Commission maintains a website (http://www.sec.gov) that contains reports, proxy statements, information statements, and other information regarding issuers that file electronically with Securities and Exchange Commission.
ITEM 1A: RISK FACTORS
| | |
Set forth below are the risks that we believe are material to our shareholders. We refer to the shares of beneficial interest in WashREIT as our “common shares,” and the investors who own shares as our “shareholders.” This section includes or refers to certain forward-looking statements. You should refer to the explanation of the qualifications and limitations on such forward-looking statements beginning on page 43. |
Risks Related to the novel coronavirus (COVID-19)
The current outbreak of COVID-19, and the resulting volatility it has created, has disrupted our business and we expect that the COVID-19 pandemic, will significantly and adversely impact our business, financial condition and results of operations going forward, and that other potential pandemics or outbreaks, could materially adversely affect our business, financial condition, results of operations and cash flows in the future. Further, the spread of the COVID-19 outbreak has caused severe disruptions in the U.S. and global economy and financial markets and could potentially create widespread business continuity issues of an unknown magnitude and duration.
Since being reported in December 2019, COVID-19 has spread globally, including to every state in the United States. On March 11, 2020, the World Health Organization declared COVID-19 a pandemic, and on March 13, 2020, the United States declared a national emergency with respect to COVID-19.
The COVID-19 pandemic has had, and COVID-19, any mutation thereof, and any future pandemic will continue to have repercussions across regional and global economies and financial markets. The global impact of the outbreak has been rapidly evolving and many countries, including the United States (including the states and cities that comprise the Washington metro region, where we own properties and have development sites), have at times also instituted quarantines, shelter-in-place rules, and restrictions on travel, the types of business that may continue to operate, and/or the types of construction projects that may continue. As a result, the COVID-19 pandemic is negatively impacting most industries, both inside and outside the Washington metro region, directly or indirectly. Since the beginning of the pandemic, a number of our commercial tenants have announced temporary closures of their offices or stores and requested rent deferral or rent abatement. In addition, jurisdictions in the Washington metro region have implemented or may implement rent freezes or other similar restrictions. The full extent of the impact on our business is largely uncertain and dependent on a number of factors beyond our control, including a potential increase in the number of cases in the Washington metro region, as a result of this year's flu season or otherwise.
The COVID-19 outbreak has caused and continues to cause severe disruptions in the U.S. and global economy and financial markets and could potentially create widespread business continuity issues of an as yet unknown magnitude and duration. COVID-19 has disrupted our business and is expected to continue to have a significant adverse effect on our business, financial performance and condition, operating results and cash flows due to, among other factors:
•a decrease in real estate rental revenue (our primary source of operating cash flow), as a result of temporary rent increase freezes impacting new and renewal rental rates on multifamily properties, longer lease-up periods for both anticipated and unanticipated vacancies, including as a result of a shift from physical to virtual tours, lower revenue recognized as a result of the waiver of late fees and a reduction in parking revenue, as well as our tenants’ ability and willingness to pay rent, increased credit losses, and our ability to continue to collect rents, on a timely basis or at all (for example, 1% of contractual cash rents in our office portfolio, 3% of contractual cash rents in our retail portfolio and 1% of contractual cash rents in our multifamily portfolio were uncollected for the fourth quarter of 2020, as of January 31, 2021);
•a complete or partial closure of one or more of our properties resulting from government or tenant action (as of February 11, 2021, all of our commercial properties are operating on a limited basis pursuant to local government orders, except for essential businesses);
•reductions in demand for commercial space in the Washington metro region and the inability to provide physical tours of either our commercial and multifamily spaces may result in our inability to renew leases, re-lease space as leases expire, or lease vacant space, particularly without concessions, or a decline in rental rates on new leases, particularly at our retail assets;
•the inability of one or more major tenants or a significant number of smaller tenants to pay rent, or the bankruptcy or insolvency of one or more major tenants or a significant number of smaller tenants, due to a downturn in their businesses or a weakening of financial condition related to the pandemic;
•the inability to decrease certain fixed expenses at our properties despite decreased operations at such properties;
•the inability of our third-party service providers to adequately perform their property management and/or leasing activities at our properties due to decreased on-site staff or other COVID-19-related challenges;
•difficulty accessing debt and equity capital on attractive terms, or at all, and a severe disruption and instability in the global financial markets or deterioration in credit and financing conditions, which may affect our access to capital and our commercial tenants' ability to fund their business operations and meet their obligations to us;
•the financial impact of the COVID-19 pandemic could negatively impact our future compliance with financial covenants of debt agreements;
•a decline in the market value of real estate in the Washington metro region may result in the carrying value of certain real estate assets exceeding their fair value, which may require us to recognize an impairment to those assets;
•future delays in the supply of products, services or liquidity may negatively impact our ability to complete the development, redevelopment, renovations and lease-up of our properties on schedule or for their original estimated cost;
•loss of cash balances that we periodically invest in a variety of short-term investments in order to preserve principal and maintain a high degree of liquidity while providing current income could result in a lower level of liquidity;
•a general decline in business activity and demand for real estate transactions could adversely affect our ability or desire to grow or change the complexion of our portfolio of properties;
•our insurance may not cover loss of revenue or other expenses resulting from the pandemic and related shelter-in-place rules;
•unanticipated costs and operating expenses and decreased anticipated and actual revenue related to compliance with regulations, such as additional expenses related to staff working remotely, requirements to provide employees with additional mandatory paid time off and increased expenses related to sanitation measures performed at each of our properties, as well as additional expenses incurred to protect the welfare of our employees, such as expanded access to health services;
•the potential for our employees, particularly our key personnel and property management teams, to become sick with COVID-19 which could adversely affect our business;
•the increased vulnerability to cyber-attacks or cyber intrusions while employees are working remotely has the potential to disrupt our operations or cause material harm to our financial condition; and
•complying with REIT requirements during a period of reduced cash flow could cause us to liquidate otherwise attractive investments or borrow funds on unfavorable conditions.
The significance, extent and duration of the impact of COVID-19 remains largely uncertain and dependent on future developments that cannot be accurately predicted at this time, such as a potential increase in cases in the Washington metro region, the continued severity, duration, transmission rate and geographic spread of COVID-19, the extent and effectiveness of the containment measures taken, the timing, effectiveness and availability of vaccines, and the response of the overall economy, the financial markets and the population, particularly in the Washington metro region, once the current containment measures are lifted.
The ongoing volatility of this situation may limit our ability to make predictions as to the ultimate adverse impact of COVID-19 on us. As a result, we cannot provide an estimate of the overall impact of the COVID-19 pandemic on our business or when, or if, we will be able to resume normal operations. Nevertheless, COVID-19 presents material uncertainty and risk with respect to our business, financial performance and condition, operating results and cash flows.
Risks Related to our Business and Operations
Our performance and value are subject to risks associated with our real estate assets and with the real estate industry, which could adversely affect our cash flow and ability to make distributions to our shareholders.
Our financial performance and the value of our real estate assets are subject to the risk that our properties do not generate revenues sufficient to meet our operating expenses, debt service and capital expenditures, which could cause our cash flow and ability to make distributions to our shareholders to be adversely affected. The following factors, among others, may adversely affect the cash flow generated by our multifamily and commercial properties:
•declines in the financial condition of our tenants;
•significant job losses in the professional/business services industries or government;
•competition from similar asset class properties;
•local real estate market conditions, such as oversupply or reduction in demand for multifamily and commercial properties; and
•civil disturbances, earthquakes and other natural disasters, terrorist acts or acts of war.
Additionally, complying with the REIT requirements may cause us to forgo and/or liquidate otherwise attractive investments. These actions could have the effect of reducing our income and amount available for distribution to shareholders. Thus, compliance with the REIT requirements may hinder our ability to make, or, in certain cases, maintain ownership of, certain attractive investments.
We may also face potential adverse effects from bankruptcies or insolvencies of major tenants and could face potential difficulties in leasing or re-leasing such tenants' associated space.
Lastly, in addition, a significant economic downturn over a period of time could result in an event or change in circumstances that results in an impairment in the value of our properties. An impairment loss is recognized if the carrying amount of the asset is not recoverable over its expected holding period and exceeds its fair value.
Any of these events could affect our cash flow and ability to make distributions to our shareholders.
We are dependent upon the economic and regulatory climate of the Washington metro region, which may impact our profitability and may limit our ability to meet our financial obligations when due and/or make distributions to our shareholders.
All of the properties in our portfolio are located in the Washington metro region and such concentration may expose us to a greater amount of market dependent risk than if we were geographically diverse. General economic conditions and local real estate conditions in the Washington metro region are dependent upon various industries that are predominant in our area (such as government and professional/business services). A downturn in one or more of these industries may have a particularly strong effect on the economic climate of our region. Additionally, we are susceptible to adverse developments in the Washington, D.C. regulatory environment, such as increases in real estate and other taxes, the costs of complying with governmental regulations or increased regulations and actual or threatened reductions in federal government spending and/or changes to the timing of government spending, as has occurred during federal government shutdowns. In the event of negative economic and/or regulatory changes in our region, we may experience a negative impact to our profitability and may be limited in our ability to meet our financial obligations when due and/or make distributions to our shareholders.
The composition of our portfolio by asset class may change over time, which could expose us to different asset class risks than if our portfolio composition remained static.
We own multifamily and commercial assets, with multifamily and office representing approximately 94% of our net operating income for the year ended December 31, 2020, and approximately 93% of our portfolio based on square footage as of December 31, 2020. If the composition of our portfolio changes, then we would become more exposed to the risks and markets of other asset classes. If we are successful in executing the strategic capital allocation plan, then we will become more exposed to the risks of the multifamily and office markets, any of which could have a material adverse effect on us.
We may be adversely affected by any significant reductions in federal government spending or actual or threatened changes to the timing of federal government spending, which could have an adverse effect on our financial condition, results of operations, cash flows and ability to make distributions to our shareholders.
As a REIT focused on the Washington metro region, a significant portion of our properties is occupied by tenants that directly or indirectly serve the U. S. Government as federal contractors or otherwise. A significant reduction in federal government spending, particularly a sudden decrease due to a sequestration process or due to extended uncertainty in the political climate in a way that affects the federal appropriations process by decreasing, delaying or making uncertain the results, stability and timing of federal appropriations, could adversely affect the ability of these tenants to fulfill lease obligations or decrease the likelihood that they will renew their leases with us. Further, economic conditions in the Washington metro region are significantly dependent upon the level of federal government spending in the region as a whole. In the event of an actual or anticipated significant reduction in federal government spending or change in the timing of federal government spending, there could be negative economic changes in our region, which could adversely impact the ability of our tenants to meet their financial obligations under our leases or the likelihood of their lease renewals. As a result, if such a reduction in federal government spending or actual or threatened change to the timing of federal government spending were to occur or be anticipated for an extended period, we could experience an adverse effect on our financial condition, results of operations, cash flows and ability to make distributions to our shareholders.
We face potential difficulties or delays renewing leases or re-leasing space, and as a result, our financial condition, results of operations, cash flow and our ability to satisfy our principal and interest obligations and to make distributions to our shareholders could be adversely affected.
As of December 31, 2020, the percentage of leased square footage of our commercial properties scheduled to expire is as set forth in the lease expiration tables on page 8, with a total of 26% and 27% of our office and retail leases scheduled to expire in the two years following December 31, 2020. Multifamily properties are leased under operating leases with terms of generally one year or less. For each the three years ended December 31, 2020, 2019 and 2018, the multifamily tenant retention rate was 54%, 55%, and 55%, respectively.
Difficulties or delays renewing leases or releasing space, including as a result of our inability to provide physical tours of either our commercial and multifamily spaces as a result of COVID-19, could impact our financial condition and ability to make distributions to our shareholders. We derive substantially all of our income from rent received from tenants. If our tenants decide not to renew their leases, we may face delays or difficulties re-leasing the space. If tenants decide to renew their leases, the terms of renewals, including the cost of required improvement allowances or concessions, may be less favorable to WashREIT than current lease terms. If the rental rates of our properties decrease, our existing tenants do not renew their leases (refer to the list of our ten largest tenants as of December 31, 2020 in "Part I - Item 1. Business", which collectively represented 12% of our revenue for the year ended December 31, 2020) or we do not re-lease a significant portion of our available and soon-to-be-available space, our financial condition, results of operations, cash flow and our ability to satisfy our principal and interest obligations and to make distributions to our shareholders could be adversely affected.
Occupancy levels and market rents at our multifamily properties could be negatively affected by competition with other housing alternatives and various political, economic and market conditions, which could adversely affect our results of operations and our financial condition.
Our multifamily properties compete with numerous housing alternatives in attracting residents, including owner occupied single and multifamily homes. Occupancy levels and market rents may be adversely affected by national and local political, economic and market conditions including, without limitation, migration to areas outside of major metropolitan areas like the Washington metro region, where our portfolio is concentrated, new construction and excess inventory of multifamily and owned housing/condominiums, increasing portions of owned housing/condominium stock being converted to rental use, rental housing subsidized by the government, other government programs that favor single family rental housing or owner occupied housing over multifamily rental housing, governmental regulations, slow or negative employment growth and household formation, the availability of low-interest mortgages or the availability of mortgages requiring little or no down payment for single family home buyers, changes in social preferences and the potential for geopolitical instability, all of which are beyond our control. Finally, the federal government’s policies, many of which may encourage home ownership, can increase competition and could possibly limit our ability to raise rents in our markets and therefore lower the value of our properties. Competitive housing in a particular area and increased affordability of owner occupied single and multifamily homes could adversely affect our ability to retain our current residents, attract new ones or increase or maintain rents, which could adversely affect our results of operations and our financial condition.
Real estate investments are illiquid, and we may not be able to sell our properties on a timely basis when we determine it is appropriate to do so, which could negatively impact our profitability.
Real estate investments can be difficult to sell and convert to cash quickly, especially if market conditions are not favorable. Such illiquidity could limit our ability to quickly change our portfolio of properties in response to changes in economic or other conditions. Moreover, the REIT tax laws require that we hold our properties for investment, rather than primarily for sale in the ordinary course of business, which may cause us to forego or defer property sales that otherwise would be in our best interest. Due to these factors, we may be unable to sell a property at an advantageous time or on the terms anticipated which could negatively impact our profitability.
Rent control or rent stabilization legislation and other regulatory restrictions may limit our ability to increase rents and pass through new or increased operating costs to our tenants.
Certain states and municipalities, including Washington, D.C., have adopted laws and regulations imposing restrictions on the timing or amount of rent increases or have imposed regulations relating to low- and moderate-income housing. Such laws and regulations limit our ability to charge market rents, increase rents, evict tenants or recover increases in our operating expenses at our residential properties and could make it more difficult for us to dispose of properties in certain circumstances. Similarly, compliance procedures associated with rent control statutes and low- and moderate-income housing regulations could have a negative impact on our operating costs, and any failure to comply with low- and moderate-income housing regulations could
result in the loss of certain tax benefits and the forfeiture of rent payments. In addition, such low- and moderate-income housing regulations often require us to rent a certain number of units at below-market rents, which has a negative impact on our ability to increase cash flows from our residential properties subject to such regulations. Furthermore, such regulations may negatively impact our ability to attract higher-paying tenants to such properties. As of December 31, 2020, two of our residential properties were subject to such regulations.
We face risks associated with property development/redevelopment, which could have an adverse effect on our financial condition, results of operations or ability to satisfy our debt service obligations.
We may, from time to time, engage in development and redevelopment activities, some of which may be significant. Developing or redeveloping properties presents a number of risks for us, including risks relating to necessary permitting, risks relating to development and construction costs and/or permanent financing, risks relating to completing the project on schedule, or at all, and risks related to occupancy rates at the completed property.
Properties developed or acquired for development may generate little or no cash flow from the date of acquisition through the date of completion of development. In addition, new development activities, regardless of whether or not they are ultimately successful, may require a substantial portion of management’s time and attention.
These risks could result in substantial unanticipated delays or expenses and, under certain circumstances, could prevent completion of development activities once undertaken. The materialization of any of the foregoing risks could have an adverse effect on our financial condition, results of operations or ability to satisfy our debt service obligations.
We face risks associated with property acquisitions.
We may acquire properties which would increase our size and could alter our capital structure. In addition, our acquisition activities and results may be exposed to the following risks:
•we may have difficulty finding properties that are consistent with our strategies and that meet our standards;
•we may have difficulty negotiating with new or existing tenants;
•we may be unable to finance acquisitions on favorable terms or at all;
•the occupancy levels, lease-up timing and rental rates of acquired properties may not meet our expectations;
•even if we enter into an acquisition agreement for a property, we may be unable to complete that acquisition after making a non-refundable deposit and incurring certain other acquisition-related costs;
•we may be unable to acquire a desired property at all or at the desired purchase price because of competition from other real estate investors, including publicly traded real estate investment trusts, institutional investment funds and private investors;
•the timing of property acquisitions may lag the timing of property dispositions, leading to periods of time where projects' proceeds are not invested as profitably as we desire;
•we may be unable to quickly and efficiently integrate new acquisitions, particularly acquisitions of portfolios of properties, into our existing operations;
•we may assume liabilities for undisclosed environmental contamination;
•our estimates of capital expenditures required for an acquired property, including the costs of repositioning or redeveloping, may be inaccurate and the acquired properties may fail to perform as we expected in analyzing our investments; and
•we could experience a decline in value of the acquired assets after acquisition.
We may acquire properties subject to liabilities and without recourse, or with limited recourse with respect to unknown liabilities. As a result, if liability were asserted against us based upon the acquisition of a property, we may have to pay substantial sums to settle it, which could adversely affect our cash flow.
We face risks associated with third-party service providers, which could negatively impact our profitability.
We enter into arrangements from time to time by which various service providers conduct day-to-day property management and/or leasing activities at our properties. Currently, all of our multifamily properties are managed by third-party service providers. Failure of such service providers to adequately perform their contracted services could negatively impact our ability to retain tenants or lease vacant space. As a result, any such failure could negatively impact our profitability.
Climate change and regulation regarding climate change in the Washington metro region may adversely affect our financial condition, results of operations, cash flows, per share market price of our common shares and our ability to satisfy our principal and interest obligations and to make distributions to our shareholders.
Climate change (including rising sea levels, flooding, extreme weather, and changes in precipitation and temperature), may result in physical damage to, a decrease in demand for and/or a decrease in rent from and value of our properties located in the areas affected by these conditions. Additionally, our insurance premiums may increase as a result of the threat of climate change or the effects of climate change may not be covered by our insurance policies.
Changes in federal and state legislation and regulations on climate change could result in utility expenses and/or capital expenditures to improve the energy efficiency of our existing properties or other related aspects of our properties in order to comply with such regulations or otherwise adapt to climate change. The District of Columbia, Arlington County, Virginia, Fairfax County, Virginia, and Montgomery County, Maryland, each have made formal public commitments to carbon reduction. To enforce this commitment, the Washington, D.C. City Council passed the DC Clean Energy Omnibus bill. The bill requires that all electricity purchased in the District be renewable by 2032 and sets a building energy performance standard requiring certain buildings to meet certain minimum energy efficiency standards. Under the District of Columbia’s Building Energy Performance Standards, all existing buildings over 50,000 square feet will be required to reach minimum levels of energy efficiency or deliver savings by 2026, with progressively smaller buildings phasing into compliance over the following years. This regulation may require unplanned capital improvements, and increased engagement to manage occupant energy use, which is a large driver of building performance. If our properties cannot meet performance standards, they risk fines for non-compliance, as well as a decrease in demand and a decline in value. As a result, our financial condition, results of operations, cash flows, per share market price of our common shares and our ability to satisfy our principal and interest obligations and to make distributions to our shareholders could be adversely affected.
Some potential losses are not covered by insurance, which could adversely affect our financial condition or cash flow.
We carry insurance coverage on our properties of types and in amounts that we believe are in line with coverage customarily obtained by owners of similar properties. We believe all of our properties are adequately insured. The property insurance that we maintain for our properties has historically been on an “all risk” basis, which is in full force and effect until renewal in March 2021 for our Assembly portfolio and August 2021 for all other properties. There are other types of losses, such as from wars or catastrophic events, for which we cannot obtain insurance at all or at a reasonable cost.
We have an insurance policy that has no terrorism exclusion, except for non-certified nuclear, chemical and biological acts of terrorism. Our financial condition and results of operations are subject to the risks associated with acts of terrorism and the potential for uninsured losses as the result of any such acts.
Property ownership also involves potential liability to third parties for such matters as personal injuries occurring on the property. Such losses may not be fully insured. In addition to uninsured losses, various government authorities may condemn all or parts of operating properties. Such condemnations could adversely affect the viability of such projects. Any such uninsured loss could adversely affect our financial condition or cash flow.
In the event of an uninsured loss or a loss in excess of our insurance limits, we could lose both the revenues generated from the affected property and the capital we have invested in the affected property. Depending on the specific circumstances of the affected property it is possible that we could be liable for any mortgage indebtedness or other obligations related to the property. Any such loss could adversely affect our business and financial condition and results of operations. Additionally, any material increase in insurance rates or decrease in available coverage in the future could adversely affect our results of operations and financial condition.
Actual or threatened terrorist attacks may adversely affect our ability to generate revenues and the value of our properties.
All of the properties in our portfolio are located in or near Washington, D.C., a metropolitan area that has been and may in the future be the target of actual or threatened terrorism attacks. As a result, some tenants in our market may choose to relocate their businesses to other markets. This could result in an overall decrease in the demand for commercial space in this market generally, which could increase vacancies in our properties or necessitate that we lease our properties on less favorable terms, or both. In addition, future terrorist attacks in or near Washington, D.C. could directly or indirectly damage such properties, both physically and financially, or cause losses that materially exceed our insurance coverage. As a result of the foregoing, our ability to generate revenues and the value of our properties could decline materially which would negatively affect our results of operations.
Certain federal, state and local laws and regulations may cause us to incur substantial costs or subject us to potential liabilities.
We are subject to certain compliance costs and potential liabilities under various U.S. federal, state and local environmental, health, safety and zoning laws and regulations. These laws and regulations govern our and our tenants’ operations including with respect to air emissions, wastewater disposal, and the use, storage and disposal of hazardous and toxic substances and petroleum products, including in storage tanks that power emergency generators. If we fail to comply with such laws, including if we fail to obtain any required permits or licenses, we could face substantial fines or possible revocation of our authority to conduct some of our operations.
In addition, various environmental laws impose liability on a current or former owner or operator of real property for investigation, removal or remediation of hazardous or toxic substances or petroleum products at our currently or formerly owned or leased real property, regardless of whether or not we knew of, or caused, the presence or release of such substances. Liability under these laws may be joint and several, meaning that we could be required to bear 100% of the liability even if other parties are also liable. From time to time, we may be required to remediate such substances or remove, abate or manage asbestos, mold, radon gas, lead or other hazardous conditions at our properties. The presence or release of such toxic or hazardous substances or petroleum products at our currently owned or leased properties could result in limitations on or interruptions to our operations, and releases at our currently or formerly owned or leased properties could result in in third-party claims for bodily injury, property or natural resource damages, or other losses, including liens in favor of the government for costs the government incurs in cleaning up contamination. In addition, we also may be liable for the costs of remediating contamination at off-site waste disposal facilities to which we have arranged for the disposal, or treatment of hazardous substances without regard to whether we complied with environmental laws in doing so. It is our policy to retain independent environmental consultants to conduct Phase I environmental site assessments and asbestos surveys prior to our acquisition of properties. However, there is a risk that these assessments will not identify all potential environmental issues at a given property. Moreover, environmental, health and safety requirements have become increasingly stringent, and our costs may increase as a result. New or revised laws and regulations or new interpretations of existing laws and regulations, such as those related to climate change, could affect the operation of our properties or result in significant additional expense and operating restrictions on our properties or adversely affect our ability to sell properties or to use properties as collateral.
We may also incur significant costs complying with other regulations. In addition, failure of our properties to comply with the Americans with Disabilities Act (“ADA”) could result in injunctive relief, fines, an award of damages to private litigants or mandated capital expenditures to remedy such noncompliance. Any imposition of injunctive relief, fines, damage awards or capital expenditures could adversely impact our business or results of operations. Our properties are subject to various other federal, state and local regulatory requirements, such as state and local fair housing, rent control and fire and life safety requirements. If we fail to comply with the requirements of the ADA or other federal, state and local regulations, we could be subject to fines, penalties, injunctive action, reputational harm and other business effects which could materially and negatively affect our performance and results of operations.
We face cybersecurity risks which have the potential to disrupt our operations, cause material harm to our financial condition, result in misappropriation of assets, compromise confidential information and/or damage our business relationships and can provide no assurance that the steps we and our service providers take in response to these risks will be effective.
We face cybersecurity risks, such as cyber-attacks, malware, social engineering, phishing schemes or bad actors inside our organization. The risk of a security breach or disruption, or another cyber-attack, including by computer hackers, nation-state affiliated actors, and cyber terrorists, has generally increased as the number, intensity and sophistication of attempted attacks around the world have increased. These incidents may result in disruption of our operations, material harm to our financial condition, cash flows and the market price of our common shares, misappropriation of assets, compromise or corruption of confidential information collected in the course of conducting our business, liability for stolen information or assets, increased cybersecurity protection and insurance costs, regulatory enforcement, litigation and damage to our stakeholder relationships. These risks require increasing resources from us to analyze and mitigate, and there is no assurance that our efforts will be effective. Additionally, we rely on third-party service providers in our conduct of our business and we can provide no assurance that the security measures of those providers will be effective.
In the normal course of business, we and our service providers collect and retain certain personal information provided by our tenants, employees and vendors. We can provide no assurance that our data security measures will be able to prevent unauthorized access to this personal information. In addition to the risks discussed above related to a breach of confidential information, a breach of personal information may result in regulatory fines and orders, obligations to notify individuals or litigation risks.
Risks Related to Financing
We face risks associated with the use of debt, including refinancing risk.
We rely on borrowings under our credit facility, mortgage notes, and debt securities to finance acquisitions and development activities and for general corporate purposes. In the past, the commercial real estate debt markets have experienced significant volatility due to a number of factors, including the tightening of underwriting standards by lenders and credit rating agencies and the reported significant inventory of unsold mortgage-backed securities in the market. The volatility resulted in investors decreasing the availability of debt financing as well as increasing the cost of debt financing. These conditions, which increase the cost and reduce availability of debt, may continue to worsen in the future. Circumstances could again arise in which we may not be able to obtain debt financing in the future on favorable terms, or at all. If we were unable to borrow under our credit facility or to refinance existing debt financing, our financial condition and results of operations would likely be adversely affected. Similarly, global equity markets have experienced significant price volatility and liquidity disruptions in recent years, and similar circumstances could significantly and negatively impact liquidity in the financial market in the future. Any disruption could negatively impact our ability to access additional financing at reasonable terms or at all.
We anticipate that only a small portion of the principal of our debt will be repaid prior to maturity. Therefore, we are likely to need to refinance a significant portion of our outstanding debt as it matures. There is a risk that we may not be able to refinance existing debt or that the terms of any refinancing will not be as favorable as the terms of the existing debt. If principal payments due at maturity cannot be refinanced, extended or repaid with proceeds from other sources, such as new equity capital, our cash flow may not be sufficient to repay all maturing debt in years when significant “balloon” payments come due. In addition, we may rely on debt to fund a portion of our new investments such as our acquisition and development activity. There is a risk that we may be unable to finance these activities on favorable terms or at all. The materialization of any of the foregoing risks would adversely affect our financial condition and results of operations.
Our degree of leverage could limit our ability to obtain additional financing, affect the market price of our common shares or debt securities or otherwise adversely affect our financial condition.
On February 11, 2021, our total consolidated debt was approximately $1.0 billion. Using the closing share price of $23.53 per share of our common shares on February 11, 2021, multiplied by the number of our common shares, our consolidated debt to total consolidated market capitalization ratio was approximately 34% as of February 11, 2021.
Our degree of leverage could affect our ability to obtain additional financing for working capital, capital expenditures, acquisitions, development or other general corporate purposes. Our senior unsecured debt is currently rated investment grade by two major rating agencies. However, there can be no assurance that we will be able to maintain this rating, and in the event our senior debt is downgraded from its current rating, we would likely incur higher borrowing costs and/or difficulty in obtaining additional financing. Our degree of leverage could also make us more vulnerable to a downturn in business or the economy generally. There is a risk that changes in our debt to market capitalization ratio, which is in part a function of our share price, or our ratio of indebtedness to other measures of asset value used by financial analysts, may have an adverse effect on the market price of our equity or debt securities.
Additionally, payments of principal and interest on borrowings may leave us with insufficient cash resources to operate our properties, fully implement our capital expenditure, acquisition and redevelopment activities, or meet the REIT distribution requirements imposed by the Code.
Failure to effectively hedge against interest rate changes may adversely affect our financial condition, results of operations, cash flow, per share market price of our common shares and ability to make distributions to our shareholders and agreements we enter into to protect us from rising interest rates expose us to counterparty risk.
We enter into hedging transactions to protect ourselves from the effects of interest rate fluctuations on variable rate debt. Our hedging transactions include entering into agreements such as interest rate swaps, caps, floors and other interest rate exchange contracts. These agreements involve risks, such as the risk that such arrangements would not be effective in reducing our exposure to interest rate changes or that a court could rule that such an agreement is not legally enforceable. In addition, interest rate hedging can be expensive, particularly during periods of rising and volatile interest rates. Failure to hedge effectively against interest rate changes could materially adversely affect our financial condition, results of operations, cash flow, per share trading price of our common shares and ability to make distributions to our shareholders. While such agreements are intended to lessen the impact of rising interest rates on us, they could also expose us to the risk that the other parties to the agreements would not perform, and that the hedging arrangements may not be effective in reducing our exposure to interest rate changes. In addition, the REIT provisions of the Code may limit use of certain hedging techniques that might otherwise be advantageous or
push us to implement those hedges through a TRS, which would increase the cost of our hedging activities. Moreover, there can be no assurance that our hedging arrangements will qualify as highly effective cash flow hedges under Financial Accounting Standards Board ("FASB"), Accounting Standards Codification ("ASC") Topic 815, Derivatives and Hedging, or that our hedging activities will have the desired beneficial impact on our results of operations. Should we desire to terminate a hedging agreement, there could be significant costs and cash requirements involved to fulfill our obligation under the hedging agreement.
The future of the reference rate used in our existing floating rate debt instruments and hedging arrangements is uncertain, which could hinder our ability to maintain effective hedges and could adversely impact our business operations and financial results.
Our floating-rate debt and certain hedging transactions determine the applicable interest rate or payment amount by reference to a benchmark rate, such as the London Interbank Offered Rate (“LIBOR”), or to another financial metric. Our existing hedging arrangements currently use LIBOR as a reference rate, as calculated for U.S. dollar (“USD-LIBOR”). As of December 31, 2020, we had approximately $250.0 million of debt outstanding that was indexed to LIBOR.
In July 2017, the United Kingdom regulator that oversees LIBOR announced its intention to phase out LIBOR rates by the end of 2021, indicating that the continuation of LIBOR on the current basis cannot and will not be guaranteed after 2021. In April 2018, the New York Federal Reserve commenced publishing an alternative reference rate to LIBOR, as calculated for the U.S. dollar (“USD-LIBOR”), the Secured Overnight Financing Rate (“SOFR”), proposed by a group of major market participants convened by the U.S. Federal Reserve with participation by SEC Staff and other regulators. In October 2020, after a number of industry consultations, the International Swaps and Derivatives Association published a LIBOR transition protocol.
We can provide no assurance regarding the future of LIBOR, whether our current hedging arrangements will continue to use USD-LIBOR as a reference rate or whether any reliance on such rate will be appropriate. Confusion as to the relevant benchmark reference rate for our hedging instruments could hinder our ability to establish effective hedges.
Despite progress made to date by regulators and industry participants to prepare for the anticipated discontinuation of LIBOR, significant uncertainties still remain. Such uncertainties relate to, for example, whether LIBOR will continue to be viewed as an acceptable market benchmark rate, what rate or rates may become accepted alternatives to LIBOR (various characteristics of SOFR make it uncertain whether it would be viewed by market participants as an appropriate alternative to USD-LIBOR for certain purposes), how any replacement would be implemented across the industry, and the effect any changes in industry views or movement to alternative benchmarks would have on the markets for LIBOR-linked financial instruments.
We can provide no assurance regarding the future of LIBOR and when our current floating rate debt instruments and hedging arrangements will transition from LIBOR as a reference rate to SOFR (in the case of our floating rate debt instruments and hedging arrangements that determine the applicable interest rate or payment amount by reference to LIBOR-USD as a reference rate) or another reference rate. The discontinuation of a benchmark rate or other financial metric, changes in a benchmark rate or other financial metric, or changes in market perceptions of the acceptability of a benchmark rate or other financial metric, including LIBOR, could, among other things result in increased interest payments, changes to our risk exposures, or require renegotiation of previous transactions. In addition, any such discontinuation or changes, whether actual or anticipated, could result in market volatility, adverse tax or accounting effects, increased compliance, legal and operational costs, and risks associated with contract negotiations. In addition, confusion related to the transition from USD-LIBOR to SOFR or another replacement reference rate for our floating debt and hedging instruments could have an uncertain economic effect on these instruments, hinder our ability to establish effective hedges and result in a different economic value over time for these instruments than they otherwise would have had under USD-LIBOR.
Covenants in our debt agreements could adversely affect our financial condition.
Our credit facility and other debt instruments contains customary restrictions, requirements and other limitations on our ability to incur indebtedness. We must maintain certain ratios, including a maximum of total indebtedness to total asset value, a maximum of secured indebtedness to total asset value, a minimum of quarterly adjusted EBITDA to fixed charges, a minimum net operating income from unencumbered properties to unsecured interest expense, a maximum of unsecured indebtedness to unencumbered asset value and a minimum of total unencumbered assets to total unsecured indebtedness. Our ability to borrow under our credit facility is subject to compliance with our financial and other covenants.
Failure to comply with any of the covenants under our unsecured credit facility or other debt instruments (including our indenture and our notes purchase agreement) could result in a default under one or more of our debt instruments. If we fail to comply with the covenants in our unsecured credit facility or other debt instruments, other sources of capital may not be
available to us or be available only on unattractive terms. In addition, if we breach covenants in our debt agreements, the lenders can declare a default and, if the debt is secured, take possession of the property securing the defaulted loan.
Any default or cross-default events could cause our lenders to accelerate the timing of payments and/or prohibit future borrowings, either of which would have a material adverse effect on our business, operations, financial condition and liquidity.
Risks Related to Our Organizational Structure
Our charter and Maryland law contain provisions that may delay, defer or prevent a change in control of WashREIT, even if such a change in control may be in the best interest of our shareholders, and as a result may depress the market price of our common shares.
Provisions of the Maryland General Corporation Law ("MGCL") may limit a change in control which could prevent holders of our common shares from profiting as a result of such change in control. These provisions include:
•a provision where a corporation is not permitted to engage in any business combination with any “interested stockholder,” defined as any holder or affiliate of any holder of 10% or more of the corporation’s stock, for a period of five years after that holder becomes an “interested stockholder,” and
•a provision where the voting rights of “control shares” acquired in a “control share acquisition,” as defined in the MGCL, may be restricted, such that the “control shares” have no voting rights, except to the extent approved by a vote of holders of two-thirds of the common shares entitled to vote on the matter.
Our bylaws currently provide that the foregoing provision regarding "control share acquisitions" will not apply to WashREIT. However, our board of trustees could, in the future, modify our bylaws such that the foregoing provision regarding "control share acquisitions" would be applicable to WashREIT.
Additionally, Title 8, Subtitle 3 of the MGCL permits our board of trustees, without shareholder approval and regardless of what is currently provided in our declaration of trust or bylaws, to implement certain takeover defenses. These provisions may have the effect of inhibiting a third party from making an acquisition proposal for us or of delaying, deferring or preventing a change in control of us under the circumstances that otherwise could provide our common shareholders with the opportunity to realize a premium over the then current market price.
The stock ownership limits imposed by the Code for REITs and imposed by our charter may restrict our business combination opportunities that might involve a premium price for our common shares or otherwise be in the best interest of our shareholders.
The ownership of our shares must be restricted in several ways in order for us to maintain our qualification as a REIT under the Code. Our charter provides that no person (other than an excepted holder, as defined in our charter) may actually or constructively own more than 9.8% of the aggregate of our outstanding common shares by value or by number of shares, whichever is more restrictive, or 9.8% of the aggregate of the equity shares by value.
Our board of trustees has the authority under our charter to reduce these share ownership limits. Our board of trustees may, in its sole discretion, grant exemptions to the share ownership limits, subject to such conditions and the receipt by our board of trustees of certain representations and undertakings to ensure that our REIT qualification is not adversely affected. In addition to 9.8% (or any lower future percentage) share ownership limits, our charter also prohibits any person from (a) beneficially or constructively owning, as determined by applying certain attribution rules of the Code, our equity shares that would result in us being “closely held” under Section 856(h) of the Code (regardless of whether the interest is held during the last half of a taxable year) or that would otherwise cause us to fail to qualify as a REIT, or (b) transferring equity shares if such transfer would result in our equity shares being owned by fewer than 100 persons.
The share ownership limits contained in our charter are based on the ownership at any time by any “person,” which term includes entities and certain groups. The share ownership limitations in our charter are common in REIT charters and are intended to provide added assurance of compliance with the tax law requirements. However, the share ownership limits on our shares and our enforcement of them might delay, defer, prevent, or otherwise inhibit a transaction or a change in control of WashREIT, including a transaction that might involve a premium price for our common shares or that might otherwise be in the best interest of our shareholders.
Our rights and the rights of our shareholders to take action against our trustees and officers are limited, which could limit your recourse in the event of actions that you do not believe are in your best interests.
Maryland law provides that a trustee has no liability in that capacity if he or she satisfies his or her duties to us and our shareholders. Under current Maryland law, our trustees and officers will not have any liability to us or our shareholders for money damages, except for liability resulting from:
•actual receipt of an improper benefit or profit in money, property or services; or
•a final judgment based upon a finding of active and deliberate dishonesty by the trustee or officer that was material to the cause of action adjudicated.
In addition, our charter authorizes and our bylaws require us to indemnify our trustees for actions taken by them in those capacities to the maximum extent permitted by Maryland law. Our bylaws also authorize us to indemnify our officers for actions taken by them in those capacities to the maximum extent permitted by Maryland law. As a result, we and our shareholders may have more limited rights against our trustees and officers than might otherwise exist. Accordingly, in the event that actions taken in good faith by any of our trustees or officers impede the performance of WashREIT, your ability to recover damages from such trustees or officers will be limited with respect to trustees and may be limited with respect to officers. In addition, we will be obligated to advance the defense costs incurred by our trustees and our executive officers, and may, in the discretion of our board of trustees, advance the defense costs incurred by our officers, our employees and other agents, in connection with legal proceedings.
Risks Related to Our Common Shares
We cannot assure you we will continue to pay dividends at current rates and the failure to do so could have an adverse effect on the market price of our common shares.
Cash flows from operations are an important factor in our ability to sustain our dividend at its current rate. If our cash flows from operations were to decline significantly, we may have to borrow on our lines of credit to sustain the dividend rate or reduce our dividend. Our ability to continue to pay dividends on our common shares at their current rate or to increase our common share dividend rate will depend on a number of factors, including, among others, our future financial condition and results of operations and the terms of our debt covenants.
Our board of trustees considers, among other factors, trends in our levels of funds from operations, together with associated recurring capital improvements, tenant improvements, leasing commissions and incentives, and adjustments to straight-line rents to reflect cash rents received. If some or all of these factors were to trend downward for a sustained period of time, our board of trustees could determine to reduce our dividend rate. If we do not maintain or increase the dividend rate on our common shares in the future, it could have an adverse effect on the market price of our common shares.
Additionally, the market value of our securities can be adversely affected by many factors, including certain factors related to our REIT status.
The market value of our securities can be adversely affected by many factors.
As with any public company, a number of factors may adversely influence the public market price of our common shares. These factors include:
•level of institutional interest in us;
•perceived attractiveness of investment in us, in comparison to other REITs;
•perceived attractiveness of the Washington metro region, particularly if investors have a negative sentiment about the impact of election results on the region's economy;
•attractiveness of securities of REITs in comparison to other asset classes taking into account, among other things, that a substantial portion of REITs’ dividends may be taxed as ordinary income;
•our financial condition and performance;
•the market’s perception of our growth potential and potential future cash dividends;
•investor confidence in the stock and bond markets generally;
•national economic conditions and general stock and bond market conditions;
•government uncertainty, action or regulation;
•increases in market interest rates, which may lead investors to expect a higher annual yield from our distributions in relation to the price of our shares;
•uncertainty around and changes in U.S. federal tax laws;
•changes in our credit ratings; and
•any negative change in the level of our dividend or the partial payment thereof in common shares.
Risks Related to our Status as a REIT
The loss of our tax status as a REIT would have significant adverse consequences to us and the value of our common shares.
We believe that we qualify as a REIT and intend to continue to operate in a manner that will allow us to continue to qualify as a REIT. However, our charter provides that our board of trustees may revoke or otherwise terminate our REIT election, without the approval of our shareholders, if it determines that it is no longer in our best interest to continue to qualify as a REIT. Furthermore, we cannot assure you that we are qualified as a REIT, or that we will remain qualified as a REIT in the future. This is because qualification as a REIT involves the application of highly technical and complex provisions of the Code which include:
•maintaining ownership of specified minimum levels of real estate-related assets;
•generating specified minimum levels of real estate-related income;
•maintaining certain diversity of ownership requirements with respect to our shares; and
•distributing at least 90% of our "REIT taxable income" (determined before the deduction for dividends paid and excluding net capital gains) on an annual basis.
Only limited judicial and administrative interpretations of the REIT rules exist. In addition, qualification as a REIT involves the determination of various factual matters and circumstances not entirely within our control.
If we fail to qualify as a REIT, we could face serious tax consequences that could substantially reduce our funds available for payment of dividends for each of the years involved because:
•we would be subject to U.S. federal income tax at the regular corporate rate, without any deduction for dividends paid to shareholders in computing our taxable income, and possibly increased state and local taxes; and
•unless we are entitled to relief under statutory provisions, we would be disqualified from taxation as a REIT for the four taxable years following the year during which qualification was lost.
This treatment would reduce net earnings available for investment or distribution to shareholders because of the additional tax liability for the year (or years) involved. To the extent that distributions to shareholders had been made based on the assumption of our qualification as a REIT, we might be required to borrow funds or to liquidate certain of our investments to pay the applicable tax. As a result of these factors, our failure to qualify as a REIT could have a material adverse impact on our results of operations, financial condition and liquidity. If we fail to qualify as a REIT but are eligible for certain relief provisions, then we may retain our status as a REIT but may be required to pay a penalty tax, which could be substantial.
Dividends payable by REITs do not qualify for the reduced tax rates available for some dividends.
The maximum tax rate applicable to income from "qualified dividends" payable by non-REIT C corporations to U.S. shareholders that are individuals, trusts or estates generally is 20% (excluding the 3.8% net investment income tax). Dividends payable by REITs, however, generally are not eligible for the maximum 20% reduced rate and are taxed at applicable ordinary income tax rates, except to the extent that certain holding requirements have been met and a REIT's dividends are attributable to dividends received by a REIT from taxable corporations (such as a TRS), to income that was subject to tax at the REIT/corporate level, or to dividends properly designated by the REIT as “capital gain dividends.” For taxable years beginning before January 1, 2026, U.S. shareholders that are individuals, trusts or estates may deduct 20% of their dividends from REITs (excluding qualified dividend income and capital gains dividends). For those U.S. shareholders in the top marginal tax bracket of 37%, the deduction for REIT dividends yields an effective income tax rate of 29.6% (exclusive of the net investment income tax) on REIT dividends, which is higher than the 20% tax rate on qualified dividend income paid by non-REIT C corporations (although the maximum effective rate applicable to such dividends, after taking into account the 21% U.S. federal income tax rate applicable to non-REIT C corporations is 36.8% (exclusive of the 3.8% net investment income tax)). Although the reduced rates applicable to dividend income from non-REIT C corporations do not adversely affect the taxation of REITs or dividends payable by REITs, these reduced rates could cause investors who are non-corporate taxpayers to perceive investments in REITs to be relatively less attractive than investments in the shares of non-REIT C corporations that pay dividends, which could adversely affect the value of the stock of REITs, including our common shares.
The REIT distribution requirements could require us to borrow funds during unfavorable market conditions or subject us to tax, which would reduce the cash available for distribution to our shareholders.
In order to qualify as a REIT, we generally must distribute to our shareholders, on an annual basis, at least 90% of our "REIT taxable income," determined without regard to the deduction for dividends paid and excluding net capital gains. In addition, we will be subject to U.S. federal income tax at the regular corporate rate (currently 21%) to the extent that we distribute less than 100% of our net taxable income (including net capital gains) and will be subject to a 4% nondeductible excise tax on the amount by which our distributions in any calendar year are less than a minimum amount specified under U.S. federal income tax laws. We intend to continue to distribute our net income to our shareholders in a manner intended to satisfy the REIT 90% distribution requirement and to avoid U.S. federal income tax and the 4% nondeductible excise tax.
In addition, from time to time our taxable income may exceed our net income as determined by GAAP. This may occur, for instance, because realized capital losses are deducted in determining our GAAP net income, but may not be deductible in computing our taxable income. In addition, we may incur nondeductible capital expenditures or be required to make debt or amortization payments. As a result of the foregoing, we may generate less cash flow than taxable income in a particular year and we may incur U.S. federal income tax and the 4% nondeductible excise tax on that income if we do not distribute such income to shareholders in that year. In that event, we may be required to (i) use cash reserves, (ii) incur debt at rates or times that we regard as unfavorable, (iii) sell assets in adverse market conditions, (iv) distribute amounts that would otherwise be invested in future acquisitions, capital expenditures or repayment of debt, or (v) make a taxable distribution of our shares as part of a distribution in which shareholders may elect to receive our shares or (subject to a limit measured as a percentage of the total distribution) cash in order to satisfy the REIT 90% distribution requirement and to avoid U.S. federal income tax and the 4% nondeductible excise tax in that year. These alternatives could increase our costs or reduce our equity. Thus, compliance with the REIT requirements may hinder our ability to grow, which could adversely affect our business, financial condition and results of operations.
Even if we qualify as a REIT, we may face other tax liabilities that reduce our cash flow.
Even if we qualify for taxation as a REIT, we may be subject to certain U.S. federal, state and local taxes on our income, property or net worth, including taxes on any undistributed income, tax on income from some activities conducted as a result of a foreclosure, and state or local income, property and transfer taxes. Moreover, if we have net income from "prohibited transactions," that income will be subject to a 100% tax. The need to avoid prohibited transactions could cause us to forego or defer sales of properties that might otherwise be in our best interest to sell. In addition, we could, in certain circumstances, be required to pay an excise or penalty tax (which could be significant in amount) in order to utilize one or more relief provisions under the Code to maintain our qualification as a REIT. Any of these taxes would decrease cash available for the payment of our debt obligations and distributions to shareholders. Our TRSs generally will be subject to U.S. federal, state and local corporate income tax on their net taxable income.
There is a risk of changes in the tax law applicable to REITs which may adversely affect our taxation as a REIT and taxation of our shareholders.
The IRS, the United States Treasury Department and Congress frequently review U.S. federal income tax legislation, regulations and other guidance. We cannot predict whether, when or to what extent new U.S. federal tax laws, regulations, interpretations or rulings will be adopted. Any legislative action may prospectively or retroactively modify our tax treatment and, therefore, may adversely affect our taxation or taxation of our shareholders. We urge you to consult with your tax advisor with respect to the status of legislative, regulatory or administrative developments and proposals and their potential effect on an investment in our common shares.
ITEM 1B: UNRESOLVED STAFF COMMENTS
None.
ITEM 2: PROPERTIES
The schedule on the following pages lists our real estate investment portfolio as of December 31, 2020, which consisted of 43 properties and land held for development.
As of December 31, 2020, the percent leased is (i) for commercial properties, the percentage of net rentable area for which fully executed leases exist and may include signed leases for space not yet occupied by the tenant, and (ii) for multifamily properties, the percentage of units leased. Cost information is included in Schedule III to our financial statements included in this Annual Report on Form 10-K.
Schedule of Properties
| | | | | | | | | | | | | | | | | | | | | | | | | | | | | | | | | | | | | | | | | | | | |
| Properties | | Location | | Year Acquired | | Year Constructed/Renovated | | # of Units | | Net Rentable Square Feet | | Percent Leased, as of December 31, 2020 (1) | | Ending Occupancy, as of December 31, 2020 (1) |
| Multifamily Properties | | | | | | | | | | | | | | |
| Clayborne | | Alexandria, VA | | 2003 | | 2008 | | 74 | | | 60,000 | | | 98.6 | % | | 98.6 | % |
| Riverside Apartments | | Alexandria, VA | | 2016 | | 1971 | | 1,222 | | | 1,001,000 | | | 96.0 | % | | 94.6 | % |
| Assembly Alexandria | | Alexandria, VA | | 2019 | | 1990 | | 532 | | | 437,000 | | | 96.6 | % | | 95.7 | % |
| Cascade at Landmark | | Alexandria, VA | | 2019 | | 1988 | | 277 | | | 273,000 | | | 95.7 | % | | 93.5 | % |
| Park Adams | | Arlington, VA | | 1969 | | 1959 | | 200 | | | 173,000 | | | 95.5 | % | | 95.0 | % |
| Bennett Park | | Arlington, VA | | 2001 | | 2007 | | 224 | | | 215,000 | | | 96.0 | % | | 95.1 | % |
| The Maxwell | | Arlington, VA | | 2011 | | 2014 | | 163 | | | 116,000 | | | 96.9 | % | | 94.5 | % |
| The Paramount | | Arlington, VA | | 2013 | | 1984 | | 135 | | | 141,000 | | | 98.5 | % | | 95.6 | % |
| The Wellington | | Arlington, VA | | 2015 | | 1960 | | 711 | | | 600,000 | | | 96.1 | % | | 94.5 | % |
| Roosevelt Towers | | Falls Church, VA | | 1965 | | 1964 | | 191 | | | 170,000 | | | 96.9 | % | | 92.7 | % |
| The Ashby at McLean | | McLean, VA | | 1996 | | 1982 | | 256 | | | 274,000 | | | 96.5 | % | | 94.9 | % |
| Assembly Dulles | | Herndon, VA | | 2019 | | 2000 | | 328 | | | 361,000 | | | 96.6 | % | | 93.9 | % |
| Assembly Herndon | | Herndon, VA | | 2019 | | 1991 | | 283 | | | 221,000 | | | 95.4 | % | | 94.3 | % |
| Assembly Manassas | | Manassas, VA | | 2019 | | 1986 | | 408 | | | 390,000 | | | 97.3 | % | | 96.6 | % |
| Assembly Leesburg | | Leesburg, VA | | 2019 | | 1986 | | 134 | | | 124,000 | | | 96.3 | % | | 96.3 | % |
| Bethesda Hill Apartments | | Bethesda, MD | | 1997 | | 1986 | | 195 | | | 225,000 | | | 96.9 | % | | 96.9 | % |
| Assembly Germantown | | Germantown, MD | | 2019 | | 1990 | | 218 | | | 211,000 | | | 97.7 | % | | 97.2 | % |
| Assembly Watkins Mill | | Gaithersburg, MD | | 2019 | | 1975 | | 210 | | | 193,000 | | | 96.7 | % | | 96.2 | % |
| 3801 Connecticut Avenue | | Washington, D.C. | | 1963 | | 1951 | | 307 | | | 178,000 | | | 88.3 | % | | 86.3 | % |
| Kenmore Apartments | | Washington, D.C. | | 2008 | | 1948 | | 374 | | | 268,000 | | | 90.4 | % | | 89.0 | % |
| Yale West | | Washington, D.C. | | 2014 | | 2011 | | 216 | | | 173,000 | | | 96.8 | % | | 94.0 | % |
| Subtotal Stabilized Properties | | | | | | | | 6,658 | | | 5,804,000 | | | 95.7 | % | | 94.3 | % |
Trove (2) | | Arlington, VA | | 2015 | | 2020 | | 401 | | | 293,000 | | | 36.2 | % | | 34.7 | % |
| Subtotal All Properties | | | | | | | | 7,059 | | | 6,097,000 | | | 92.3 | % | | 90.9 | % |
______________________________
(1)Leased percentage and ending occupancy calculations are based on units for multifamily buildings.
(2)This development project consists of 401 units with 374 units delivered in 2020.
| | | | | | | | | | | | | | | | | | | | | | | | | | | | | | | | | | | | | | |
| Properties | | Location | | Year Acquired | | Year Constructed/Renovated | | Net Rentable Square Feet | | Percent Leased, as of December 31, 2020 (3) | | Ending Occupancy, as of December 31, 2020 (3) |
| Office Buildings | | | | | | | | | | | | |
| 515 King Street | | Alexandria, VA | | 1992 | | 1966 | | 75,000 | | | 81.5 | % | | 81.5 | % |
| Courthouse Square | | Alexandria, VA | | 2000 | | 1979 | | 121,000 | | | 80.8 | % | | 80.8 | % |
| 1600 Wilson Boulevard | | Arlington, VA | | 1997 | | 1973 | | 171,000 | | | 86.5 | % | | 86.5 | % |
| Fairgate at Ballston | | Arlington, VA | | 2012 | | 1988 | | 144,000 | | | 87.8 | % | | 86.3 | % |
| Arlington Tower | | Arlington, VA | | 2018 | | 1980/2014 | | 390,000 | | | 92.7 | % | | 90.1 | % |
| Silverline Center | | Tysons, VA | | 1997 | | 1972/2015 | | 552,000 | | | 81.1 | % | | 81.1 | % |
| 1901 Pennsylvania Avenue | | Washington, D.C. | | 1977 | | 1960 | | 101,000 | | | 86.4 | % | | 82.0 | % |
1220 19th Street | | Washington, D.C. | | 1995 | | 1976 | | 103,000 | | | 87.6 | % | | 82.7 | % |
2000 M Street (4) | | Washington, D.C. | | 2007 | | 1971 | | 233,000 | | | 82.2 | % | | 81.6 | % |
| 1140 Connecticut Avenue | | Washington, D.C. | | 2011 | | 1966 | | 184,000 | | | 88.6 | % | | 88.6 | % |
| Army Navy Building | | Washington, D.C. | | 2014 | | 1912/1987/2017 | | 108,000 | | | 100.0 | % | | 98.3 | % |
| 1775 Eye Street, NW | | Washington, D.C. | | 2014 | | 1964 | | 189,000 | | | 86.6 | % | | 86.6 | % |
| Watergate 600 | | Washington, D.C. | | 2017 | | 1972/1997 | | 294,000 | | | 89.2 | % | | 89.1 | % |
| Subtotal | | | | | | | | 2,665,000 | | | 86.6 | % | | 85.7 | % |
| | | | | | | | | | | | | | | | | | | | | | | | | | | | | | | | | | | | | | |
| Retail Centers | | | | | | | | | | | | |
| 800 S. Washington Street | | Alexandria, VA | | 1998/2003 | | 1955/1959 | | 46,000 | | | 86.3 | % | | 86.3 | % |
| Concord Centre | | Springfield, VA | | 1973 | | 1960 | | 75,000 | | | 90.2 | % | | 90.2 | % |
| Randolph Shopping Center | | Rockville, MD | | 2006 | | 1972 | | 83,000 | | | 97.4 | % | | 86.4 | % |
| Montrose Shopping Center | | Rockville, MD | | 2006 | | 1970 | | 151,000 | | | 73.0 | % | | 73.0 | % |
| Takoma Park | | Takoma Park, MD | | 1963 | | 1962 | | 51,000 | | | 100.0 | % | | 100.0 | % |
| Westminster | | Westminster, MD | | 1972 | | 1969 | | 150,000 | | | 94.2 | % | | 94.2 | % |
| Chevy Chase Metro Plaza | | Washington, D.C. | | 1985 | | 1975 | | 49,000 | | | 83.0 | % | | 83.0 | % |
| Spring Valley Village | | Washington, D.C. | | 2014 | | 1941/1950/2018 | | 94,000 | | | 93.8 | % | | 87.6 | % |
| Subtotal | | | | | | | | 699,000 | | | 89.0 | % | | 86.5 | % |
| TOTAL | | | | | | | | 9,461,000 | | | | | |
______________________________
(3) Percent leased and ending occupancy calculations are based on square feet that includes temporary lease agreements for commercial properties.
(4) This property is subject to a ground lease which expires on October 6, 2070.
ITEM 3: LEGAL PROCEEDINGS
None.
ITEM 4: MINE SAFETY DISCLOSURES
None.
PART II
ITEM 5: MARKET FOR THE REGISTRANT’S COMMON EQUITY, RELATED STOCKHOLDER MATTERS AND ISSUER PURCHASES OF EQUITY SECURITIES
Market and Shareholder Information: Our shares trade on the New York Stock Exchange under the symbol WRE. As of February 11, 2021, there were 3,225 shareholders of record.
Issuer Repurchases; Unregistered Sales of Securities: A summary of our repurchases of shares of our common stock for the three months ended December 31, 2020 was as follows:
| | | | | | | | | | | | | | |
| Issuer Purchases of Equity Securities |
| Period | Total Number of Shares Purchased (1) | Average Price Paid per Share | Total Number of Shares Purchased as Part of Publicly Announced Plans or Programs | Maximum Number (or Approximate Dollar Value) of Shares that May Yet be Purchased |
| October 1 - October 31, 2020 | — | | $ | — | | N/A | N/A |
| November 1 - November 30, 2020 | — | | — | | N/A | N/A |
| December 1 - December 31, 2020 | 39,623 | | 21.99 | | N/A | N/A |
| Total | 39,623 | | 21.99 | | N/A | N/A |
______________________________
(1) Represents restricted shares surrendered by employees to WashREIT to satisfy such employees' applicable statutory minimum tax withholding obligations in connection with the vesting of restricted shares.
Performance Graph:
The following line graph sets forth, for the period from December 31, 2015, through December 31, 2020, a comparison of the percentage change in the cumulative total stockholder return on our common stock compared to the cumulative total return of the Standard & Poor's 500 Stock Index and the MSCI US REIT Index. The graph assumes that $100 was invested on December 31, 2015, in shares of our common stock and each of the aforementioned indices and that all dividends were reinvested without the payment of any commissions. There can be no assurance that the performance of our shares will continue in line with the same or similar trends depicted in the graph below.
This performance graph shall not be deemed "filed" for the purposes of Section 18 of the Securities Exchange Act of 1934, or incorporated by reference into any filing by us under the Securities Act of 1933, except as shall be expressly set forth by specific reference in such filing.
ITEM 6: SELECTED FINANCIAL DATA
The following table sets forth our selected financial data on a historical basis. The following data should be read in conjunction with our financial statements and notes thereto and Management’s Discussion and Analysis of Financial Condition and Results of Operations included elsewhere in this Form 10-K.
| | | | | | | | | | | | | | | | | | | | | | | | | | | | | |
| 2020 | | 2019 | | 2018 | | 2017 | | 2016 |
| | (in thousands, except per share data) |
| Real estate rental revenue | $ | 294,118 | | | $ | 309,180 | | | $ | 291,730 | | | $ | 280,281 | | | $ | 268,672 | |
| (Loss) income from continuing operations | $ | (15,680) | | | $ | 29,132 | | | $ | 1,153 | | | $ | (3,568) | | | $ | 96,261 | |
| Discontinued operations: | | | | | | | | | |
| Income from operations of properties sold or held for sale | $ | — | | | $ | 16,158 | | | $ | 24,477 | | | $ | 23,180 | | | $ | 23,027 | |
| Gain on sale of real estate | $ | — | | | $ | 339,024 | | | $ | — | | | $ | — | | | $ | — | |
| Net (loss) income | $ | (15,680) | | | $ | 383,550 | | | $ | 25,630 | | | $ | 19,612 | | | $ | 119,288 | |
| Net (loss) income attributable to the controlling interests | $ | (15,680) | | | $ | 383,550 | | | $ | 25,630 | | | $ | 19,668 | | | $ | 119,339 | |
| (Loss) income from continuing operations attributable to the controlling interests per share – diluted | $ | (0.20) | | | $ | 0.36 | | | $ | 0.01 | | | $ | (0.05) | | | $ | 1.33 | |
| Net (loss) income attributable to the controlling interests per share – diluted | $ | (0.20) | | | $ | 4.75 | | | $ | 0.32 | | | $ | 0.25 | | | $ | 1.65 | |
| Total assets | $ | 2,409,818 | | | $ | 2,628,328 | | | $ | 2,417,104 | | | $ | 2,359,426 | | | $ | 2,253,619 | |
| Amounts outstanding on line of credit | $ | 42,000 | | | $ | 56,000 | | | $ | 188,000 | | | $ | 166,000 | | | $ | 120,000 | |
| Mortgage notes payable, net | $ | — | | | $ | 47,074 | | | $ | 48,277 | | | $ | 81,624 | | | $ | 133,117 | |
| Notes payable, net | $ | 945,370 | | | $ | 996,722 | | | $ | 995,397 | | | $ | 894,358 | | | $ | 843,084 | |
| Shareholders’ equity | $ | 1,320,787 | | | $ | 1,411,726 | | | $ | 1,068,127 | | | $ | 1,094,971 | | | $ | 1,050,946 | |
| Cash dividends declared | $ | 99,775 | | | $ | 96,964 | | | $ | 95,502 | | | $ | 92,834 | | | $ | 87,570 | |
| Cash dividends declared per share | $ | 1.20 | | | $ | 1.20 | | | $ | 1.20 | | | $ | 1.20 | | | $ | 1.20 | |
ITEM 7: MANAGEMENT’S DISCUSSION AND ANALYSIS OF FINANCIAL CONDITION AND RESULTS OF OPERATIONS
For the discussion and analysis of our 2018 financial condition and results of operations compared to 2019, refer to Item 7., “Management’s Discussion and Analysis of Financial Condition and Results of Operations” of our Annual Report on Form 10-K for the year ended December 31, 2019.
We provide Management’s Discussion and Analysis of Financial Condition and Results of Operations (“MD&A”) in addition to the accompanying consolidated financial statements and notes to assist readers in understanding our results of operations and financial condition. We organize the MD&A as follows:
•Overview. Discussion of our business outlook, operating results, investment activity, financing activity and capital requirements to provide context for the remainder of MD&A.
Results of Operations. Discussion of our financial results comparing 2020 to 2019.
•Liquidity and Capital Resources. Discussion of our financial condition and analysis of changes in our capital structure and cash flows.
•Funds From Operations. Calculation of NAREIT Funds From Operations (“NAREIT FFO”), a non-GAAP supplemental measure to net income.
•Critical Accounting Policies and Estimates. Descriptions of accounting policies that reflect significant judgments and estimates used in the preparation of our consolidated financial statements.
When evaluating our financial condition and operating performance, we focus on the following financial and non-financial indicators:
•Net operating income (“NOI”), calculated as set forth below under the caption "Results of Operations - Net Operating Income." NOI is a non-GAAP supplemental measure to net income.
•Funds From Operations (“NAREIT FFO”), calculated as set forth below under the caption “Funds from Operations.” NAREIT FFO is a non-GAAP supplemental measure to net income.
•Ending occupancy, calculated as occupied square footage or multifamily units as a percentage of total square footage or multifamily units, respectively, as of the last day of that period.
•Leased percentage, calculated as the percentage of apartments leased for our multifamily properties and percentage of available physical net rentable area leased for our commercial properties.
•Leasing activity, including new leases, renewals and expirations.
For purposes of evaluating comparative operating performance, we categorize our properties as “same-store”, “non-same-store” or discontinued operations. Same-store properties include properties that were owned for the entirety of the years being compared, and exclude properties under redevelopment or development and properties acquired, sold or classified as held for sale during the years being compared. We define development properties as those for which we have planned or ongoing major construction activities on existing or acquired land pursuant to an authorized development plan. We consider a property's development activities to be complete when the property is ready for its intended use. The property is categorized as same-store when it has been ready for its intended use for the entirety of the years being compared. We define redevelopment properties as those for which we have planned or ongoing significant development and construction activities on existing or acquired buildings pursuant to an authorized plan, which has an impact on current operating results, occupancy and the ability to lease space with the intended result of a higher economic return on the property. We categorize a redevelopment property as same-store when redevelopment activities have been complete for the majority of each year being compared.
Overview
Outlook
On March 11, 2020 the World Health Organization declared COVID-19, a respiratory illness caused by the novel coronavirus, a pandemic, and on March 13, 2020, the United States declared a national emergency with respect to COVID-19. The COVID-19 pandemic caused state and local governments within the Washington metro region to institute quarantines, shelter-in-place rules and restrictions on travel, the types of business that may continue to operate and/or the types of construction projects that may continue. These actions resulted in modifications to our normal operations, including requiring our employees to work remotely with the exception of essential building personnel.
In June 2020, shelter-in-place orders began to phase out in the Washington metro region. We have developed and implemented
robust plans for commercial tenants returning to their leased space to reduce the risk of exposure and further spread of the virus at our properties and continue to follow the mandates of public health officials and government agencies. We continue to adhere to occupancy restrictions at our properties where required.
The effects of the COVID-19 pandemic had a significant impact on our operating results for the year ended December 31, 2020. Beginning late in the first quarter of 2020 and continuing into the second quarter of 2020, many of our retail commercial tenants were closed or were operating at significantly reduced capacity as a result of restrictions on non-essential businesses. The majority of our commercial office tenants have experienced limited disruption to their businesses due to social distancing and lockdown measures taken in response to the COVID-19 pandemic. Starting in April 2020, we began working with our commercial tenants on a case-by-case basis to the extent they demonstrated hardship as a result of the pandemic and financial ability to work through a satisfactory arrangement on a variety of relief options, generally involving negotiated deferral payment plans or early blend-and-extend renewals. By mid-June, most of our retail tenants had reopened. As of January 31, 2021, we collected 99% and 97% of office and retail cash rent during the fourth quarter of 2020, respectively, excluding the impact of contractual rent deferral agreements. The effects of COVID-19 on our commercial tenants have been reflected in an increase in credit losses of $4.5 million during 2020 compared to 2019. We have $1.0 million of deferred rent outstanding, net of repayments, from each of our office and retail segments. We continue to monitor and communicate with our commercial tenants to assess their needs and ability to pay rent.
At our multifamily properties we temporarily froze rents on full-year lease renewals, waived late fees and offered a payment deferral plan to residents who have been adversely financially impacted by COVID-19. As of January 31, 2021, we collected 99% of multifamily cash rent during the fourth quarter of 2020, excluding rent that has been deferred. Deferred rent outstanding, net of repayments, from our multifamily tenants is less than $0.1 million. The effects of COVID-19 on our multifamily tenants have been reflected in an increase in credit losses of $0.9 million during 2020 compared to 2019. We expect the economic disruptions caused by the COVID-19 pandemic to limit our ability to increase rental rates until the economic disruption of the pandemic subsides.
We had a decline in average occupancy of approximately 150 basis points during the fourth quarter of 2020 compared to the fourth quarter of 2019, excluding Trove which began lease-up in the first quarter of 2020. The effects of the COVID-19 pandemic have also impacted our ability to lease up available commercial space as physical touring stopped during shelter-in-place orders and lease decisions have been slower for prospective tenants than in previous years as they re-evaluate re-entry and space plans. New gross leasing square footage declined by 54% and 77% for office and retail space during 2020 compared 2019, respectively. The decline in new gross leasing was due to several factors, including the effects of the COVID-19 pandemic, the execution of some large tenant leases in 2019 and the sale of several office and retail properties during 2019 and 2020. As of December 31, 2020, we had approximately 430,000 square feet of vacant commercial space and approximately 276,000 square feet of commercial lease expirations scheduled for 2021. For our multifamily properties, the economic disruptions caused by the COVID-19 pandemic have limited our ability to maintain or increase rental rates. We expect this to continue until the economic disruption of the pandemic subsides. To help mitigate the impact on our operating results of the COVID-19 pandemic, we have initiated various operational cost saving initiatives across our portfolio.
We expect the COVID-19 outbreak, including any mutations thereof, will continue to affect our financial condition and results of operations going forward, including but not limited to, real estate rental revenues, credit losses and leasing activity. Given our sole concentration in the Washington metro region, our entire existing portfolio could be impacted for the foreseeable future by quarantines, shelter-in-place rules and various other restrictions imposed or re-imposed in response to a surge in COVID-19 cases. Due to the uncertainty of the future impacts of the COVID-19 pandemic, the extent of the financial impact cannot be reasonably estimated at this time. For more information, see "Part I - Item 1A. Risk Factors" included elsewhere in this Annual Report on Form 10-K.
New legislation was enacted during 2020 to provide relief to businesses in response to the COVID-19 pandemic. We have evaluated and will continue to evaluate the relief options available or that become available in the future, such as the Coronavirus Aid, Relief, and Economic Securities Act (“CARES Act”), or other emergency relief initiatives and stimulus packages instituted by the federal government. A number of the available relief options contain restrictions on future business activities, including ability to repurchase shares and pay dividends that require careful evaluation and consideration. We will continue to assess these options and any subsequent legislation or other relief packages, including the accompanying restrictions on our business, as the pandemic continues to evolve. The legislation enacted in 2020 did not have a material impact on our results of operations for the year ended December 31, 2020.
Operating Results
Net (loss) income, NOI and NAREIT FFO for the years ended December 31, 2020 and 2019 were as follows (in thousands, except percentage amounts):
| | | | | | | | | | | | | | | | | | | | | | | |
| Year Ended December 31, | | | | |
| 2020 | | 2019 | | Change | | % Change |
Net (loss) income | $ | (15,680) | | | $ | 383,550 | | | $ | (399,230) | | | (104.1) | % |
NOI (1) | $ | 181,209 | | | $ | 193,600 | | | $ | (12,391) | | | (6.4) | % |
NAREIT FFO (2) | $ | 119,359 | | | $ | 134,118 | | | $ | (14,759) | | | (11.0) | % |
______________________________ | | | | | | | |
(1) See page 32 of the MD&A for reconciliations of NOI to net income. | | |
(2) See page 44 of the MD&A for reconciliations of NAREIT FFO to net income. | | |
The decrease in net income is primarily due to lower gains on sale of real estate ($414.0 million), lower income from discontinued operations ($16.2 million) and lower NOI ($12.4 million), partially offset by lower depreciation and amortization expense ($16.2 million), lower interest expense ($16.4 million), lower real estate impairment charges ($8.4 million) and lower general and administrative expenses ($2.1 million).
The lower NOI is primarily due to the sales of 1776 G Street ($8.5 million) and Quantico Corporate Center ($1.8 million) in 2019 and John Marshall II ($3.2 million), 1227 25th Street ($0.5 million) and Monument II ($0.4 million) in 2020, lower same-store NOI ($8.4 million) and a net operating loss from Trove ($0.3 million). These were partially offset by income from the multifamily acquisitions ($10.8 million) in 2019. The lower same-store NOI is explained in further detail beginning on page 34 (Results of Operations - 2020 Compared to 2019).
The decrease in NAREIT FFO primarily reflects lower income from discontinued operations, net of depreciation and amortization ($21.1 million) and lower NOI ($12.4 million), partially offset by lower interest expense ($16.4 million) and lower general and administrative expenses ($2.1 million).
Investment and Financing Activity
Significant investment and financing transactions during 2020 included the following:
•The prepayment of the $45.6 million mortgage note secured by Yale West, which was scheduled to mature in 2052. As a result of the transaction, we recognized a gain on extinguishment of debt of $0.5 million related to the write-off of an unamortized mortgage premium of $1.4 million, partially offset by a prepayment penalty of $0.9 million.
•The disposition of John Marshall II, a 223,000 square foot office property in Tysons, Virginia, for a contract sales price of $57.0 million. As a result of this transaction, we recognized a loss on sale of real estate of $6.9 million.
•The prepayment of all $250.0 million of our 4.95% Senior Notes originally scheduled to mature in October 2020 without penalty using borrowings from our Revolving Credit Facility.
•The execution of the one-year, $150.0 million 2020 Term Loan, maturing on May 5, 2021 with a one-year extension option. The 2020 Term Loan bears interest at LIBOR + 1.50%, which margin is subject to change based on our credit ratings, with a 0.50% floor for the LIBOR rate. We used the proceeds to repay borrowings under our Revolving Credit Facility. We subsequently prepaid the 2020 Term Loan on November 30, 2020.
•The entry into a note purchase agreement to issue $350.0 million aggregate principal amount of 3.44% senior unsecured 10-year notes payable (the “Green Bonds”). The closing and full funding of the Green Bonds occurred on December 17, 2020. The proceeds of the sale of the Green Bonds were and will be used to finance or refinance recently completed and future green building and energy efficiency, sustainable water and wastewater management and renewable energy projects (“Eligible Green Projects”).
•The prepayment of the $150.0 million of borrowings outstanding on the 2015 Term Loan.
•In conjunction with the entry into the note purchase agreement to issue the Green Bonds, we terminated four forward interest rate swap arrangements totaling $200.0 million designated as cash flow hedges. At the time of termination, the forward swaps had a liability fair value of $20.4 million, which is amortized as interest expense over the 10-year term of the Green Bonds.
•In conjunction with the prepayment of the 2015 Term Loan, we terminated interest rate swap agreements with notional amounts in the aggregate of $150.0 million. As a result of the termination, the accumulated liability fair value of the interest rate swaps of $0.6 million was reclassified from Accumulated other comprehensive loss to Loss on interest rate
swaps on our consolidated income statements.
As of February 11, 2021, our $700.0 million Revolving Credit Facility has an incremental borrowing capacity of $658.0 million. As of December 31, 2020, the interest rate on the facility was LIBOR plus 1.00% and LIBOR was 0.14% as of that date.
Capital Requirements
We do not have any debt maturities scheduled during 2021. We expect to have additional capital requirements as set forth on page 37 (Liquidity and Capital Resources - Capital Requirements).
Results of Operations
The discussion that follows is based on our consolidated results of operations for the three years ended December 31, 2020. The ability to compare one period to another is significantly affected by acquisitions completed and dispositions made during those years (see note 3 to the consolidated financial statements).
Net Operating Income
NOI, defined as real estate rental revenue less real estate expenses, is a non-GAAP measure. NOI is calculated as net income, less non-real estate revenue and the results of discontinued operations (including the gain on sale, if any), plus interest expense, depreciation and amortization, lease origination expenses, general and administrative expenses, real estate impairment and gain or loss on extinguishment of debt. We believe that NOI is useful as a performance measure because, when compared across periods, NOI reflects the impact on operations of trends in occupancy rates, rental rates and operating costs on an unleveraged basis, providing perspective not immediately apparent from net income. NOI excludes certain components from net income in order to provide results more closely related to a property’s results of operations. For example, interest expense is not necessarily linked to the operating performance of a real estate asset. In addition, depreciation and amortization, because of historical cost accounting and useful life estimates, may distort operating performance at the property level. As a result of the foregoing, we provide NOI as a supplement to net income, calculated in accordance with GAAP. NOI does not represent net income or income from continuing operations, in either case calculated in accordance with GAAP. As such, it should not be considered an alternative to these measures as an indication of our operating performance. A reconciliation of NOI to net income follows.
2020 Compared to 2019
The following tables reconcile NOI to net income and provide the basis for our discussion of our consolidated results of operations and NOI in 2020 compared to 2019. All amounts are in thousands except percentage amounts.
| | | | | | | | | | | | | | | | | | | | | | | | | | | | | | | | | | | | | | | | | | | | | | | | | | | | | | | | | | | | | | | | | | | | | | | | | | | | | | | | | | | |
| | | | | | | | | Non-Same-Store | | | | | | | | |
| | Same-Store | | | | | | Acquisitions (1) | | Development/Redevelopment (2) | | Held for Sale or Sold (3) | | All Properties | | | | |
| | 2020 | | 2019 | | $
Change | | %
Change | | 2020 | | 2019 | | 2020 | | 2019 | | 2020 | | 2019 | | 2020 | | 2019 | | $
Change | | %
Change |
| Real estate rental revenue | $ | 233,904 | | | $ | 245,441 | | | $ | (11,537) | | | (4.7) | % | | $ | 45,757 | | | $ | 27,641 | | | $ | 1,394 | | | $ | 35 | | | $ | 13,063 | | | $ | 36,063 | | | $ | 294,118 | | | $ | 309,180 | | | $ | (15,062) | | | (4.9) | % |
Real estate expenses | 87,013 | | | 90,130 | | | (3,117) | | | (3.5) | % | | 18,564 | | | 11,242 | | | 1,735 | | | 76 | | | 5,597 | | | 14,132 | | | 112,909 | | | 115,580 | | | (2,671) | | | (2.3) | % |
| NOI | $ | 146,891 | | | $ | 155,311 | | | $ | (8,420) | | | (5.4) | % | | $ | 27,193 | | | $ | 16,399 | | | $ | (341) | | | $ | (41) | | | $ | 7,466 | | | $ | 21,931 | | | $ | 181,209 | | | $ | 193,600 | | | $ | (12,391) | | | (6.4) | % |
| Reconciliation to net income: | | | | | | | | | | | | | | | | |
| Depreciation and amortization | | | | | | | | | | | | | | | | (120,030) | | | (136,253) | | | 16,223 | | | (11.9) | % |
| | | | | | | | | | | | | | | | | | | | | | |
| General and administrative expenses | | | | | | | | | | | | | | | | (23,951) | | | (26,068) | | | 2,117 | | | (8.1) | % |
| | | | | | | | | | | | | | | | | | | | | | |
| Real estate impairment | | | | | | | | | | | | | | | | — | | | (8,374) | | | 8,374 | | | (100.0) | % |
| (Loss) gain on sale of real estate | | | | | | | | | | | | | | | | (15,009) | | | 59,961 | | | (74,970) | | | (125.0) | % |
| Interest expense | | | | | | | | | | | | | | | | (37,305) | | | (53,734) | | | 16,429 | | | (30.6) | % |
| Loss on interest rate derivatives | | | | | | | | | | | | | | | | (560) | | | — | | | (560) | | | 100.0 | % |
| Loss on extinguishment of debt | | | | | | | | | | | | | | | | (34) | | | — | | | (34) | | | 100.0 | % |
| | | | | | | | | | | | | | | | | | | | | | |
Discontinued operations (4): | | | | | | | | | | | | | | | | | | | | | | |
| Income from properties sold or held for sale | | | | | | | | | | | | | | | | — | | | 16,158 | | | (16,158) | | | (100.0) | % |
| Gain on sale of real estate | | | | | | | | | | | | | | | | — | | | 339,024 | | | (339,024) | | | (100.0) | % |
| Loss on extinguishment of debt | | | | | | | | | | | | | | | | — | | | (764) | | | 764 | | | (100.0) | % |
| Net (loss) income | | | | | | | | | | | | | | | | $ | (15,680) | | | $ | 383,550 | | | $ | (399,230) | | | (104.1) | % |
| | | | | | | | | | | | | | | | | | | | |
| | | | | | | | | | | | | | | | | | | | | | |
______________________________
(1)Acquisitions:
2019 Multifamily – Assembly Alexandria, Assembly Manassas, Assembly Dulles, Assembly Leesburg, Assembly Herndon, Assembly Germantown and Assembly Watkins Mill (collectively, the “Assembly Portfolio”) and Cascade at Landmark
(2)Development/redevelopment properties:
Multifamily development property – Trove and land adjacent to Riverside Apartments
(3)Sold (classified as continuing operations):
2020 Office – John Marshall II, Monument II and 1227 25th Street
2019 Office – Quantico Corporate Center and 1776 G Street
(4) Discontinued operations:
2019 Retail – Wheaton Park, Bradlee Shopping Center, Shoppes of Foxchase, Gateway Overlook, Olney Village Center, Frederick County Square, Centre at Hagerstown and Frederick Crossing
Real Estate Rental Revenue
Real estate rental revenue is comprised of (a) minimum base rent, which includes rental revenues recognized on a straight-line basis, (b) revenue from the recovery of operating expenses from our tenants, (c) credit losses on lease related receivables, (d) revenue recognized from lease termination fees and (e) parking and other tenant charges such as percentage rents.
Real estate rental revenue from same-store properties for the two years ended December 31, 2020 was as follows (in thousands, except percentage amounts):
| | | | | | | | | | | | | | | | | | | | | | | |
| | Year Ended December 31, | | | | |
| | 2020 | | 2019 | | $ Change | | % Change |
Multifamily | $ | 97,894 | | | $ | 98,455 | | | $ | (561) | | | (0.6) | % |
| Office | 119,264 | | | 127,996 | | | (8,732) | | | (6.8) | % |
Other | 16,746 | | | 18,990 | | | (2,244) | | | (11.8) | % |
| Total same-store real estate rental revenue | $ | 233,904 | | | $ | 245,441 | | | $ | (11,537) | | | (4.7) | % |
•Multifamily: Decrease primarily due to higher rent abatements ($0.5 million), lower move-in charges ($0.5 million) and higher credit losses ($0.4 million) related to the COVID-19 pandemic. These were partially offset by higher termination
fees ($0.3 million), rental rates ($0.2 million) and parking income ($0.1 million).
•Office: Decrease primarily due to lower lease termination fees ($3.7 million), lower parking income ($2.2 million), higher credit losses ($2.1 million) and lower reimbursements ($0.8 million). The lower parking income and higher credit losses are primarily due to the COVID-19 pandemic.
Real estate rental revenue from acquisitions increased due to the completion of a full year of operations at the Assembly Portfolio ($14.6 million) and Cascade at Landmark ($3.6 million) which were acquired in 2019.
Real estate rental revenue from sold properties classified as continuing operations decreased due to the sale of 1776 G Street ($13.7 million) during the fourth quarter of 2019, John Marshall II ($5.3 million) during the second quarter of 2020, Quantico Corporate Center ($2.8 million) during the second quarter of 2019, and 1227 25th Street ($0.6 million) and Monument II ($0.6 million) during the fourth quarter of 2020.
Ending occupancy for properties classified as continuing operations for the two years ended December 31, 2020 was as follows:
| | | | | | | | | | | | | | | | | | | | | | | | | | | | | | | | | | | | | | | | | | | | | | | | | | | | | |
| December 31, 2020 | | December 31, 2019 | | Decrease |
| Same-Store | | Non-Same-Store | | Total | | Same-Store | | Non-Same-Store | | Total | | Same-Store | | Non-Same-Store | | Total |
Multifamily (1) | 93.7 | % | | 86.7 | % | | 90.9 | % | | 95.0 | % | | 94.7 | % | | 94.9 | % | | (1.3) | % | | (8.0) | % | | (4.0) | % |
| Office | 85.7 | % | | N/A | | 85.7 | % | | 88.4 | % | | 94.9 | % | | 89.6 | % | | (2.7) | % | | N/A | | (3.9) | % |
| Other | 86.5 | % | | N/A | | 86.5 | % | | 90.9 | % | | N/A | | 90.9 | % | | (4.4) | % | | N/A | | (4.4) | % |
Total (1) | 90.1 | % | | 86.7 | % | | 89.7 | % | | 92.0 | % | | 94.7 | % | | 92.8 | % | | (1.9) | % | | (8.0) | % | | (3.1) | % |
(1) Ending occupancy includes the addition of the total rentable units at Trove, which began to lease-up in the first quarter of 2020. Excluding Trove, total multifamily ending occupancy was 94.3% and total portfolio ending occupancy was 91.4% as of December 31, 2020.
•Multifamily: Decrease in same-store ending occupancy was primarily due to lower ending occupancy at 3801 Connecticut Avenue, The Kenmore, Yale West and The Maxwell, partially offset by higher ending occupancy at Bethesda Hill Apartments.
•Office: Decrease in same-store ending occupancy was primarily due to lower ending occupancy at Silverline Center, 2000 M Street, and 1775 Eye Street, partially offset by higher ending occupancy at 1220 19th Street, Fairgate at Ballston and Watergate 600.
During the year ended December 31, 2020, we executed new and renewed leases in our office segment as follows:
| | | | | | | | | | | | | | | | | | | | | | | | | | | | | |
| Square Feet
(in thousands) | | Average Rental Rate
(per square foot) | | % Rental Rate Increase | | Leasing Costs (1) (per square foot) | | Free Rent (weighted average months) |
| Office | 214 | | | $ | 47.37 | | | 14.4 | % | | $ | 32.34 | | | 4.4 | |
______________________________
(1) Consist of tenant improvements and leasing commissions.
Real Estate Expenses
Real estate expenses as a percentage of revenue for the two years ended December 31, 2020 were 38.4% and 37.4%, respectively.
Real estate expenses from same-store properties for the two years ended December 31, 2020 were as follows (in thousands, except percentage amounts):
| | | | | | | | | | | | | | | | | | | | | | | |
| | Year Ended December 31, | | | | |
| | 2020 | | 2019 | | $ Change | | % Change |
Multifamily | $ | 37,816 | | | $ | 37,817 | | | $ | (1) | | | — | % |
| Office | 43,855 | | | 46,791 | | | (2,936) | | | (6.3) | % |
Other | 5,342 | | | 5,522 | | | (180) | | | (3.3) | % |
| Total same-store real estate expenses | $ | 87,013 | | | $ | 90,130 | | | $ | (3,117) | | | (3.5) | % |
•Multifamily: Higher real estate tax ($0.5 million) and insurance ($0.2 million) expenses were offset by lower utilities ($0.3 million), repairs and maintenance ($0.2 million) and administrative ($0.2 million) expenses.
•Office: Decrease primarily due to lower utilities ($1.7 million), contract maintenance ($1.0 million) and administrative ($0.8 million) expenses, partially offset by higher real estate tax ($0.3 million) and insurance ($0.2 million) expenses.
Other Income and Expenses
Depreciation and Amortization: Decrease primarily due to the higher amortization of intangible lease assets at the Assembly Portfolio ($6.6 million) and Cascade at Landmark ($0.3 million) in 2019, lower depreciation and amortization at same-store properties ($5.7 million) and the dispositions of 1776 G Street ($2.7 million) and Quantico Corporate Center ($0.8 million) in 2019 and John Marshall II ($2.8 million) and Monument II ($0.4 million) in 2020. These decreases were partially offset by placing the Trove development ($3.1 million) into service during 2020.
General and administrative expenses: Decrease primarily due to lower short term incentive compensation ($2.0 million) and severance ($1.1 million) expenses in 2020, partially offset by the reversal of a transfer tax liability in 2019 ($0.7 million).
Real estate impairment: The real estate impairment charge of $8.4 million during the first quarter of 2019 reduced the carrying value of Quantico Corporate Center to its estimated fair value (see note 3 to the consolidated financial statements).
Loss on sale of real estate: The loss during 2020 is primarily due to losses on the sales of John Marshall II ($6.9 million) and Monument II ($8.6 million), partially offset by a gain on the sale of 1227 25th Street ($1.1 million). The gain during 2019 is due to the sale of 1776 G Street ($61.0 million), partially offset by a loss on the sale of Quantico Corporate Center ($1.0 million).
Loss on extinguishment of debt: During the fourth quarter of 2020, we recognized a loss on extinguishment of debt of $0.3 million related to the prepayments of the $150.0 million 2020 Term Loan originally scheduled to mature in May 2021 and the $150.0 million 2015 Term Loan originally scheduled to mature in March 2021. During the second quarter of 2020, we recognized a loss of $0.2 million related to the prepayment of all $250.0 million of our 4.95% Senior Notes originally scheduled to mature in October 2020. These losses were partially offset by a gain of $0.5 million on the prepayment of the mortgage note secured by Yale West Apartments during the first quarter of 2020.
Loss on interest rate derivatives: In December 2020, in connection with the prepayment of our 2015 Term Loan, we terminated interest rate swap agreements with notional amounts in the aggregate of $150.0 million. As a result of the termination, the accumulated fair value of the interest rate swaps of $0.6 million was reclassified from Accumulated other comprehensive loss to Loss on interest rate derivatives on our consolidated income statements.
Interest Expense: Interest expense by debt type for the two years ended December 31, 2020 was as follows (in thousands, except percentage amounts):
| | | | | | | | | | | | | | | | | | | | | | | |
| Year Ended December 31, | | | | |
| Debt Type | 2020 | | 2019 | | $ Change | | % Change |
| Notes payable | $ | 33,569 | | | $ | 45,595 | | | $ | (12,026) | | | (26.4) | % |
| Mortgage notes payable | 172 | | | 2,074 | | | (1,902) | | | (91.7) | % |
| Line of credit | 5,783 | | | 9,279 | | | (3,496) | | | (37.7) | % |
| Capitalized interest | (2,219) | | | (3,214) | | | 995 | | | 31.0 | % |
| Total | $ | 37,305 | | | $ | 53,734 | | | $ | (16,429) | | | (30.6) | % |
•Notes payable: Decrease primarily due to prepayment of all $250.0 million of our 4.95% Senior Notes in April 2020 and the execution of a six-month $450.0 million 2019 Term Loan in April 2019 to fund the Assembly Portfolio acquisition that was repaid in the third quarter of 2019, partially offset by the new $150.0 million 2020 Term Loan executed in May 2020 and prepaid in November 2020, and the issuance of the $350.0 million Green Bonds in December 2020.
•Mortgage notes payable: Decrease due to repayment of the mortgage note secured by Yale West Apartments in January 2020.
•Line of credit: Decrease primarily due to a lower weighted average interest rate of 1.5% during 2020, as compared to 3.3% during 2019, partially offset by higher weighted average borrowings of $204.8 million during 2020, as compared to $196.1 million during 2019.
•Capitalized interest: Decrease primarily due to placing into service assets at Trove.
Discontinued operations:
Income from properties sold or held for sale: Decrease primarily due to the sale of the properties classified as discontinued operations during 2019.
Gain on sale of real estate: Decrease due to gains on the sales of the Shopping Center Portfolio ($333.0 million) and Frederick Crossing and Frederick County Square ($9.5 million), partially offset by a loss on the sale of Centre at Hagerstown ($3.5 million) during 2019.
Loss on extinguishment of debt: We recognized a $0.8 million loss on extinguishment of debt during 2019 related to the prepayment of the mortgage note secured by Olney Village Center prior to that property’s disposition as part of the Shopping Center Portfolio.
Liquidity and Capital Resources
As the local and global economies have weakened as a result of COVID-19, ensuring adequate liquidity is critical. We believe we have access to adequate resources to meet the needs of our existing operations, mandatory capital expenditures, dividend payments and working capital, to the extent not funded by cash provided by operating activities. However, we expect the COVID-19 pandemic to continue to adversely impact our future operating cash flows. Such adverse impacts include the inability of some of our tenants to pay their rent on time or at all, longer lease-up periods for both anticipated and unanticipated vacancies, temporary rental rate freezes and contractual rent deferral arrangements.
In April 2020, we prepaid without penalty all $250.0 million of our 4.95% Senior Notes due 2020 using borrowings on our Revolving Credit Facility.
In April 2020, we executed an amendment to the John Marshall II purchase and sale agreement, decreasing the contract sale price to $57.0 million, and closed on the sale on April 21, 2020.
In May 2020, the Company closed on a one-year unsecured term loan, with a one-year extension option, in a principal amount of $150.0 million. We used the proceeds to repay borrowings under our Revolving Credit Facility. The term loan was subsequently repaid in full on November 30, 2020.
In September 2020, we entered into a note purchase agreement to issue $350.0 million aggregate principal amount of 3.44% senior unsecured 10-year notes payable. The closing and full funding of the Green Bonds occurred on December 17, 2020.
In the fourth quarter of 2020, we repaid $300.0 million of existing term loans (including the $150.0 million term loan incurred in May 2020) maturing in 2021 and 2022. We have no debt maturing until the fourth quarter of 2022.
Capital Structure
We manage our capital structure to reflect a long-term investment approach, generally seeking to match the cash flow of our assets with a mix of equity and various debt instruments. We expect that our capital structure will allow us to obtain additional capital from diverse sources that could include additional equity offerings of common shares, public and private secured and unsecured debt financings, asset dispositions, operating units and joint venture equity. Our ability to raise funds through the incurrence of debt and issuance of equity securities is dependent on, among other things, general economic conditions including the impacts of the COVID-19 pandemic, general market conditions for REITs, our operating performance, our debt rating, the current trading price of our common shares and other capital market conditions. We analyze which source of capital we believe to be most advantageous to us at any particular point in time.
As of February 11, 2021, we had cash and cash equivalents of approximately $25.5 million and availability under our Revolving Credit Facility of $638.0 million. We currently expect that our potential sources of liquidity for acquisitions, development, redevelopment, expansion and renovation of properties, and operating and administrative expenses, may include:
•Cash flow from operations;
•Borrowings under our Revolving Credit Facility or other new short-term facilities;
•Issuances of our equity securities and/or common units in operating partnerships;
•Issuances of preferred shares;
•Proceeds from long-term secured or unsecured debt financings, including construction loans and term loans, or the issuance of debt securities;
•Investment from joint venture partners; and
•Net proceeds from the sale of assets.
In response to the COVID-19 pandemic, we significantly reduced our capital requirements as compared to the estimates we disclosed in our Annual Report on Form 10-K for the year ended December 31, 2019. We reduced our expected 2020 capital expenditures by approximately $40 million by deferring non-essential building restorations, not incurring certain tenant improvements and leasing costs for speculative leasing, decreasing multifamily renovation capital expenditures, and lowering our anticipated development spending as we did not break ground on the new Riverside development this year.
During 2021, we expect that we will have significant capital requirements, which will continue to be impacted by the COVID-19 pandemic, including the following items:
•Funding dividends and distributions to our shareholders (which we intend to continue to pay at or about current levels);
•Approximately $45.0 - $50.0 million to invest in our existing portfolio of operating assets, including approximately $10.0 - $15.0 million to fund tenant-related capital requirements and leasing commissions;
•Approximately $5.0 - $7.5 million to invest in our development and redevelopment projects; and
•Funding for potential property acquisitions throughout 2021, offset by proceeds from potential property dispositions.
There can be no assurance that our capital requirements will not be materially higher or lower than the above expectations. We currently believe that we will generate sufficient cash flow from operations and potential property sales and have access to the capital resources necessary to fund our requirements in 2021. However, as a result of the uncertainty of the future impacts of the COVID-19 pandemic, general market conditions in the greater Washington metro region, economic conditions affecting the ability to attract and retain tenants, declines in our share price, unfavorable changes in the supply of competing properties, or our properties not performing as expected, we may not generate sufficient cash flow from operations and property sales or otherwise have access to capital on favorable terms, or at all. If we are unable to obtain capital from other sources, we may need to alter capital spending to be materially different than what is stated in the prior paragraph. If capital were not available, we may be unable to satisfy the distribution requirement applicable to REITs, make required principal and interest payments, make strategic acquisitions or make necessary and/or routine capital improvements or undertake improvement/redevelopment opportunities with respect to our existing portfolio of operating assets.
Debt Financing
We generally use unsecured or secured, corporate-level debt, including unsecured notes, our Revolving Credit Facility, bank term loans and mortgages, to meet our borrowing needs. Long-term, we generally use fixed rate debt instruments in order to match the returns from our real estate assets. If we issue unsecured debt in the future, we would seek to ladder the maturities of our debt to mitigate exposure to interest rate risk in any particular future year. We also utilize variable rate debt for short-term financing purposes. At times, our mix of variable and fixed rate debt may not suit our needs. At those times, we may use derivative financial instruments including interest rate swaps and caps, forward interest rate options or interest rate options in order to assist us in managing our debt mix. We may either hedge our variable rate debt to give it an effective fixed interest rate or hedge fixed rate debt to give it an effective variable interest rate.
As of December 31, 2020, our future debt principal payments are scheduled as follows (in thousands):
| | | | | | | | | | | | | | | | | | | | | | | | | |
| Year | | | Unsecured Notes Payable/Term Loans | | Revolving Credit Facility | | Total Debt | | Average Interest Rate |
| 2021 | | | $ | — | | | $ | — | | | $ | — | | | — | % |
| 2022 | | | 300,000 | | | — | | | 300,000 | | | 4.0 | % |
| 2023 | | | 250,000 | | (1) | 42,000 | | (2) | 292,000 | | | 2.6 | % |
| 2024 | | | — | | | — | | | — | | | — | % |
| 2025 | | | — | | | — | | | — | | | — | % |
| Thereafter | | | 400,000 | | (3) | — | | | 400,000 | | | 4.5 | % |
| Scheduled principal payments | | | 950,000 | | | 42,000 | | | 992,000 | | | 3.8 | % |
| | | | | | | | | |
| Premiums and discounts, net | | | (456) | | | — | | | (456) | | | |
| Debt issuance costs, net | | | (4,174) | | | — | | | (4,174) | | | |
| Total | | | $ | 945,370 | | | $ | 42,000 | | | $ | 987,370 | | | 3.8 | % |
______________________________
(1)WashREIT entered into interest rate swaps to effectively fix a LIBOR plus 110 basis points floating interest rate to a 2.31% all-in fixed interest rate for $150.0 million portion of the term loan. For the remaining $100.0 million portion of the term loan, WashREIT entered into interest rate swaps to effectively fix a LIBOR plus 100 basis points floating interest rate to a 3.71% all-in fixed interest rate. The interest rates are fixed through the term loan maturity of July 2023. The 2018 Term Loan has an all-in fixed interest rate of 2.87%.
(2)Maturity date for credit facility of March 2023 assumes election of option for two additional 6-month periods.
(3)The closing and full funding of the $350.0 million 10-year 3.44% Green Bonds occurred on December 17, 2020. The Green Bonds have an all-in fixed interest rate of 4.09%.
The weighted average maturity for our debt is 5.2 years. If principal amounts due at maturity cannot be refinanced, extended or paid with proceeds of other capital transactions, such as new equity capital, our cash flow may be insufficient to repay all maturing debt. Prevailing interest rates or other factors at the time of a refinancing, such as possible reluctance of lenders to make commercial real estate loans, may result in higher interest rates and increased interest expense or inhibit our ability to finance our obligations.
From time to time, we may seek to repurchase and cancel our outstanding unsecured notes and term loans through open market purchases, privately negotiated transactions or otherwise. Such repurchases, if any, will depend on prevailing market conditions, our liquidity requirements, contractual restrictions and other factors. The amounts involved may be material.
Debt Covenants
Pursuant to the terms of our Revolving Credit Facility, 2018 Term Loan and unsecured notes, we are subject to customary operating covenants and maintenance of various financial ratios.
Failure to comply with any of the covenants under our Revolving Credit Facility, 2018 Term Loan, unsecured notes or other debt instruments could result in a default under one or more of our debt instruments. This could cause our lenders to accelerate the timing of payments and could therefore have a material adverse effect on our business, operations, financial condition and liquidity. In addition, our ability to draw on our Revolving Credit Facility or incur other unsecured debt in the future could be restricted by the debt covenants.
As of December 31, 2020, we were in compliance with the covenants related to our Revolving Credit Facility, 2018 Term Loan and unsecured notes.
Common Equity
We have authorized for issuance 100.0 million common shares, of which approximately 84.4 million shares were outstanding at December 31, 2020.
On May 4, 2018, we entered into eight separate equity distribution agreements (collectively, the “2018 Equity Distribution Agreements”) with each of Wells Fargo Securities, LLC, BNY Mellon Capital Markets, LLC, Capital One Securities, Inc., Citigroup Global Markets Inc., Goldman Sachs & Co. LLC, J.P. Morgan Securities LLC, KeyBanc Capital Markets Inc. and Truist Securities, Inc. (f/k/a SunTrust Robinson Humphrey, Inc.) relating to the issuance of up to $250.0 million of our common shares from time to time. Issuances of our common shares are made at market prices prevailing at the time of issuance. We may use net proceeds from the issuance of common shares under this program for general business purposes, including, without limitation, working capital, the acquisition, renovation, expansion, improvement, development or redevelopment of income producing properties or the repayment of debt.
Our issuances and net proceeds on the 2018 Equity Distribution Agreements for the three years ended December 31, 2020 were as follows (in thousands, except per share data):
| | | | | | | | | | | | | | | | | |
| Year Ended December 31, |
| 2020 | | 2019 | | 2018 |
| Issuance of common shares | 2,000 | | | 1,859 | | | 1,165 | |
| Weighted average price per share | $ | 23.86 | | | $ | 30.00 | | | $ | 31.18 | |
| Net proceeds | $ | 48,355 | | | $ | 54,916 | | | $ | 35,472 | |
We have a dividend reinvestment program, whereby shareholders may use their dividends and optional cash payments to purchase common shares. The common shares sold under this program may either be common shares issued by us or common shares purchased in the open market.
Our issuances and net proceeds on the dividend reinvestment program for the three years ended December 31, 2020 were as follows (in thousands; except per share data):
| | | | | | | | | | | | | | | | | |
| Year Ended December 31, |
| 2020 | | 2019 | | 2018 |
| Issuance of common shares | 89 | | | 173 | | | 81 | |
| Weighted average price per share | $ | 24.12 | | | $ | 27.58 | | | $ | 29.18 | |
| Net proceeds | $ | 2,121 | | | $ | 4,755 | | | $ | 1,973 | |
Preferred Equity
Our board of trustees can, at its discretion, authorize the issuance of up to 10.0 million preferred shares. The ability to issue preferred equity provides WashREIT an additional financing tool that may be used to raise capital for future acquisitions or other business purposes. As of December 31, 2020, no preferred shares are issued and outstanding.
Capital Commitments
We will require capital for development and redevelopment projects currently underway and in the future. We are currently engaged in development activities for the ground-up development of a multifamily property (Trove) on land adjacent to The Wellington and predevelopment activities for the ground-up development of a multifamily property on land adjacent to Riverside Apartments. As of December 31, 2020, we had no outstanding contractual commitments related to our development and redevelopment projects, and expect to fund approximately $5.0 - $7.5 million of total development and redevelopment spending during 2021.
In addition to our development and redevelopment projects, we anticipate funding several major renovation projects in our portfolios during 2021, as follows (in thousands):
| | | | | |
| Multifamily | $ | 15,500 | |
| Office | 4,000 | |
| Other | 100 | |
| Total | $ | 19,600 | |
These projects include unit, common area, lobby and pool deck renovations, elevator modernizations, mechanical upgrades, facade restorations and roof replacements at multifamily properties; HVAC replacements, common area renovations and new conference space buildout at office properties; and garage repairs at retail properties. Not all of the anticipated spending had been committed via executed construction contracts at December 31, 2020. We expect to fund these projects using cash generated by our real estate operations, through borrowings on our Revolving Credit Facility, or raising additional debt or equity capital in the public market.
Contractual Obligations
As of December 31, 2020, certain contractual obligations will require significant capital as follows (in thousands):
| | | | | | | | | | | | | | | | | | | | | | | | | | | | | |
| | Payments due by Period |
| | Total | | Less than 1
year | | 1-3 years | | 4-5 years | | After 5
years |
Long-term debt(1) | $ | 1,208,527 | | | $ | 38,618 | | | $ | 671,139 | | | $ | 35,990 | | | $ | 462,780 | |
Purchase obligations(2) | 8,332 | | | 3,669 | | | 4,663 | | | — | | | — | |
| | | | | | | | | |
Tenant-related capital(3) | 3,592 | | | 2,101 | | | 1,491 | | | — | | | — | |
Building capital(4) | 2,061 | | | 2,061 | | | — | | | — | | | — | |
| Operating leases | 13,480 | | | 285 | | | 780 | | | 520 | | | 11,895 | |
______________________________
(1)See notes 5, 6 and 7 of the consolidated financial statements. Amounts include principal, interest and facility fees.
(2)Represents electricity and gas purchase agreements with terms through 2024.
(3)Committed tenant-related capital based on executed leases as of December 31, 2020.
(4)Committed building capital additions based on contracts in place as of December 31, 2020.
We have various standing or renewable contracts with vendors. The majority of these contracts can be canceled with immaterial or no cancellation penalties, with the exception of our elevator maintenance agreements and our electricity and gas purchase agreements, which are included above on the purchase obligations line. Contract terms on leases that can be canceled are generally one year or less. We are currently committed to fund tenant-related capital improvements as described in the table above for executed leases. However, expected leasing levels could require additional tenant-related capital improvements which are not currently committed. We expect that total tenant-related capital improvements, including those already committed, will be approximately $10.0 - $15.0 million in 2021.
Historical Cash Flows
Cash flows from operations are an important factor in our ability to sustain our dividend at its current rate. If our cash flows from operations were to decline significantly, we may have to reduce our dividend. Consolidated cash flows for the three years ended December 31, 2020 were as follows (in thousands):
| | | | | | | | | | | | | | | | | | | | | | | | | | | | | |
| | Year ended December 31, | | Variance |
| | 2020 | | 2019 | | 2018 | | 2020 vs. 2019 | | 2019 vs. 2018 |
| Cash provided by operating activities | $ | 112,991 | | | $ | 130,923 | | | $ | 147,369 | | | $ | (17,932) | | | $ | (16,446) | |
| Cash provided by (used in) investing activities | 65,760 | | | 61,036 | | | (38,942) | | | 4,724 | | | 99,978 | |
| Cash used in financing activities | (185,199) | | | (184,848) | | | (113,410) | | | (351) | | | (71,438) | |
Net cash provided by operating activities decreased in 2020 as compared to 2019 primarily due to the sales of the Retail Portfolio and 1776 G Street during 2019 and John Marshall II in 2020 (see note 3 to the consolidated financial statements). Net cash provided by operating activities decreased in 2019 as compared to 2018 primarily due to the sales of the Retail Portfolio during 2019 (see note 3 to the consolidated financial statements) and 2445 M Street in 2018, partially offset by the acquisition of the Assembly Portfolio and Cascade at Landmark during 2019.
Net cash provided by investing activities increased in 2020 as compared to 2019 primarily due to lower development expenditures during 2020. Net cash provided by investing activities increased in 2019 as compared to 2018 primarily due to a higher volume of disposition activity during 2019, partially offset by a higher volume of acquisition activity and higher development expenditures during 2019.
Net cash used in financing activities increased in 2020 as compared to 2019 primarily due to higher repayments of notes payable and term loans, the repayment of the mortgage note and the settlement of interest rate swaps (see note 8 to the consolidated financial statements), partially offset by lower net repayments on the Revolving Credit Facility. Net cash used in financing activities increased in 2019 as compared to 2018 primarily due to higher net repayments on the Revolving Credit Facility, partially offset by lower mortgage note repayments and higher proceeds from equity issuances.
Capital Improvements and Development Costs
Our capital improvement, development and redevelopment costs for the three years ended December 31, 2020 were as follows (in thousands):
| | | | | | | | | | | | | | | | | |
| | Year Ended December 31, |
| | 2020 | | 2019 | | 2018 |
| Accretive capital improvements and development costs: | | | | | |
| Acquisition related | $ | 10,487 | | | $ | 9,158 | | | $ | 13,489 | |
| Expansions and major renovations | 16,561 | | | 25,008 | | | 26,045 | |
| Development/redevelopment | 28,812 | | | 47,492 | | | 34,806 | |
| Tenant improvements (including first generation leases) | 21,785 | | | 28,565 | | | 24,914 | |
Total accretive capital improvements (1) | 77,645 | | | 110,223 | | | 99,254 | |
| Other capital improvements: | 9,262 | | | 5,725 | | | 6,622 | |
| Total | $ | 86,907 | | | $ | 115,948 | | | $ | 105,876 | |
______________________________
(1) We consider these capital improvements to be accretive to revenue and not necessarily to net income.
Included in the capital improvement and development costs listed above are capitalized interest in the amount of $2.2 million, $3.2 million and $2.1 million for the three years ended December 31, 2020, respectively, and capitalized employee compensation in the amount of $2.0 million, $1.2 million and $2.7 million for the three years ended December 31, 2020, respectively.
Accretive Capital Improvements
Acquisition Related Improvements: Acquisition related improvements are capital improvements to properties acquired during the preceding three years which were anticipated at the time we acquired the properties. These types of improvements were made in 2020 to the Assembly Portfolio and Cascade at Landmark.
Expansions and Major Renovations: Expansion projects increase the rentable area of a property, while major renovation projects are improvements sufficient to increase the income otherwise achievable at a property. Expansions and major renovations during 2020 included common area, lobby, unit and facade renovations at Riverside Apartments; retail space renovations at 1775 Eye Street; heating system replacement, roof replacement and unit renovations at The Kenmore; heating system replacement and elevator modernization at The Ashby and roof replacement and unit renovations at 3801 Connecticut Avenue.
Development/Redevelopment: Development costs represent expenditures for ground up development of new operating properties. Redevelopment costs represent expenditures for improvements intended to reposition properties in their markets and increase income than would be otherwise achievable. Development/redevelopment costs in 2020 primarily include development costs for Trove, a multifamily development adjacent to The Wellington and predevelopment costs for a future multifamily development adjacent to Riverside Apartments.
Tenant Improvements: Tenant improvements are costs, such as space build-outs, associated with commercial lease transactions. Our average tenant improvement costs per square foot of space leased during the three years ended December 31, 2020 were as follows:
| | | | | | | | | | | | | | | | | |
| | Year Ended December 31, |
| 2020 | | 2019 | | 2018 |
| Office | $ | 23.03 | | | $ | 69.99 | | | $ | 33.51 | |
The $46.96 decrease in 2020 and the $36.48 increase in 2019 in tenant improvement costs per square foot of office space leased was primarily due to new leases at Watergate 600 and Monument II executed in 2019.
Other Capital Improvements
Other capital improvements, also referred to as recurring capital improvements, are those not included in the above categories. Over time these costs will be recurring in nature to maintain a property's income and value. In our multifamily properties, this category includes improvements made as needed upon vacancy of an apartment. Such improvements totaled $3.6 million in 2020, averaging approximately $1,284 per apartment for the 42% of apartments which turned over relative to our total portfolio of apartment units. In our commercial properties and multifamily properties (aside from improvements related to apartment turnover), improvements include facade repairs, installation of new heating and air conditioning equipment, asphalt replacement, permanent landscaping, new lighting and new finishes. In addition, we incurred repair and maintenance expense of $5.9 million during 2020 to maintain the quality of our buildings.
Off Balance Sheet Arrangements
We have no off-balance sheet arrangements as of December 31, 2020 that are reasonably likely to have a current or future material effect on our financial condition, revenues or expenses, results of operations, liquidity, capital expenditures or capital resources.
Forward-Looking Statements
Some of the statements contained in this Form 10-K constitute forward-looking statements within the meaning of federal securities laws. Forward-looking statements relate to expectations, beliefs, projections, future plans and strategies, anticipated events or trends and similar expressions concerning matters that are not historical facts. In some cases, you can identify forward-looking statements by the use of forward-looking terminology such as “may,” “will,” “should,” “expects,” “intends,” “plans,” “anticipates,” “believes,” “estimates,” “predicts,” or “potential” or the negative of these words and phrases or similar words or phrases which are predictions of or indicate future events or trends and which do not relate solely to historical matters. Such statements involve known and unknown risks, uncertainties, and other factors which may cause the actual results, performance, or achievements of WashREIT to be materially different from future results, performance or achievements expressed or implied by such forward-looking statements. Additional factors include, but are not limited to:
(a)the ultimate duration of the COVID-19 global pandemic, including any mutations thereof, the actions taken to contain the pandemic or mitigate its impact, and the direct and indirect economic effects of the pandemic and containment measures, the speed of the vaccine rollout, the effectiveness and willingness of people to take COVID-19 vaccines, and the duration of associated immunity and efficacy of the vaccines against emerging variants of COVID-19;
(b)the risks associated with ownership of real estate in general and our real estate assets in particular;
(c)the economic health of the greater Washington metro region;
(d)the risk of failure to enter into and/or complete contemplated acquisitions and dispositions, at all, within the price ranges anticipated and on the terms and timing anticipated;
(e)changes in the composition of our portfolio;
(f)fluctuations in interest rates;
(g)reductions in or actual or threatened changes to the timing of federal government spending;
(h)the risks related to use of third-party providers;
(i)the economic health of our tenants;
(j)shifts away from brick and mortar stores to e-commerce;
(k)the availability and terms of financing and capital and the general volatility of securities markets;
(l)compliance with applicable laws, including those concerning the environment and access by persons with disabilities;
(m)the risks related to not having adequate insurance to cover potential losses;
(n)the risks related to our organizational structure and limitations of stock ownership;
(o)changes in the market value of securities;
(p)terrorist attacks or actions and/or cyber-attacks;
(q)failure to qualify and maintain our qualification as a REIT and the risks of changes in laws affecting REITs; and
(r)other factors discussed under the caption “Risk Factors.”
While forward-looking statements reflect our good faith beliefs, they are not guarantees of future performance. For a further discussion of these and other factors that could cause our future results to differ materially from any forward-looking statements, see the section entitled “Risk Factors.” We undertake no obligation to update our forward-looking statements or risk factors to reflect new information, future events, or otherwise.
Funds From Operations
NAREIT FFO is a widely used measure of operating performance for real estate companies. In its 2018 NAREIT FFO White Paper Restatement, the National Association of Real Estate Investment Trusts, Inc. (“NAREIT”) defines NAREIT FFO as net income (computed in accordance with GAAP) excluding gains (or losses) associated with sales of properties; impairments of depreciable real estate, and real estate depreciation and amortization. We consider NAREIT FFO to be a standard supplemental measure for REITs, and believe it is a useful metric because it facilitates an understanding of the operating performance of our properties without giving effect to real estate depreciation and amortization, which historically assumes that the value of real estate assets diminishes predictably over time. Since real estate values have instead historically risen or fallen with market conditions, we believe that NAREIT FFO more accurately provides investors an indication of our ability to incur and service debt, make capital expenditures and fund other needs. Our NAREIT FFO may not be comparable to FFO reported by other REITs. These other REITs may not define the term in accordance with the current NAREIT definition or may interpret the current NAREIT definition differently.
The following table provides the calculation of our NAREIT FFO and a reconciliation of NAREIT FFO to net income for the three years ended December 31, 2020 (in thousands):
| | | | | | | | | | | | | | | | | |
| Year Ended December 31, |
| 2020 | | 2019 | | 2018 |
| Net (loss) income | $ | (15,680) | | | $ | 383,550 | | | $ | 25,630 | |
| Adjustments: | | | | | |
| Depreciation and amortization | 120,030 | | | 136,253 | | | 111,826 | |
| Real estate impairment | — | | | 8,374 | | | 1,886 | |
| Loss (gain) on sale of depreciable real estate | 15,009 | | | (59,961) | | | (2,495) | |
| | | | | |
| Discontinued operations: | | | | | |
| Depreciation and amortization | — | | | 4,926 | | | 9,402 | |
| Gain on sale of depreciable real estate | — | | | (339,024) | | | — | |
| NAREIT FFO | $ | 119,359 | | | $ | 134,118 | | | $ | 146,249 | |
Critical Accounting Policies and Estimates
We base the discussion and analysis of our financial condition and results of operations upon our consolidated financial statements, which have been prepared in accordance with GAAP. The preparation of these financial statements requires us to make estimates and judgments that affect the reported amounts of assets, liabilities, revenues and expenses. We evaluate these estimates on an on-going basis, including those related to estimated useful lives of real estate assets, estimated fair value of acquired leases, cost reimbursement income, bad debts, contingencies and litigation. We base the estimates on historical experience and on various other assumptions that we believe to be reasonable under the circumstances, the results of which form the basis for making judgments about the carrying values of assets and liabilities that are not readily apparent from other sources. We cannot assure you that actual results will not differ from those estimates.
We believe the following accounting estimates are the most critical to aid in fully understanding our reported financial results, and they require our most difficult, subjective or complex judgments, resulting from the need to make estimates about the effect of matters that are inherently uncertain.
Accounting for Real Estate Acquisitions
We record acquired assets, including physical assets and in-place leases, and assumed liabilities, based on their fair values. We determine the estimated fair values of the assets and liabilities in accordance with current GAAP fair value provisions. We determine the fair values of acquired buildings on an “as-if-vacant” basis considering a variety of factors, including the replacement cost of the property, estimated rental and absorption rates, estimated future cash flows and valuation assumptions consistent with current market conditions. We determine the fair value of land acquired based on comparisons to similar properties that have been recently marketed for sale or sold.
The fair value of in-place leases consists of the following components: (a) the estimated cost to us to replace the leases, including foregone rents during the period of finding a new tenant and foregone recovery of tenant pass-throughs (referred to as “absorption cost”); (b) the estimated cost of tenant improvements, and other direct costs associated with obtaining a new tenant (referred to as “tenant origination cost”); (c) estimated leasing commissions associated with obtaining a new tenant (referred to as “leasing commissions”); (d) the above/at/below market cash flow of the leases, determined by comparing the projected cash flows of the leases in place, including consideration of renewal options, to projected cash flows of comparable market-rate leases (referred to as “net lease intangible”); and (e) the value, if any, of customer relationships, determined based on our evaluation of the specific characteristics of each tenant’s lease and our overall relationship with the tenant (referred to as “customer relationship value”). We discount the amounts used to calculate net lease intangibles using an interest rate which reflects the risks associated with the leases acquired. We include tenant origination costs in income producing property on our balance sheet and amortize the tenant origination costs as depreciation expense on a straight-line basis over the useful life of the asset, which is typically the remaining life of the underlying leases. We classify leasing commissions and absorption costs as other assets and amortize leasing commissions and absorption costs as amortization expense on a straight-line basis over the remaining life of the underlying leases. We classify above market net lease intangible assets as other assets and amortize them on a straight-line basis as a decrease to real estate rental revenue over the remaining term of the underlying leases. We classify below market net lease intangible liabilities as other liabilities and amortize them on a straight-line basis as an increase to real estate rental revenue over the remaining term of the underlying leases. If any of the fair value of below market lease intangibles
includes fair value associated with a renewal option, such amounts are not amortized until the renewal option is executed. If the renewal option is not executed, the related value is expensed at that time. Should a tenant terminate its lease prior to the expiration date, we accelerate the amortization of the unamortized portion of the tenant origination cost (if it has no future value), leasing commissions, absorption costs and net lease intangible associated with that lease over its new shorter term.
Credit Losses on Lease Related Receivables
Lease related receivables, which include contractual amounts accrued and unpaid from tenants and accrued straight-line rents receivable, are reduced for credit losses. Such amounts are recognized as a reduction to real estate rental revenues. We evaluate the collectability of lease receivables monthly using several factors including a lessee’s creditworthiness. We recognize the credit loss on lease related receivables when, in the opinion of management, collection of substantially all lease payments is not probable. When collectability is determined not probable, any lease income recognized subsequent to recognizing the credit loss is limited to the lesser of the lease income reflected on a straight-line basis or cash collected.
Real Estate Impairment
We recognize impairment losses on long-lived assets used in operations, development assets or land held for future development, if indicators of impairment are present and the net undiscounted cash flows estimated to be generated by those assets are less than the assets' carrying amount. Estimates of undiscounted cash flows are based on forward-looking assumptions, including annual and residual cash flows and our estimated holding period for each property. Such assumptions involve a high degree of judgment and could be affected by future economic and market conditions. When determining if a property has indicators of impairment, we evaluate the property's occupancy, our expected holding period for the property, strategic decisions regarding the property's future operations or development and other market factors. If such carrying amount is in excess of the estimated undiscounted cash flows from the operation and disposal of the property, we would recognize an impairment loss equivalent to an amount required to adjust the carrying amount to its estimated fair value, calculated in accordance with current GAAP fair value provisions. Assets held for sale are recorded at the lower of cost or fair value less costs to sell.
U.S. Federal Income Taxes
Generally, and subject to our ongoing qualification as a REIT, no provisions for income taxes are necessary except for taxes on undistributed taxable income and taxes on the income generated by our taxable REIT subsidiaries (“TRSs”). Our TRSs are subject to corporate U.S. federal and state income tax on their taxable income at regular statutory rates, or as calculated under the alternative minimum tax, as appropriate. As of both December 31, 2020 and 2019, our TRSs had a deferred tax asset of $1.4 million that was fully reserved. As of December 31, 2019, we had deferred state and local tax liabilities of $0.6 million. These deferred tax liabilities were primarily related to temporary differences in the timing of the recognition of revenue, amortization and depreciation. We did not have deferred state or local tax liabilities as of December 31, 2020.
ITEM 7A: QUANTITATIVE AND QUALITATIVE DISCLOSURES ABOUT MARKET RISK
The principal material financial market risk to which we are exposed is interest rate risk. Our exposure to interest rate risk relates primarily to refinancing long-term fixed rate obligations, the opportunity cost of fixed rate obligations in a falling interest rate environment and our variable rate line of credit. We primarily enter into debt obligations to support general corporate purposes, including acquisition of real estate properties, capital improvements and working capital needs. We use interest rate swap arrangements to reduce our exposure to the variability in future cash flows attributable to changes in interest rates.
The table below presents principal, interest and related weighted average fair value interest rates by year of maturity, with respect to debt outstanding on December 31, 2020.
| | | | | | | | | | | | | | | | | | | | | | | | | | | | | | | | | | | | | | | | | | | | | | | |
| 2021 | | 2022 | | 2023 | | 2024 | | 2025 | | Thereafter | | Total | | Fair Value |
| (dollars in thousands) | | | | | | | |
Unsecured fixed rate debt (1) | | | | | | | | | | | | | | |
| Principal | $ | — | | | $ | 300,000 | | | $ | 250,000 | | | $ | — | | | $ | — | | | $ | 400,000 | | | $ | 950,000 | | | $ | 978,678 | |
| Interest payments | $ | 37,218 | | | $ | 37,218 | | | $ | 22,177 | | | $ | 17,995 | | | $ | 17,995 | | | $ | 80,775 | | | $ | 213,378 | | | |
| Interest rate on debt maturities | — | % | | 4.0 | % | | 2.6 | % | | — | % | | — | % | | 4.5 | % | | 3.8 | % | | |
| Unsecured variable rate debt | | | | | | | | | | | | | | |
| Principal | $ | — | | | $ | — | | | $ | 42,000 | | | $ | — | | | $ | — | | | $ | — | | | $ | 42,000 | | | $ | 42,000 | |
| Variable interest rate on debt maturities | | | | | 1.1 | % | | | | | | | | 1.1 | % | | |
| | | | | | | | | | | | | | | |
| | | | | | | | | | | | | | | |
| | | | | | | | | | | | | | | |
| | | | | | | | | | | | | | | |
______________________________
(1) Includes $250.0 million term loan with a floating interest rate. The interest rate on the $250.0 million term loan is effectively fixed by interest rate swap arrangements at 2.9%.
We entered into the interest rate swap arrangements designated and qualifying as cash flow hedges to reduce our exposure to the variability in future cash flows attributable to changes in interest rates. Derivative instruments expose us to credit risk in the event of non-performance by the counterparty under the terms of the interest rate hedge agreement. We believe that we minimize our credit risk on these transactions by dealing with major, creditworthy financial institutions. As part of our ongoing control procedures, we monitor the credit ratings of counterparties and our exposure to any single entity, thus minimizing our credit risk concentration.
The following table sets forth information pertaining to interest rate swap contracts in place as of December 31, 2020 and 2019 and their respective fair values (dollars in thousands):
| | | | | | | | | | | | | | | | | | | | | | | | | | | | | | | | | | | | | | |
| Notional Amount | | | | Floating Index Rate | | | | | | Fair Value as of: |
| Fixed Rate | | | Effective Date | | Expiration Date | | December 31, 2020 | | December 31, 2019 |
| $ | 75,000 | | | 1.619% | | One-Month USD-LIBOR | | 10/15/2015 | | 3/15/2021 | | $ | — | | | $ | (28) | |
| 75,000 | | | 1.626% | | One-Month USD-LIBOR | | 10/15/2015 | | 3/15/2021 | | — | | | (34) | |
| 100,000 | | | 1.205% | | One-Month USD-LIBOR | | 3/31/2017 | | 7/21/2023 | | (2,671) | | | 1,218 | |
| 50,000 | | | 1.208% | | One-Month USD-LIBOR | | 3/31/2017 | | 7/21/2023 | | (1,338) | | | 607 | |
| 25,000 | | | 2.610% | | One-Month USD-LIBOR | | 6/29/2018 | | 7/21/2023 | | (1,562) | | | (917) | |
| 25,000 | | | 2.610% | | One-Month USD-LIBOR | | 6/29/2018 | | 7/21/2023 | | (1,562) | | | (915) | |
| 25,000 | | | 2.610% | | One-Month USD-LIBOR | | 6/29/2018 | | 7/21/2023 | | (1,561) | | | (917) | |
| 25,000 | | | 2.610% | | One-Month USD-LIBOR | | 6/29/2018 | | 7/21/2023 | | (1,561) | | | (915) | |
| 50,000 | | | 1.680% | | One-Month USD-LIBOR | | 4/1/2020 | | 4/1/2030 | | — | | | 844 | |
| 50,000 | | | 1.680% | | One-Month USD-LIBOR | | 4/1/2020 | | 4/1/2030 | | — | | | 844 | |
| 50,000 | | | 1.718% | | One-Month USD-LIBOR | | 4/1/2020 | | 4/1/2030 | | — | | | 1,018 | |
| 50,000 | | | 1.718% | | One-Month USD-LIBOR | | 4/1/2020 | | 4/1/2030 | | — | | | 1,018 | |
| $ | 600,000 | | | | | | | | | | | $ | (10,255) | | | $ | 1,823 | |
In September 2020, in conjunction with the entry into the note purchase agreement to issue the Green Bonds, we terminated $200.0 million of four forward interest rate swap arrangements that we had entered into in November 2019 and which were effective as of
April 1, 2020, designated as cash flow hedges of the interest rate variability on the issuance of unsecured notes. On October 2, 2020, we paid the $20.4 million liability associated with the termination of the forward swaps.
In December 2020, in connection with the prepayment of our 2015 Term Loan, we terminated two interest rate swap agreements with notional amounts in the aggregate of $150.0 million resulting in a loss on interest rate derivatives of approximately $0.6 million.
ITEM 8: FINANCIAL STATEMENTS AND SUPPLEMENTARY DATA
| | |
The financial statements and supplementary data appearing on pages 86 to 125 are incorporated herein by reference. |
ITEM 9: CHANGES IN AND DISAGREEMENTS WITH ACCOUNTANTS ON ACCOUNTING AND FINANCIAL DISCLOSURE
None.
ITEM 9A: CONTROLS AND PROCEDURES
We maintain disclosure controls and procedures that are designed to ensure that information required to be disclosed in our Securities Exchange Act reports is recorded, processed, summarized and reported within the time periods specified in the SEC’s rules and forms, and that such information is accumulated and communicated to our management, including our Chief Executive Officer, Chief Financial Officer and Chief Accounting Officer, as appropriate, to allow timely decisions regarding required disclosure. In designing and evaluating the disclosure controls and procedures, management recognized that any controls and procedures, no matter how well designed and operated, can provide only reasonable assurance of achieving the desired control objectives, and management necessarily was required to apply its judgment in evaluating the cost-benefit relationship of possible controls and procedures.
We carried out an evaluation, under the supervision and with the participation of our management, including our Chief Executive Officer, Chief Financial Officer and Chief Accounting Officer, of the effectiveness of the design and operation of our disclosure controls and procedures as of December 31, 2020. Based on the foregoing, our Chief Executive Officer, Chief Financial Officer and Chief Accounting Officer concluded that our disclosure controls and procedures were effective at a reasonable assurance level.
Internal Control over Financial Reporting
See the Report of Management in Item 8 of this Form 10-K.
See the Reports of Independent Registered Public Accounting Firm in Item 8 of this Form 10-K.
During the three months ended December 31, 2020, there was no change in our internal control over financial reporting that has materially affected, or is reasonably likely to materially affect, our internal control over financial reporting.
ITEM 9B: OTHER INFORMATION
Amendment to the Articles of Amendment and Restatement, as amended
On February 10, 2021, the Board of Trustees (the “Board”) approved an amendment to our Articles of Amendment and Restatement, as amended (the “Charter”) to increase the number of common shares of beneficial interest, $0.01 par value per share (“Common Shares”), authorized by the Charter from 100,000,000 to 150,000,000, and a corresponding increase in the total number of authorized shares of beneficial interest of the Company from 110,000,000 to 160,000,000 (the “Amendment”). The Company filed the Amendment with the State Department of Assessments and Taxation of Maryland on February 10, 2021, which became effective upon filing. Prior to the filing of the Amendment, the Company had approximately 15.5 million, or less than 16%, of the total number of authorized Common Shares available for future issuance. The Amendment was intended to preserve operational flexibility in the current business environment and ensure the Company has adequate available authorized capacity to take advantage of favorable market conditions and strategic opportunities that may arise, including the ability to access the capital markets, finance the acquisition and development of properties and pursue other opportunities integral to the Company’s growth and success. The foregoing description of the Amendment does not purport to be complete and is qualified in its entirety by reference to the complete Amendment, a copy of which is filed as Exhibit 3.2 to this Annual Report on Form 10-K and is incorporated herein by reference.
Material U.S. Federal Income Tax Considerations
The following is a summary of certain material U.S. federal income tax considerations relating to our qualification and taxation as a real estate investment trust, a “REIT,” and the acquisition, holding, and disposition of (i) our common shares, preferred
shares and depositary shares (together with common shares and preferred shares, the “shares”) as well as our warrants and rights, and (ii) certain debt securities that we may offer (together with the shares, the “securities”). For purposes of this discussion, references to “our Company,” “we” and “us” mean only Washington Real Estate Investment Trust and not its subsidiaries or affiliates. This summary is based upon the Internal Revenue Code of 1986, as amended, (the “Code”), the Treasury Regulations, rulings and other administrative interpretations and practices of the Internal Revenue Service (“IRS”) (including administrative interpretations and practices expressed in private letter rulings, which are binding on the IRS only with respect to the particular taxpayers who requested and received those rulings), and judicial decisions, all as currently in effect, and all of which are subject to differing interpretations or to change, possibly with retroactive effect. No assurance can be given that the IRS would not assert, or that a court would not sustain, a position contrary to any of the tax consequences described below. We have not sought and will not seek an advance ruling from the IRS regarding any matter discussed in this section. The summary is also based upon the assumption that we will operate the Company and its subsidiaries and affiliated entities in accordance with their applicable organizational documents. This summary is for general information only, and does not purport to discuss all aspects of U.S. federal income taxation that may be important to a particular investor in light of its investment or tax circumstances, or to investors subject to special tax rules, including:
•tax-exempt organizations, except to the extent discussed below in “—Taxation of U.S. Shareholders—Taxation of Tax-Exempt Shareholders” and “Taxation of Holders of Debt Securities-Tax-Exempt Holders of Debt Securities,”
•broker-dealers,
•non-U.S. corporations, non-U.S. partnerships, non-U.S. trusts, non-U.S. estates, or individuals who are not taxed as citizens or residents of the United States, all of which may be referred to collectively as “non-U.S. persons,” except to the extent discussed below in “—Taxation of Non-U.S. Shareholders” and “—Taxation of Holders of Debt Securities—Non-U.S. Holders of Debt Securities,”
•trusts and estates,
•regulated investment companies (“RICs”)
•REITs, financial institutions,
•insurance companies,
•subchapter S corporations,
•foreign (non-U.S. governments),
•persons subject to the alternative minimum tax provisions of the Code,
•persons holding the shares as part of a “hedge,” “straddle,” “conversion,” “synthetic security” or other integrated investment,
•persons holding the shares through a partnership or similar pass-through entity,
•persons with a “functional currency” other than the U.S. dollar,
•persons holding 10% or more (by vote or value) of the beneficial interest in us, except to the extent discussed below,
•persons who do not hold the shares as a “capital asset,” within the meaning of Section 1221 of the Code,
•corporations subject to the provisions of Section 7874 of the Code,
•U.S. expatriates, or
•persons otherwise subject to special tax treatment under the Code.
This summary does not address state, local or non-U.S. tax considerations. This summary also does not consider tax considerations that may be relevant with respect to securities we may issue, or selling security holders may sell, other than our shares and certain debt instruments described below. Each time we or selling security holders sell securities, we will provide a prospectus supplement that will contain specific information about the terms of that sale and may add to, modify or update the discussion below, as appropriate.
Each prospective investor is advised to consult his or her tax advisor to determine the impact of his or her personal tax situation on the anticipated tax consequences of the acquisition, ownership and sale of our shares, warrants, rights and/or debt securities. This includes the U.S. federal, state, local, foreign and other tax considerations of the ownership and sale of our shares, warrants, rights and/or debt securities, and the potential changes in applicable tax laws.
Taxation of the Company as a REIT
We elected to be taxed as a REIT, commencing with our first taxable year ended December 31, 1960. A REIT generally is not subject to U.S. federal income tax on the “REIT taxable income” (generally, taxable income of the REIT subject to specified adjustments, including a deduction for dividends paid and excluding net capital gain) that it distributes to shareholders, provided that the REIT meets the annual REIT distribution requirement and the other requirements for qualification as a REIT under the Code. We believe that we are organized and have operated, and we intend to continue to operate, in a manner so as to qualify for taxation as a REIT under the Code. However, qualification and taxation as a REIT depend upon our ability to meet the various qualification tests imposed under the Code, including (through our actual annual (or in some cases quarterly) operating results) requirements relating to income, asset ownership, distribution levels and diversity of share ownership. Given the complex nature of the REIT qualification requirements, the ongoing importance of factual determinations and the possibility of future changes in our circumstances, we cannot provide any assurances that we will be organized or operated in a manner so as to satisfy the requirements for qualification and taxation as a REIT under the Code, or that we will meet such requirements in the future. See “—Failure to Qualify as a REIT.”
The sections of the Code that relate to our qualification and taxation as a REIT are highly technical and complex. This discussion sets forth the material aspects of the Code sections that govern the U.S. federal income tax treatment of a REIT and its shareholders. This summary is qualified in its entirety by the applicable Code provisions, relevant rules and Treasury Regulations, and related administrative and judicial interpretations.
Taxation of REITs in General
For each taxable year in which we qualify for taxation as a REIT, we generally will not be subject to U.S. federal corporate income tax on our “REIT taxable income” (generally, taxable income subject to specified adjustments, including a deduction for dividends paid and excluding our net capital gain) that is distributed currently to our shareholders. This treatment substantially eliminates the “double taxation” at the corporate and shareholder levels that generally results from an investment in a non-REIT C corporation. A non-REIT C corporation is a corporation that generally is required to pay tax at the corporate level. Double taxation means taxation once at the corporate level when income is earned and once again at the shareholder level when the income is distributed. In general, the income that we generate is taxed only at the shareholder level upon a distribution of dividends to our shareholders.
U.S. shareholders generally will be subject to taxation on dividends distributed by us (other than designated capital gain dividends and “qualified dividend income”) at rates applicable to ordinary income, instead of at lower capital gain rates. For taxable years beginning before January 1, 2026, generally, U.S. shareholders that are individuals, trusts or estates may deduct 20% of the aggregate amount of ordinary dividends distributed by us, subject to certain limitations. Capital gain dividends and qualified dividend income will continue to be subject to a maximum 20% rate.
Any net operating losses, foreign tax credits and other tax attributes of a REIT generally do not pass through to our shareholders, subject to special rules for certain items such as the net capital gain that we recognize.
Even if we qualify for taxation as a REIT, we will be subject to U.S. federal income tax in the following circumstances:
1.We will be taxed at regular corporate rates on any undistributed “REIT taxable income,” including any undistributed net capital gain. REIT taxable income is the taxable income of the REIT subject to specified adjustments, including a deduction for dividends paid.
2.If we have (1) net income from the sale or other disposition of “foreclosure property” that is held primarily for sale to customers in the ordinary course of business, or (2) other non-qualifying income from foreclosure property, such income will be subject to tax at the highest corporate rate.
3.Our net income from “prohibited transactions” will be subject to a 100% penalty tax. In general, prohibited transactions are sales or other dispositions of property held primarily for sale to customers in the ordinary course of business, other than foreclosure property.
4.If we fail to satisfy either the 75% gross income test or the 95% gross income test, as discussed below, but our failure is due to reasonable cause and not due to willful neglect and we nonetheless maintain our qualification as a REIT because we satisfy specified cure provisions, we will be subject to a 100% tax on an amount equal to (a) the greater of (1) the amount by which we fail the 75% gross income test or (2) the amount by which we fail the 95% gross income test, as the case may be, multiplied by (b) a fraction intended to reflect our profitability.
5.We will be subject to a 4% nondeductible excise tax on the excess of the required calendar year distribution over the sum of the amounts actually distributed, excess distributions from the preceding tax year and amounts retained for which U.S. federal income tax was paid. The required distribution for each calendar year is equal to the sum of:
•85% of our REIT ordinary income for the year;
•95% of our REIT capital gain net income for the year, other than capital gains we elect to retain and pay tax on as described below; and
•any undistributed taxable income from prior taxable years.
6.We will be subject to a 100% penalty tax on certain rental income we receive when a taxable REIT subsidiary provides services to our tenants, on certain expenses deducted by a taxable REIT subsidiary on payments made to us and, effective for our taxable years beginning after December 31, 2015, on income for services rendered to us by a taxable REIT subsidiary, if the arrangements among us, our tenants, and our taxable REIT subsidiaries do not reflect arm’s-length terms.
7.If we acquire any assets from a non-REIT C corporation in a carry-over basis transaction, we would be liable for corporate income tax, at the highest applicable corporate rate, on the “built-in gain” inherent in those assets if we disposed of those assets within five years after they were acquired. To the extent that assets are transferred to us in a carry-over basis transaction by a partnership in which a non-REIT C corporation owns an interest, we will be subject to this tax in proportion to the non-REIT C corporation’s interest in the partnership. Built-in gain is the amount by which an asset’s fair market value exceeds its adjusted tax basis at the time we acquire the asset. The results described in this paragraph assume that the non-REIT C corporation or partnership transferor will not elect, in lieu of this treatment, to be subject to an immediate tax when the asset is acquired by us.
8.We may elect to retain and pay U.S. federal income tax on our net long-term capital gain. In that case, a U.S. shareholder would include its proportionate share of our undistributed long-term capital gain (to the extent that we make a timely designation of such gain to the shareholder) in its income, would be deemed to have paid the tax we paid on such gain, and would be allowed a credit for its proportionate share of the tax deemed to have been paid, and an adjustment would be made to increase the basis of the U.S. shareholder in our common shares.
9.If we violate an asset test (other than certain de minimis violations) or other requirements applicable to REITs, as described below, but our failure is due to reasonable cause and not due to willful neglect and we nevertheless maintain our REIT qualification because we satisfy specified cure provisions, we will be subject to a tax equal to the greater of $50,000 or the amount determined by multiplying the net income generated by such non-qualifying assets by the highest rate of tax applicable to non-REIT C corporations during periods when owning such assets would have caused us to fail the relevant asset test.
10.If we fail to satisfy a requirement under the Code and the failure would result in the loss of our REIT qualification, other than a failure to satisfy a gross income test or an asset test, as described above, but nonetheless maintain our qualification as a REIT because the requirements of certain relief provisions are satisfied, we will be subject to a penalty of $50,000 for each such failure.
11.If we fail to comply with the requirement to send annual letters to our shareholders requesting information regarding the actual ownership of our shares and the failure was not due to reasonable cause or was due to willful neglect, we will be subject to a $25,000 penalty or, if the failure is intentional, a $50,000 penalty.
12.The earnings of any subsidiaries that are non-REIT C corporations, including any taxable REIT subsidiaries, are subject to U.S. federal corporate income tax.
Notwithstanding our qualification as a REIT, we and our subsidiaries may be subject to a variety of taxes, including payroll taxes and state, local, and foreign income, property and other taxes on our assets, operations and/or net worth. We could also be subject to tax in situations and on transactions not presently contemplated.
Requirements for Qualification as a REIT
The Code defines a “REIT” as a corporation, trust or association:
(1) that is managed by one or more trustees or directors;
(2) that issues transferable shares or transferable certificates to evidence its beneficial ownership;
(3) that would be taxable as a domestic corporation, but for Sections 856 through 859 of the Code;
(4) that is neither a financial institution nor an insurance company within the meaning of certain provisions of the Code;
(5) that is beneficially owned by 100 or more persons;
(6) not more than 50% in value of the outstanding shares or other beneficial interest of which is owned, actually or constructively, by five or fewer individuals (as defined in the Code to include certain entities and as determined by applying certain attribution rules) during the last half of each taxable year;
(7) that makes an election to be a REIT for the current taxable year, or has made such an election for a previous taxable year that has not been revoked or terminated, and that satisfies all relevant filing and other administrative requirements established by the IRS that must be met to elect and maintain REIT status;
(8) that uses a calendar year for U.S. federal income tax purposes;
(9) that meets other applicable tests, described below, regarding the nature of its income and assets and the amount of its distributions; and
(10) that has no earnings and profits from any non-REIT taxable year at the close of any taxable year.
The Code provides that conditions (1), (2), (3) and (4) above must be met during the entire taxable year and condition (5) above must be met during at least 335 days of a taxable year of 12 months, or during a proportionate part of a taxable year of less than 12 months. Conditions (5) and (6) do not apply until after the first taxable year for which an election is made to be taxed as a REIT. Condition (6) must be met during the last half of each taxable year. For purposes of determining share ownership under condition (6) above, a supplemental unemployment compensation benefits plan, a private foundation or a portion of a trust permanently set aside or used exclusively for charitable purposes generally is considered an individual. However, a trust that is a qualified trust under Code Section 401(a) generally is not considered an individual, and beneficiaries of a qualified trust are treated as holding shares of a REIT in proportion to their actuarial interests in the trust for purposes of condition (6) above.
We believe that we have been organized, have operated and have issued sufficient shares of beneficial interest with sufficient diversity of ownership to allow us to satisfy the above conditions. In addition, our declaration of trust contains restrictions regarding the transfer of shares of beneficial interest that are intended to assist us in continuing to satisfy the share ownership requirements described in conditions (5) and (6) above. If we fail to satisfy these share ownership requirements, we will fail to qualify as a REIT unless we qualify for certain relief provisions described below under “—Requirements for Qualification as a REIT-Relief from Violations; Reasonable Cause.”
To monitor our compliance with condition (6) above, we are generally required to maintain records regarding the actual ownership of our shares. To do so, we must demand written statements each year from the record holders of specified percentages of our shares pursuant to which the record holders must disclose the actual owners of the shares (i.e., the persons required to include in gross income the dividends paid by us). We must maintain a list of those persons failing or refusing to comply with this demand as part of our records. We could be subject to monetary penalties if we fail to comply with these record-keeping requirements. A shareholder that fails or refuses to comply with the demand is required by Treasury Regulations to submit a statement with its tax return disclosing the actual ownership of our stock and other information. If we comply with the record-keeping requirement and we do not know or, exercising reasonable diligence, would not have known of our failure to meet condition (6) above, then we will be treated as having met condition (6) above.
To qualify as a REIT, we cannot have at the end of any taxable year any undistributed earnings and profits that are attributable to a non-REIT taxable year. We elected to be taxed as a REIT beginning with our first taxable year in 1960 and we have not succeeded to any earnings and profits of a regular corporation. Therefore, we do not believe we have had any undistributed non-REIT earnings and profits.
Relief from Violations; Reasonable Cause
The Code provides relief from violations of the REIT gross income requirements, as described below under “—Requirements for Qualification as a REIT—Gross Income Tests,” in cases where a violation is due to reasonable cause and not to willful neglect, and other requirements are met, including the payment of a penalty tax that is based upon the magnitude of the violation. In addition, certain provisions of the Code extend similar relief in the case of certain violations of the REIT asset requirements (see “—Requirements for Qualification as a REIT—Asset Tests” below) and other REIT requirements, again provided that the violation is due to reasonable cause and not willful neglect, and other conditions are met, including the payment of a penalty tax. If we did not have reasonable cause for a failure, we would fail to qualify as a REIT. Whether we would have reasonable cause for any such failure cannot be known with certainty, because the determination of whether reasonable cause exists depends on the facts and circumstances at the time and we cannot provide any assurance that we in fact would have reasonable cause for a particular failure or that the IRS would not successfully challenge our view that a failure was due to reasonable cause. Moreover, we may be unable to actually rectify a failure and restore asset test compliance within the required timeframe due to the inability to transfer or otherwise dispose of assets, including as a result of restrictions on transfer imposed by our lenders or undertakings with our co-investors and/or the inability to acquire additional qualifying assets due to transaction risks, access to additional capital or other considerations. If we fail to satisfy any of the various REIT requirements, there can be no assurance that these relief provisions would be available to enable us to maintain our qualification as a REIT, and, if such relief provisions are available, the amount of any resultant penalty tax could be substantial.
Effect of Subsidiary Entities
Ownership of Partnership Interests. In the case of a REIT that is a partner in an entity that is treated as a partnership for U.S. federal income tax purposes, Treasury Regulations provide that the REIT is deemed to own its proportionate share of the partnership’s assets, and to earn its proportionate share of the partnership’s income, for purposes of the asset and gross income tests applicable to REITs, as described below. A REIT’s proportionate share of a partnership’s assets and income is based on the REIT’s pro rata share of the capital interests in the partnership. The Company’s capital interest in a partnership is calculated based on either the Company’s percentage ownership of the capital of the partnership or based on the allocations provided in the applicable partnership or limited liability company operating agreement, using the more conservative calculation. However, solely for purposes of the 10% value test, described below, the determination of a REIT’s interest in the partnership’s assets is based on the REIT’s proportionate interest in the equity and certain debt securities issued by the partnership. In addition, the assets and gross income of the partnership are deemed to retain the same character in the hands of the REIT. Thus, our proportionate share of the assets and items of income of any of our subsidiary partnerships, which include the assets, liabilities, and items of income of any partnership in which our subsidiary partnership holds an interest, are treated as our assets and items of income for purposes of applying the REIT requirements.
Any investment in partnerships involves special tax considerations, including the possibility of a challenge by the IRS of the status of any subsidiary partnership as a partnership, as opposed to an association taxable as a corporation, for U.S. federal income tax purposes. If any of these entities were treated as an association for U.S. federal income tax purposes, it would be taxable as a corporation and therefore could be subject to an entity-level tax on its income. In such a situation, the character of our assets and items of gross income would change and could preclude us from satisfying the REIT asset tests or the gross income tests as discussed in “—Requirements for Qualification as a REIT—Asset Tests” and “—Requirements for Qualification as a REIT—Gross Income Tests,” and in turn could prevent us from qualifying as a REIT, unless we are eligible for relief from the violation pursuant to relief provisions. See “—Requirements for Qualification as a REIT—Relief from Violations; Reasonable Cause” above, and “—Requirements for Qualification as a REIT—Gross Income Tests,” “—Requirements for Qualification as a REIT—Asset Tests” and “—Requirements for Qualification as a REIT— Failure to Qualify as a REIT,” below, for discussion of the effect of failure to satisfy the REIT tests for a taxable year, and of the relief provisions. In addition, any change in the status of any subsidiary partnership for tax purposes might be treated as a taxable event, in which case we could have taxable income that is subject to the REIT distribution requirements without receiving any cash.
Under the Bipartisan Budget Act of 2015, liability is imposed on the partnership (rather than its partners) for adjustments to reported partnership taxable income resulting from audits or other tax proceedings. The liability can include an imputed underpayment of tax, calculated by using the highest marginal U.S. federal income tax rate, as well as interest and penalties on such imputed underpayment of tax. Using certain rules, partnerships may be able to transfer these liabilities to their partners. In
the event any adjustments are imposed by the IRS on the taxable income reported by any subsidiary partnerships, we intend to utilize certain rules to the extent possible to allow us to transfer any liability with respect to such adjustments to the partners of the subsidiary partnerships who should properly bear such liability. However, there is no assurance that we will qualify under those rules or that we will have the authority to use those rules under the operating agreements for certain of our subsidiary partnerships.
Ownership of Disregarded Subsidiaries. If a REIT owns a corporate subsidiary that is a “qualified REIT subsidiary,” or QRS, that subsidiary is generally disregarded for U.S. federal income tax purposes, and all assets, liabilities and items of income, deduction and credit of the subsidiary are treated as assets, liabilities and items of income, deduction and credit of the REIT itself, including for purposes of the gross income and asset tests applicable to REITs, as described below. A QRS is any corporation, other than a taxable REIT subsidiary, that is directly or indirectly wholly owned by a REIT. Other entities that are wholly owned by us, including single member limited liability companies that have not elected to be taxed as corporations for U.S. federal income tax purposes, are also generally disregarded as separate entities for U.S. federal income tax purposes, including for purposes of the REIT income and asset tests. Disregarded subsidiaries, along with any partnerships in which we hold an equity interest, are sometimes referred to herein as “pass-through subsidiaries.”
In the event that a disregarded subsidiary ceases to be wholly owned by us (for example, if any equity interest in the subsidiary is acquired by a person other than us or another disregarded subsidiary of ours) the subsidiary’s separate existence would no longer be disregarded for U.S. federal income tax purposes. Instead, the subsidiary would have multiple owners and would be treated as either a partnership or a taxable corporation. Such an event could, depending on the circumstances, adversely affect our ability to satisfy the various asset and gross income requirements applicable to REITs, including the requirement that REITs generally may not own, directly or indirectly, more than 10% of the securities of another corporation unless it is a taxable REIT subsidiary or a QRS. See “—Requirements for Qualification as a REIT—Gross Income Tests” and “—Requirements for Qualification as a REIT—Asset Tests.”
Ownership of Interests in Taxable REIT Subsidiaries. A taxable REIT subsidiary of ours is a corporation other than a REIT in which we directly or indirectly hold stock, and that has made a joint election with us to be treated as a taxable REIT subsidiary under Section 856(l) of the Code. A taxable REIT subsidiary also includes any corporation other than a REIT in which a taxable REIT subsidiary of ours owns, directly or indirectly, securities (other than certain “straight debt” securities), which represent more than 35% of the total voting power or value of the outstanding securities of such corporation. Other than some activities relating to lodging and health care facilities, a taxable REIT subsidiary may generally engage in any business, including the provision of customary or non-customary services to our tenants without causing us to receive impermissible tenant service income under the REIT gross income tests. A taxable REIT subsidiary is required to pay regular U.S. federal income tax, and state and local income tax where applicable, as a regular corporation. In addition, a taxable REIT subsidiary may be prevented from deducting interest on debt, including debt funded directly or indirectly by us, if certain tests are not satisfied. If dividends are paid to us by one or more of our taxable REIT subsidiaries, then a portion of the dividends we distribute to shareholders who are taxed at individual rates will generally be eligible for taxation at lower capital gains rates, rather than at ordinary income rates. See “—Taxation of U.S. Shareholders—Taxation of Taxable U.S. Shareholders-Qualified Dividend Income.”
Generally, a taxable REIT subsidiary can perform impermissible tenant services without causing us to receive impermissible tenant services income under the REIT income tests. However, several provisions applicable to the arrangements between us and our taxable REIT subsidiaries ensure that such taxable REIT subsidiaries will be subject to an appropriate level of U.S. federal income taxation. For example, taxable REIT subsidiaries are limited in their ability to deduct interest payments in excess of a certain amount, including interest payments made directly or indirectly to us, as described below in “—Interest Deduction Limitation Enacted by the TCJA” In addition, we will be obligated to pay a 100% penalty tax on some payments we receive or on certain expenses deducted by our taxable REIT subsidiaries, and on income earned by our taxable REIT subsidiaries for services provided to, or on behalf of, us, if the economic arrangements between us, our tenants and such taxable REIT subsidiaries are not comparable to similar arrangements among unrelated parties. Our taxable REIT subsidiaries, and any future taxable REIT subsidiaries acquired by us, may make interest and other payments to us and to third parties in connection with activities related to our properties. There can be no assurance that our taxable REIT subsidiaries will not be limited in their ability to deduct interest payments made to us. In addition, there can be no assurance that the IRS might not seek to impose the 100% excise tax on a portion of payments received by us from, or expenses deducted by, or service income imputed to, our taxable REIT subsidiaries.
We own subsidiaries that have elected to be treated as taxable REIT subsidiaries for U.S. federal income tax purposes. Each of our taxable REIT subsidiaries is taxable as a regular corporation and has elected, together with us, to be treated as our taxable REIT subsidiary or is treated as our taxable REIT subsidiary under the 35% subsidiary rule discussed above. We may elect, together with other corporations in which we may own directly or indirectly stock, for those corporations to be treated as our taxable REIT subsidiaries.
Gross Income Tests
To qualify as a REIT, we must satisfy two gross income tests that are applied on an annual basis. First, in each taxable year, at least 75% of our gross income (excluding gross income from prohibited transactions, certain hedging transactions, as described below, and certain foreign currency transactions) must be derived from investments relating to real property or mortgages on real property, including:
•“rents from real property”;
•dividends or other distributions on, and gain from the sale of, shares in other REITs;
•gain from the sale of real property or mortgages on real property, in either case, not held for sale to customers;
•interest income derived from mortgage loans secured by real property; and
•income attributable to temporary investments of new capital in stocks and debt instruments during the one-year period following our receipt of new capital that we raise through equity offerings or issuance of debt obligations with at least a five-year term.
Second, at least 95% of our gross income in each taxable year (excluding gross income from prohibited transactions, certain hedging transactions, as described below, and certain foreign currency transactions) must be derived from some combination of income that qualifies under the 75% gross income test described above, as well as (a) other dividends, (b) interest (including interest income from debt instruments issued by publicly offered REITs), and (c) gain from the sale or disposition of stock or securities (including gain from the sale or other disposition of debt instruments issued by publicly offered REITs), in either case, not held for sale to customers.
Beginning with the Company’s taxable year beginning on or after January 1, 2005, gross income from certain hedging transactions are excluded from gross income for purposes of the 95% gross income requirement. Similarly, gross income from certain hedging transactions is excluded from gross income for purposes of the 75% gross income test. Income from, and gain from the termination of, certain hedging transactions, where the property or indebtedness that was the subject of the prior hedging transaction was extinguished or disposed of, also will be excluded from gross income for purposes of either the 75% gross income test or the 95% gross income test. See “—Requirements for Qualification as a REIT—Gross Income Tests—Income from Hedging Transactions.”
Rents from Real Property. Rents we receive will qualify as “rents from real property” for the purpose of satisfying the gross income requirements for a REIT described above only if several conditions are met. These conditions relate to the identity of the tenant, the computation of the rent payable, and the nature of the property lease.
•First, the amount of rent must not be based in whole or in part on the income or profits of any person. However, an amount we receive or accrue generally will not be excluded from the term “rents from real property” solely by reason of being based on a fixed percentage or percentages of receipts or sales;
•Second, we, or an actual or constructive owner of 10% or more of our shares, must not actually or constructively own 10% or more of the interests in the tenant, or, if the tenant is a corporation, 10% or more of the voting power or value of all classes of stock of the tenant. Rents received from such tenant that is a taxable REIT subsidiary, however, will not be excluded from the definition of “rents from real property” as a result of this condition if either (i) at least 90% of the space at the property to which the rents relate is leased to third parties, and the rents paid by the taxable REIT subsidiary are comparable to rents paid by our other tenants for comparable space or (ii) the property is a qualified lodging facility or a qualified health care property and such property is operated on behalf of the taxable REIT subsidiary by a person who is an “eligible independent contractor” (as described below) and certain other requirements are met;
•Third, rent attributable to personal property, leased in connection with a lease of real property, must not be greater than 15% of the total rent received under the lease. If this requirement is not met, then the portion of rent attributable to personal property will not qualify as “rents from real property”; and
•Fourth, for rents to qualify as rents from real property for the purpose of satisfying the gross income tests, we generally must not operate or manage the property or furnish or render services to the tenants of such property, other than through an “independent contractor” who is adequately compensated and from whom we derive no revenue or through a taxable REIT subsidiary. To the extent that impermissible services are provided by an independent contractor, the
cost of the services generally must be borne by the independent contractor. We anticipate that any services we provide directly to tenants will be “usually or customarily rendered” in connection with the rental of space for occupancy only and not otherwise considered to be provided for the tenants’ convenience. We may provide a minimal amount of “non-customary” services to tenants of our properties, other than through an independent contractor or a taxable REIT subsidiary, but we intend that our income from these services will not exceed 1% of our total gross income from the property. If the impermissible tenant services income exceeds 1% of our total income from a property, then all of the income from that property will fail to qualify as rents from real property. If the total amount of impermissible tenant services income does not exceed 1% of our total income from the property, the services will not “taint” the other income from the property (that is, it will not cause the rent paid by tenants of that property to fail to qualify as rents from real property), but the impermissible tenant services income will not qualify as rents from real property. We will be deemed to have received income from the provision of impermissible services in an amount equal to at least 150% of our direct cost of providing the service.
We monitor (and intend to continue to monitor) the activities provided at, and the non-qualifying income arising from, our properties and believe that we have not provided services at levels that will cause us to fail to meet the income tests. We provide services and may provide access to third party service providers at some or all of our properties. Based upon our experience in the markets where the properties are located, we believe that all access to service providers and services provided to tenants by us (other than through a qualified independent contractor or a taxable REIT subsidiary) either are usually or customarily rendered in connection with the rental of real property and not otherwise considered rendered to the occupant, or, if considered impermissible services, will not result in an amount of impermissible tenant service income that will cause us to fail to meet the income test requirements. However, we cannot provide any assurance that the IRS will agree with these positions.
Income we receive that is attributable to the rental of parking spaces at the properties will constitute rents from real property for purposes of the REIT gross income tests if the services provided with respect to the parking facilities are performed by independent contractors from whom we derive no income, either directly or indirectly, or by a taxable REIT subsidiary. We believe that the income we receive that is attributable to parking facilities will meet these tests and, accordingly, will constitute rents from real property for purposes of the REIT gross income tests.
Interest Income. “Interest” generally will be non-qualifying income for purposes of the 75% or 95% gross income tests if it depends in whole or in part on the income or profits of any person. However, interest based on a fixed percentage or percentages of receipts or sales may still qualify under the gross income tests. We do not expect to derive significant amounts of interest that will not qualify under the 75% and 95% gross income tests.
Dividend Income. Our share of any dividends received from any taxable REIT subsidiaries will qualify for purposes of the 95% gross income test but not for purposes of the 75% gross income test. We do not anticipate that we will receive sufficient dividends from any taxable REIT subsidiaries to cause us to exceed the limit on non-qualifying income under the 75% gross income test. Dividends that we receive from other qualifying REITs will qualify for purposes of both REIT income tests.
Income from Hedging Transactions. From time to time we may enter into hedging transactions with respect to one or more of our assets or liabilities. Any such hedging transactions could take a variety of forms, including the use of derivative instruments such as interest rate swap or cap agreements, option agreements, and futures or forward contracts. Income of a REIT, including income from a pass-through subsidiary, arising from “clearly identified” hedging transactions that are entered into to manage the risk of interest rate or price changes with respect to borrowings, including gain from the disposition of such hedging transactions, to the extent the hedging transactions hedge indebtedness incurred, or to be incurred, by the REIT to acquire or carry real estate assets (each such hedge, a “Borrowings Hedge”), will not be treated as gross income for purposes of either the 95% gross income test or the 75% gross income test. Income of a REIT arising from hedging transactions that are entered into to manage the risk of currency fluctuations with respect to our investments (each such hedge, a “Currency Hedge”) will not be treated as gross income for purposes of either the 95% gross income test or the 75% gross income test provided that the transaction is “clearly identified.” This exclusion from the 95% and 75% gross income tests also will apply if we previously entered into a Borrowings Hedge or a Currency Hedge, a portion of the hedged indebtedness or property is disposed of, and in connection with such extinguishment or disposition we enter into a new “clearly identified” hedging transaction to offset the prior hedging position. In general, for a hedging transaction to be “clearly identified,” (1) it must be identified as a hedging transaction before the end of the day on which it is acquired, originated, or entered into; and (2) the items of risks being hedged must be identified “substantially contemporaneously” with entering into the hedging transaction (generally not more than 35 days after entering into the hedging transaction). To the extent that we hedge with other types of financial instruments or in other situations, the resultant income will be treated as income that does not qualify under the 95% or 75% gross income tests unless the hedge meets certain requirements and we elect to integrate it with a specified asset and to treat the integrated position as a synthetic debt instrument. We intend to structure any hedging transactions in a manner that does not jeopardize our qualification as a REIT but there can be no assurance we will be successful in this regard.
Income from Prohibited Transactions. Any gain that we realize on the sale of any property held as inventory or otherwise held primarily for sale to customers in the ordinary course of business, either directly or through subsidiary partnerships and limited liability companies, will be treated as income from a prohibited transaction that is subject to a 100% penalty tax. Under existing law, whether property is held as inventory or primarily for sale to customers in the ordinary course of a trade or business is a question of fact that depends on all the facts and circumstances surrounding the particular transaction. However, we will not be treated as a dealer in real property for purposes of the 100% tax with respect to a real estate asset that we sell if (i) we have held the property for at least two years for the production of rental income prior to the sale, (ii) capitalized expenditures on the property in the two years preceding the sale are less than 30% of the net selling price of the property, and (iii) we either (a) have seven or fewer sales of property (excluding certain property obtained through foreclosure) for the year of sale or (b) the aggregate adjusted basis of property sold during the year is 10% or less of the aggregate adjusted basis of all of our assets as of the beginning of the taxable year or (c) the fair market value of property sold during the year is 10% or less of the aggregate fair market value of all of our assets as of the beginning of the taxable year, or (d) the aggregate adjusted basis of property sold during the year is 20% or less of the aggregate adjusted basis of all of our assets as of the beginning of the taxable year and the aggregate adjusted basis of property sold during the 3-year period ending with the year of sale is 10% or less of the aggregate tax basis of all of our assets as of the beginning of each of the 3 taxable years ending with the year of sale; or (e) the fair market value of property sold during the year is 20% or less of the aggregate fair market value of all of our assets as of the beginning of the taxable year and the fair market value of property sold during the 3-year period ending with the year of sale is 10% or less of the aggregate fair market value of all of our assets as of the beginning of each of the 3 taxable years ending with the year of sale. If we rely on clauses (b), (c), (d), or (e) in the preceding sentence, substantially all of the marketing and development expenditures with respect to the property sold must be made through an independent contractor from whom we derive no income or, our taxable REIT subsidiary. The sale of more than one property to one buyer as part of one transaction constitutes one sale for purposes of this “safe harbor.” We intend to hold our properties for investment with a view to long-term appreciation, to engage in the business of acquiring, developing and owning our properties and to make occasional sales of the properties as are consistent with our investment objectives. However, the IRS may successfully contend that some or all of the sales made by us or subsidiary partnerships or limited liability companies are prohibited transactions. In that case, we would be required to pay the 100% penalty tax on our allocable share of the gains resulting from any such sales.
Income from Foreclosure Property. We generally will be subject to tax at the maximum corporate rate (currently 21%) on any net income from foreclosure property, including any gain from the disposition of the foreclosure property, other than income that constitutes qualifying income for purposes of the 75% gross income test. Foreclosure property is real property and any personal property incident to such real property (1) that we acquire as the result of having bid on the property at foreclosure, or having otherwise reduced the property to ownership or possession by agreement or process of law, after a default (or upon imminent default) on a lease of the property or a mortgage loan held by us and secured by the property, (2) for which we acquired the related loan or lease at a time when default was not imminent or anticipated, and (3) with respect to which we made a proper election to treat the property as foreclosure property. Any gain from the sale of property for which a foreclosure property election has been made and remains in place generally will not be subject to the 100% tax on gains from prohibited transactions described above, even if the property would otherwise constitute inventory or dealer property. To the extent that we receive any income from foreclosure property that does not qualify for purposes of the 75% gross income test, we intend to make an election to treat the related property as foreclosure property if the election is available (which may not be the case with respect to any acquired “distressed loans”).
Failure to Satisfy the Gross Income Tests. If we fail to satisfy one or both of the 75% or 95% gross income tests for any taxable year, we may nevertheless qualify as a REIT for that year if we are entitled to relief under the Code. These relief provisions will be generally available if (1) our failure to meet these tests was due to reasonable cause and not due to willful neglect and (2) following our identification of the failure to meet the 75% and/or 95% gross income tests for any taxable year, we file a schedule with the IRS setting forth a description of each item of our gross income that satisfies the gross income tests for purposes of the 75% or 95% gross income test for such taxable year in accordance with Treasury Regulations. It is not possible, however, to state whether in all circumstances we would be entitled to the benefit of these relief provisions. If these relief provisions are inapplicable to a particular set of circumstances, we will fail to qualify as a REIT. As discussed above, under “—Taxation of the Company as a REIT—General,” even if these relief provisions apply, a tax would be imposed based on the amount of non-qualifying income. We intend to take advantage of any and all relief provisions that are available to us to cure any violation of the income tests applicable to REITs.
Any redetermined rents, redetermined deductions, excess interest, or redetermined TRS service income we generate will be subject to a 100% penalty tax. In general, redetermined rents are rents from real property that are overstated as a result of services furnished by one of our taxable REIT subsidiaries to any of our tenants, redetermined deductions and excess interest represent amounts that are deducted by a taxable REIT subsidiary for amounts paid to us that are in excess of the amounts that would have been deducted based on arm’s-length negotiations, and redetermined TRS service income is gross income (less deductions allocable thereto) of a taxable REIT subsidiary attributable to services provided to, or on behalf of, us that is less than the amounts that would have been paid by us to the taxable REIT subsidiary if based on arm’s-length negotiations. Rents we receive will not constitute redetermined rents if they qualify for the safe harbor provisions contained in the Code. Safe
harbor provisions are provided where:
•amounts are excluded from the definition of impermissible tenant service income as a result of satisfying the 1% de minimis exception;
•a taxable REIT subsidiary renders a significant amount of similar services to unrelated parties and the charges for such services are substantially comparable;
•rents paid to us by tenants leasing at least 25% of the net leasable space of the REIT’s property who are not receiving services from the taxable REIT subsidiary are substantially comparable to the rents paid by the REIT’s tenants leasing comparable space who are receiving such services from the taxable REIT subsidiary and the charge for the service is separately stated; or
•the taxable REIT subsidiary’s gross income from the service is not less than 150% of the taxable REIT subsidiary’s direct cost of furnishing the service.
While we anticipate that any fees paid to a taxable REIT subsidiary for tenant services will reflect arm’s-length rates, a taxable REIT subsidiary may under certain circumstances provide tenant services which do not satisfy any of the safe-harbor provisions described above. Nevertheless, these determinations are inherently factual, and the IRS has broad discretion to assert that amounts paid between related parties should be reallocated to clearly reflect their respective incomes. If the IRS successfully made such an assertion, we would be required to pay a 100% penalty tax on the redetermined rent, redetermined deductions or excess interest, as applicable.
Asset Tests
At the close of each calendar quarter, we must satisfy the following tests relating to the nature and diversification of our assets. For purposes of the asset tests, a REIT is not treated as owning the stock of a qualified REIT subsidiary or an equity interest in any entity treated as a partnership otherwise disregarded for U.S. federal income tax purposes. Instead, a REIT is treated as owning its proportionate share of the assets held by such entity.
•At least 75% of the value of our total assets must be represented by some combination of “real estate assets,” cash, cash items, and U.S. government securities. For purposes of this test, real estate assets include interests in real property, such as land and buildings, leasehold interests in real property, stock of other corporations that qualify as REITs and debt instruments issued by publicly offered REITs, some types of mortgage-backed securities, mortgage loans, personal property leased in connection with real property to the extent that rents attributable to such personal property are treated as “rents from real property”, and stock or debt instruments held for less than one year purchased with an offering of our shares or long term debt. Assets that do not qualify for purposes of the 75% asset test are subject to the additional asset tests described below.
•Not more than 25% of our total assets may be represented by securities other than those described in the first bullet above.
•Except for securities described in the first bullet above and the last bullet below and securities in qualified REIT subsidiaries and taxable REIT subsidiaries, the value of any one issuer’s securities owned by us may not exceed 5% of the value of our total assets.
•Except for securities described in the first bullet above and the last bullet below and securities in qualified REIT subsidiaries and taxable REIT subsidiaries, we may not own more than 10% of any one issuer’s outstanding voting securities.
•Except for securities described in the first bullet above and the last bullet below and securities in qualified REIT subsidiaries and taxable REIT subsidiaries, and certain types of indebtedness that are not treated as securities for purposes of this test, as discussed below, we may not own more than 10% of the total value of the outstanding securities of any one issuer.
•Not more than 20% of the value of our total assets may be represented by the securities of one or more taxable REIT subsidiaries.
•Not more than 25% of our total assets may be represented by debt instruments issued by publicly offered REITs that are “nonqualified” debt instruments (e.g., not secured by real property or interests in real property).
The 10% value test does not apply to certain “straight debt” and other excluded securities, as described in the Code, including (1) loans to individuals or estates; (2) obligations to pay rent from real property; (3) rental agreements described in Section 467 of the Code; (4) any security issued by other REITs; (5) certain securities issued by a state, the District of Columbia, a foreign government, or a political subdivision of any of the foregoing, or the Commonwealth of Puerto Rico; and (6) any other arrangement as determined by the IRS. In addition, (1) a REIT’s interest as a partner in a partnership is not considered a security for purposes of the 10% value test; (2) any debt instrument issued by a partnership (other than straight debt or other excluded security) will not be considered a security issued by the partnership if at least 75% of the partnership’s gross income is derived from sources that would qualify for the 75% REIT gross income test; and (3) any debt instrument issued by a partnership (other than straight debt or other excluded security) will not be considered a security issued by a partnership to the extent of the REIT’s interest as a partner in the partnership.
For purposes of the 10% value test, debt will meet the “straight debt” safe harbor if (1) neither us, nor any of our controlled taxable REIT subsidiaries (i.e., taxable REIT subsidiaries more than 50% of the vote or value of the outstanding stock of which is directly or indirectly owned by us), own any securities not described in the preceding paragraph that have an aggregate value greater than one percent of the issuer’s outstanding securities, as calculated under the Code, (2) the debt is a written unconditional promise to pay on demand or on a specified date a sum certain in money, (3) the debt is not convertible, directly or indirectly, into stock, and (4) the interest rate and the interest payment dates of the debt are not contingent on the profits, the borrower’s discretion or similar factors. However, contingencies regarding time of payment and interest are permissible for purposes of qualifying as a straight debt security if either (1) such contingency does not have the effect of changing the effective yield of maturity, as determined under the Code, other than a change in the annual yield to maturity that does not exceed the greater of (i) 5% of the annual yield to maturity or (ii) 0.25%, or (2) neither the aggregate issue price nor the aggregate face amount of the issuer’s debt instruments held by the REIT exceeds $1,000,000 and not more than 12 months of unaccrued interest can be required to be prepaid thereunder. In addition, debt will not be disqualified from being treated as “straight debt” solely because the time or amount of payment is subject to a contingency upon a default or the exercise of a prepayment right by the issuer of the debt, provided that such contingency is consistent with customary commercial practice.
We own subsidiaries that have elected to be treated as taxable REIT subsidiaries for U.S. federal income tax purposes. Each of our taxable REIT subsidiaries is taxable as a non-REIT C corporation and has elected, together with us, to be treated as our taxable REIT subsidiary or is treated as a taxable REIT subsidiary under the 35% subsidiary rule discussed above. So long as each taxable REIT subsidiary qualifies as such, we will not be subject to the 5% asset test, 10% voting securities limitation or 10% value limitation with respect to our ownership interest in each taxable REIT subsidiary. We may acquire securities in other taxable REIT subsidiaries in the future. We believe that the aggregate value of our interests in our taxable REIT subsidiaries does not exceed, and believe that in the future it will not exceed, 20% of the aggregate value of our gross assets. To the extent that we own an interest in an issuer that does not qualify as a REIT, a qualified REIT subsidiary, or a taxable REIT subsidiary, we believe that our pro rata share of the value of the securities, including debt, of any such issuer does not exceed 5% of the total value of our assets. Moreover, with respect to each issuer in which we own an interest that does not qualify as a qualified REIT subsidiary or a taxable REIT subsidiary, we believe that our ownership of the securities of any such issuer complies with the 10% voting securities limitation and 10% value limitation.
No independent appraisals have been obtained to support these conclusions. In this regard, however, we cannot provide any assurance that the IRS might disagree with our determinations.
Failure to Satisfy the Asset Tests. The asset tests must be satisfied not only on the last day of the calendar quarter in which we, directly or through pass-through subsidiaries, acquire securities in the applicable issuer, but also on the last day of the calendar quarter in which we increase our ownership of securities of such issuer, including as a result of increasing our interest in pass-through subsidiaries. After initially meeting the asset tests at the close of any quarter, we will not lose our status as a REIT for failure to satisfy the asset tests at the end of a later quarter solely by reason of changes in the relative values of our assets (including a discrepancy caused solely by the change in the foreign currency exchange rate used to value a foreign asset). If failure to satisfy the asset tests results from an acquisition of securities or other property during a quarter, we can cure this failure by disposing of sufficient non-qualifying assets within 30 days after the close of that quarter. We intend to continue to maintain adequate records of the value of our assets to ensure compliance with the asset tests and to take any available action within 30 days after the close of any quarter as may be required to cure any noncompliance with the asset tests. Although we plan to take steps to ensure that we satisfy such tests for any quarter with respect to which testing is to occur, there can be no assurance that such steps will always be successful. If we fail to timely cure any noncompliance with the asset tests, we would cease to qualify as a REIT, unless we satisfy certain relief provisions.
The failure to satisfy the 5% asset test, or the 10% vote or value asset tests can be remedied even after the 30-day cure period under certain circumstances. Specifically, if we fail these asset tests at the end of any quarter and such failure is not cured within 30 days thereafter, we may dispose of sufficient assets (generally within six months after the last day of the quarter in which our identification of the failure to satisfy these asset tests occurred) to cure such a violation that does not exceed the
lesser of 1% of our assets at the end of the relevant quarter or $10,000,000. If we fail any of the other asset tests or our failure of the 5% and 10% asset tests is in excess of the de minimis amount described above, as long as such failure was due to reasonable cause and not willful neglect, we are permitted to avoid disqualification as a REIT, after the 30-day cure period, by taking steps including the disposing of sufficient assets to meet the asset test (generally within six months after the last day of the quarter in which our identification of the failure to satisfy the REIT asset test occurred), paying a tax equal to the greater of $50,000 or the highest corporate income tax rate of the net income generated by the non-qualifying assets during the period in which we failed to satisfy the asset test, and filing in accordance with applicable Treasury Regulations a schedule with the IRS that describes the assets that caused us to fail to satisfy the asset test(s). We intend to take advantage of any and all relief provisions that are available to us to cure any violation of the asset tests applicable to REITs. In certain circumstances, utilization of such provisions could result in us being required to pay an excise or penalty tax, which could be significant in amount.
Annual Distribution Requirements
To qualify as a REIT, we are required to distribute dividends, other than capital gain dividends, to our shareholders each year in an amount at least equal to:
•the sum of: (1) 90% of our “REIT taxable income,” computed without regard to the dividends paid deduction and our net capital gain; and (2) 90% of our after tax net income, if any, from foreclosure property; minus
•the excess of the sum of specified items of non-cash income over 5% of our REIT taxable income, computed without regard to our net capital gain and the deduction for dividends paid.
For purposes of this test, non-cash income means income attributable to leveled stepped rents, original issue discount included in our taxable income without the receipt of a corresponding payment, cancellation of indebtedness or income attributable to a like-kind exchange that is later determined to be taxable.
We generally must make dividend distributions in the taxable year to which they relate. Dividend distributions may be made in the following year in two circumstances. First, if we declare a dividend in October, November, or December of any year with a record date in one of these months and pay the dividend on or before January 31 of the following year. Such distributions are treated as both paid by us and received by each shareholder on December 31 of the year in which they are declared. Second, distributions may be made in the following year if they are declared before we timely file our tax return for the year and if made with or before the first regular dividend payment after such declaration. These distributions are taxable to our shareholders in the year in which paid, even though the distributions relate to our prior taxable year for purposes of the 90% distribution requirement.
To the extent that we do not distribute all of our net capital gain or distribute at least 90%, but less than 100%, of our “REIT taxable income,” as adjusted, we will be required to pay tax on that amount at regular corporate tax rates. We intend to make timely distributions sufficient to satisfy these annual distribution requirements. In certain circumstances we may elect to retain, rather than distribute, our net long-term capital gains and pay tax on such gains. In this case, we could elect for our shareholders to include their proportionate share of such undistributed long-term capital gains in income, and to receive a corresponding credit for their share of the tax that we paid. Our shareholders would then increase their adjusted basis of their stock by the difference between (1) the amounts of capital gain dividends that we designated and that they included in their taxable income, minus (2) the tax that we paid on their behalf with respect to that income.
To the extent that in the future we may have available net operating losses carried forward from prior tax years, such losses may reduce the amount of distributions that we must make in order to comply with the REIT distribution requirements. Our deduction for any net operating loss carryforwards arising from losses we sustain in taxable years beginning after December 31, 2017, is limited to 80% of our REIT taxable income (determined without regard to the deduction for dividends paid), and any unused portion of such losses may be carried forward indefinitely.
If we fail to distribute during each calendar year at least the sum of (a) 85% of our REIT ordinary income for such year, (b) 95% of our REIT capital gain net income for such year, and (c) any undistributed taxable income from prior periods, we would be subject to a non-deductible 4% excise tax on the excess of such required distribution over the sum of (x) the amounts actually distributed, and (y) the amounts of income we retained and on which we paid corporate income tax.
We expect that our REIT taxable income (determined before our deduction for dividends paid) will be less than our cash flow because of depreciation and other non-cash charges included in computing REIT taxable income. Accordingly, we anticipate that we will generally have sufficient cash or liquid assets to enable us to satisfy the distribution requirements described above. However, from time to time, we may not have sufficient cash or other liquid assets to meet these distribution requirements due
to timing differences between the actual receipt of income and actual payment of deductible expenses, and the inclusion of income and deduction of expenses in arriving at our taxable income.
The Internal Revenue Code limits the deductibility of net interest expense paid or accrued on debt properly allocable to a trade or business to 30% of “adjusted taxable income,” subject to certain exceptions. Any deduction in excess of the limitation is carried forward and may be used in a subsequent year, subject to the 30% limitation. Adjusted taxable income is determined without regard to certain deductions, including those for net interest expense, net operating loss carryforwards and, for taxable years beginning before January 1, 2022, depreciation, amortization and depletion. If we or our subsidiaries, as applicable, are eligible to make a timely election (which is irrevocable), the 30% limitation does not apply to a trade or business involving real property development, redevelopment, construction, reconstruction, rental, operation, acquisition, conversion, disposition, management, leasing or brokerage, within the meaning of Section 469(c)(7)(C) of the Code. If this election is made, depreciable real property (including certain improvements) held by the relevant trade or business must be depreciated under the alternative depreciation system under the Code, which is generally less favorable than the generally applicable system of depreciation under the Code. If we do not make the election or if the election is determined not to be available with respect to all or certain of our business activities, this interest deduction limitation could result in us having more REIT taxable income and thus increase the amount of distributions we must make to comply with the REIT requirements and avoid incurring corporate level tax. Similarly, the limitation could cause our TRSs to have greater taxable income and thus potentially greater corporate tax liability.
Furthermore, under amendments to Section 451 of the Code made by the TCJA, subject to certain exceptions, we must accrue income for U.S. federal income tax purposes no later than when such income is taken into account as revenue in our financial statements, which could create additional differences between REIT taxable income and the receipt of cash attributable to such income. In addition, Section 162(m) of the Code places a per-employee limit of $1 million on the amount of compensation that a publicly held corporation may deduct in any one year with respect to its chief executive officer and certain other highly compensated executive officers. Recent changes to Section 162(m) made by the TCJA eliminated an exception that formerly permitted certain performance-based compensation to be deducted even if in excess of $1 million, which may have the effect of increasing our REIT taxable income. If these timing differences occur, we may need to arrange for short-term, or possibly long-term, borrowings or need to pay dividends in the form of taxable stock dividends in order to meet the distribution requirements.
We may be able to rectify a failure to meet the distribution requirement for a year by paying “deficiency dividends” to our shareholders in a later year, which may be included in our deduction for dividends paid for the earlier year. Thus, we may be able to avoid being taxed on amounts distributed as deficiency dividends. However, we will be required to pay interest to the IRS based upon the amount of any deduction claimed for deficiency dividends.
Record-Keeping Requirements
We are required to comply with applicable record-keeping requirements. Failure to comply could result in monetary fines.
Failure to Qualify as a REIT
If we fail to satisfy one or more requirements for REIT qualification other than gross income and asset tests that have the specific savings clauses, we can avoid termination of our REIT qualification by paying a penalty of $50,000 for each such failure, provided that our noncompliance was due to reasonable cause and not willful neglect.
If we fail to qualify for taxation as a REIT in any taxable year and the relief provisions do not apply, we will be subject to tax on our taxable income at regular corporate rates. If we fail to qualify for taxation as a REIT, we will not be required to make any distributions to shareholders, and any distributions that are made to shareholders will not be deductible by us. As a result, our failure to qualify for taxation as a REIT would significantly reduce the cash available for distributions by us to our shareholders. In addition, if we fail to qualify for taxation as a REIT, all distributions to shareholders, to the extent of our current and accumulated earnings and profits, will be taxable as regular corporate dividends. For taxable years beginning after December 31, 2017, and before January 1, 2026, generally U.S. shareholders that are individuals, trusts or estates may deduct 20% of the aggregate amount of ordinary dividends distributed by us, subject to certain limitations. Alternatively, such dividends paid to U.S. shareholders that are individuals, trusts and estates may be taxable at the preferential income tax rates (i.e., the 20% maximum U.S. federal rate) for qualified dividends. In addition, subject to the limitations of the Code, corporate distributees may be eligible for the dividends-received deduction,
Unless entitled to relief under specific statutory provisions, we also will be disqualified from taxation as a REIT for the four taxable years following the year during which qualification was lost. In addition, if we merge with another REIT and we are the “successor” to the other REIT, the other REIT’s disqualification from taxation as a REIT would prevent us from being taxed as a REIT for the four taxable years following the year during which the other REIT’s qualification was lost. There can be no assurance that we would be entitled to any statutory relief. We intend to take advantage of any and all relief provisions that are available to us to cure any violation of the requirements applicable to REITs.
Taxation of U.S. Shareholders
Taxation of Taxable U.S. Shareholders
This section summarizes the taxation of U.S. shareholders that are not tax-exempt organizations. For these purposes, the term “U.S. shareholder” is a beneficial owner of our shares that is, for U.S. federal income tax purposes:
•a citizen or resident of the United States;
•a corporation (including an entity treated as a corporation for U.S. federal income tax purposes) created or organized in or under the laws of the United States or of a political subdivision thereof (including the District of Columbia);
•an estate the income of which is subject to U.S. federal income taxation regardless of its source; or
•any trust if (1) a U.S. court is able to exercise primary supervision over the administration of such trust and one or more U.S. persons have the authority to control all substantial decisions of the trust, or (2) it has a valid election in place to be treated as a U.S. person.
If an entity or arrangement treated as a partnership for U.S. federal income tax purposes holds our shares, the U.S. federal income tax treatment of a partner generally will depend upon the status of the partner and the activities of the partnership. A partner of a partnership holding our shares should consult its own tax advisor regarding the U.S. federal income tax consequences to the partner of the acquisition, ownership and disposition of our shares by the partnership.
Distributions Generally. So long as we qualify as a REIT, distributions out of our current or accumulated earnings and profits that are not designated as capital gains dividends or “qualified dividend income” will be taxable to our taxable U.S. shareholders as ordinary income and will not be eligible for the dividends-received deduction in the case of U.S. shareholders that are corporations. However, for tax years prior to 2026, generally U.S. shareholders that are individuals, trusts or estates may deduct 20% of the aggregate amount of ordinary dividends distributed by us, subject to certain limitations. For purposes of determining whether distributions to holders of shares are out of current or accumulated earnings and profits, our earnings and profits will be allocated first to any outstanding preferred shares and then to our outstanding common shares. Dividends received from REITs are generally not eligible to be taxed at the preferential qualified dividend income rates currently available to individual U.S. shareholders who receive dividends from taxable subchapter “C” corporations.
Capital Gain Dividends. We may elect to designate distributions of our net capital gain as “capital gain dividends.” Distributions that we properly designate as “capital gain dividends” will be taxable to our taxable U.S. shareholders as long-term capital gains without regard to the period for which the U.S. shareholder that receives such distribution has held its shares. Designations made by us will only be effective to the extent that they comply with Revenue Ruling 89-81, which requires that distributions made to different classes of shares be composed proportionately of dividends of a particular type. If we designate any portion of a dividend as a capital gain dividend, a U.S. shareholder will receive an IRS Form 1099-DIV indicating the amount that will be taxable to the shareholder as capital gain. Corporate shareholders, however, may be required to treat up to 20% of some capital gain dividends as ordinary income. Recipients of capital gain dividends from us that are taxed at corporate income tax rates will be taxed at the normal corporate income tax rates on these dividends.
We may elect to retain and pay taxes on some or all of our net long-term capital gains, in which case U.S. shareholders will be treated as having received, solely for U.S. federal income tax purposes, our undistributed capital gains as well as a corresponding credit or refund, as the case may be, for taxes that we paid on such undistributed capital gains. A U.S. shareholder will increase the basis in its shares by the difference between the amount of capital gain included in its income and the amount of tax it is deemed to have paid. A U.S. shareholder that is a corporation will appropriately adjust its earnings and profits for the retained capital gain in accordance with Treasury Regulations to be prescribed by the IRS. Our earnings and profits will be adjusted appropriately.
We will classify portions of any designated capital gain dividend or undistributed capital gain as either:
•a long-term capital gain distribution, which would be taxable to non-corporate U.S. shareholders at a maximum rate of 20% (excluding the 3.8% tax on “net investment income”), and taxable to U.S. shareholders that are corporations at a maximum rate of 21%; or
•an “unrecaptured Section 1250 gain” distribution, which would be taxable to non-corporate U.S. shareholders at a maximum rate of 25%, to the extent of previously claimed depreciation deductions.
Distributions from us in excess of our current and accumulated earnings and profits will not be taxable to a U.S. shareholder to the extent that they do not exceed the adjusted basis of the U.S. shareholder’s shares in respect of which the distributions were made. Rather, the distribution will reduce the adjusted basis of these shares. To the extent that such distributions exceed the adjusted basis of a U.S. shareholder’s shares of our shares, the U.S. shareholder generally must include such distributions in income as long-term capital gain, or short-term capital gain if the shares have been held for one year or less. In addition, any dividend that we declare in October, November or December of any year and that is payable to a shareholder of record on a specified date in any such month will be treated as both paid by us and received by the shareholder on December 31 of such year, provided that we actually pay the dividend before the end of January of the following calendar year.
To the extent that we have available net operating losses and capital losses carried forward from prior tax years, such losses may reduce the amount of distributions that we must make in order to comply with the REIT distribution requirements. See “—Taxation of the Company as a REIT” and “—Requirements for Qualification as a REIT—Annual Distribution Requirements.” Such losses, however, are not passed through to U.S. shareholders and do not offset income of U.S. shareholders from other sources, nor would such losses affect the character of any distributions that we make, which are generally subject to tax in the hands of U.S. shareholders to the extent that we have current or accumulated earnings and profits.
The maximum amount of dividends that we may designate as capital gain and as “qualified dividend income” (discussed below) with respect to any taxable year (effective for distributions in tax years beginning after December 31, 2014) may not exceed the dividends actually paid by us with respect to such year, including dividends paid by us in the succeeding tax year that relate back to the prior tax year for purposes of determining our dividends paid deduction.
Qualified Dividend Income. We may elect to designate a portion of our distributions paid to shareholders as “qualified dividend income.” A portion of a distribution that is properly designated as qualified dividend income is taxable to non-corporate U.S. shareholders as capital gain, provided that the shareholder has held the shares with respect to which the distribution is made for more than 60 days during the 121-day period beginning on the date that is 60 days before the date on which such shares become ex-dividend with respect to the relevant distribution. The maximum amount of our distributions eligible to be designated as qualified dividend income for a taxable year is equal to the sum of:
•the qualified dividend income received by us during such taxable year from non-REIT corporations (including our taxable REIT subsidiaries);
•the excess of any “undistributed” REIT taxable income recognized during the immediately preceding year over the U.S. federal income tax paid by us with respect to such undistributed REIT taxable income; and
•the excess of (i) any income recognized during the immediately preceding year attributable to the sale of a built-in-gain asset that was acquired in a carry-over basis transaction from a “C” corporation with respect to which the Company is required to pay U.S. federal income tax, over (ii) the U.S. federal income tax paid by us with respect to such built-in gain.
Generally, dividends that we receive will be treated as qualified dividend income for purposes of the first bullet above if (A) the dividends are received from (i) a U.S. corporation (other than a REIT or a RIC), (ii) any of our taxable REIT subsidiaries, or (iii) a “qualifying foreign corporation,” and (B) specified holding period requirements and other requirements are met. A foreign corporation (other than a “foreign personal holding company,” a “foreign investment company,” or “passive foreign investment company”) will be a qualifying foreign corporation if it is incorporated in a possession of the United States, the corporation is eligible for benefits of an income tax treaty with the United States that the Secretary of Treasury determines is satisfactory, or the stock of the foreign corporation on which the dividend is paid is readily tradable on an established securities market in the United States. We generally expect that an insignificant portion, if any, of our distributions from us will consist of qualified dividend income. If we designate any portion of a dividend as qualified dividend income, a U.S. shareholder will receive an IRS Form 1099-DIV indicating the amount that will be taxable to the shareholder as qualified dividend income.
Passive Activity Losses and Investment Interest Limitations. Distributions we make and gain arising from the sale or exchange by a U.S. shareholder of our shares will not be treated as passive activity income. As a result, U.S. shareholders generally will not be able to apply any “passive losses” against this income or gain. Distributions we make, to the extent they do not constitute a return of capital, generally will be treated as investment income for purposes of computing the investment interest limitation. A U.S. shareholder may elect, depending on its particular situation, to treat capital gain dividends, capital gains from the disposition of shares and income designated as qualified dividend income as investment income for purposes of the investment interest limitation, in which case the applicable capital gains will be taxed at ordinary income rates. We will notify shareholders regarding the portions of our distributions for each year that constitute ordinary income, return of capital and qualified dividend income.
Distributions to Holders of Depositary Shares. Owners of depositary shares will be treated for U.S. federal income tax purposes as if they were owners of the underlying preferred shares represented by such depositary shares. Accordingly, such owners will be entitled to take into account, for U.S. federal income tax purposes, income and deductions to which they would be entitled if they were direct holders of underlying preferred shares. In addition, (i) no gain or loss will be recognized for U.S. federal income tax purposes upon the withdrawal of certificates evidencing the underlying preferred shares in exchange for depositary receipts, (ii) the tax basis of each share of the underlying preferred shares to an exchanging owner of depositary shares will, upon such exchange, be the same as the aggregate tax basis of the depositary shares exchanged therefor, and (iii) the holding period for the underlying preferred shares in the hands of an exchanging owner of depositary shares will include the period during which such person owned such depositary shares.
Dispositions of Our Shares. If a U.S. shareholder sells, redeems or otherwise disposes of its shares in a taxable transaction, it will recognize gain or loss for U.S. federal income tax purposes in an amount equal to the difference between the amount of cash and the fair market value of any property received on the sale or other disposition and the holder’s adjusted basis in the shares for tax purposes. In general, a U.S. shareholder’s adjusted basis will equal the U.S. shareholder’s acquisition cost, increased by the excess for net capital gains deemed distributed to the U.S. shareholder (discussed above) less tax deemed paid on it and reduced by returns on capital.
In general, capital gains recognized by individuals and other non-corporate U.S. shareholders upon the sale or disposition of our shares will be subject to a maximum U.S. federal income tax rate of 20% (excluding the 3.8% tax on “net investment income”), if our shares are held for more than one year, and will be taxed at ordinary income rates of up to 37% if the stock is held for one year or less. Gains recognized by U.S. shareholders that are corporations are subject to U.S. federal income tax at a maximum rate of 21%, whether or not such gains are classified as long-term capital gains. The IRS has the authority to prescribe, but has not yet prescribed, Treasury Regulations that would apply a capital gain tax rate of 25% (which is higher than the long-term capital gain tax rates for non-corporate U.S. shareholders) to a portion of capital gain realized by a non-corporate U.S. shareholder on the sale of the Company’s shares that would correspond to the REIT’s “unrecaptured Section 1250 gain.” U.S. shareholders should consult with their own tax advisors with respect to their capital gain tax liability.
Capital losses recognized by a U.S. shareholder upon the disposition of our shares that were held for more than one year at the time of disposition will be considered long-term capital losses, and are generally available only to offset capital gain income of the shareholder but not ordinary income (except in the case of individuals, who may offset up to $3,000 of ordinary income each year). In addition, any loss upon a sale or exchange of our shares by a U.S. shareholder who has held the shares for six months or less, after applying holding period rules, will be treated as a long-term capital loss to the extent of distributions that we make that are required to be treated by the U.S. shareholder as long-term capital gain.
If a shareholder recognizes a loss upon a subsequent disposition of our shares in an amount that exceeds a prescribed threshold, it is possible that the provisions of Treasury Regulations involving “reportable transactions” could apply, with a resulting requirement to separately disclose the loss-generating transaction to the IRS. These regulations, though directed towards “tax shelters,” are broadly written, and apply to transactions that would not typically be considered tax shelters. The Code imposes significant penalties for failure to comply with these requirements. U.S. shareholders should consult their tax advisors concerning any possible disclosure obligation with respect to the receipt or disposition of our shares, or transactions that we might undertake directly or indirectly.
Redemption of Preferred Shares and Depositary Shares. Whenever we redeem any preferred shares held by the depositary, the depositary will redeem as of the same redemption date the number of depositary shares representing the preferred shares so redeemed. The treatment accorded to any redemption by us for cash (as distinguished from a sale, exchange or other disposition) of our preferred shares to a holder of such preferred shares can only be determined on the basis of the particular facts as to each holder at the time of redemption. In general, a holder of our preferred shares will recognize capital gain or loss measured by the difference between the amount received by the holder of such shares upon the redemption and such holder’s adjusted tax basis in the preferred shares redeemed (provided the preferred shares are held as a capital asset) if such redemption (i) is ‘‘not essentially equivalent to a dividend’’ with respect to the holder of the preferred shares under Section 302(b)(1) of the Code, (ii) is a “substantially disproportionate” redemption with respect to the shareholder under Section 302(b)(2) of the Code, or (iii) results in a ‘‘complete termination’’ of the holder’s interest in all classes of our shares under Section 302(b)(3) of the Code. In applying these tests, there must be taken into account not only any series or class of the preferred shares being redeemed, but also such holder’s ownership of other classes of our shares and any options (including stock purchase rights) to acquire any of the foregoing. The holder of our preferred shares also must take into account any such securities (including options) which are considered to be owned by such holder by reason of the constructive ownership rules set forth in Sections 318 and 302(c) of the Code.
If the holder of preferred shares owns (actually or constructively) none of our voting shares, or owns an insubstantial amount of our voting shares, based upon current law, it is probable that the redemption of preferred shares from such a holder would be
considered to be ‘‘not essentially equivalent to a dividend.’’ However, whether a distribution is ‘‘not essentially equivalent to a dividend’’ depends on all of the facts and circumstances, and a holder of our preferred shares intending to rely on any of these tests at the time of redemption should consult its tax advisor to determine their application to its particular situation.
Satisfaction of the “substantially disproportionate” and “complete termination” exceptions is dependent upon compliance with the respective objective tests set forth in Section 302(b)(2) and Section 302(b)(3) of the Code. A distribution to a holder of preferred shares will be “substantially disproportionate” if the percentage of our outstanding voting shares actually and constructively owned by the shareholder immediately following the redemption of preferred shares (treating preferred shares redeemed as not outstanding) is less than 80% of the percentage of our outstanding voting shares actually and constructively owned by the shareholder immediately before the redemption, and immediately following the redemption the shareholder actually and constructively owns less than 50% of the total combined voting power of the Company. Because the Company’s preferred shares are nonvoting shares, a shareholder would have to reduce such holder’s holdings (if any) in our classes of voting shares to satisfy this test.
If the redemption does not meet any of the tests under Section 302 of the Code, then the redemption proceeds received from our preferred shares will be treated as a distribution on our shares as described under ‘‘-Taxation of U.S. Shareholders-Taxation of Taxable U.S. Shareholders-Distributions Generally,’’ and ‘‘-Taxation of Non-U.S. Shareholders-Distributions Generally.’’ If the redemption of a holder’s preferred shares is taxed as a dividend, the adjusted basis of such holder’s redeemed preferred shares will be transferred to any other shares held by the holder. If the holder owns no other shares, under certain circumstances, such basis may be transferred to a related person, or it may be lost entirely.
With respect to a redemption of our preferred shares that is treated as a distribution with respect to our shares, which is not otherwise taxable as a dividend, the IRS has proposed Treasury Regulations that would require any basis reduction associated with such a redemption to be applied on a share-by-share basis which could result in taxable gain with respect to some shares, even though the holder’s aggregate basis for the shares would be sufficient to absorb the entire amount of the redemption distribution (in excess of any amount of such distribution treated as a dividend). Additionally, these proposed Treasury Regulations would not permit the transfer of basis in the redeemed shares of the preferred shares to the remaining shares held (directly or indirectly) by the redeemed holder. Instead, the unrecovered basis in our preferred shares would be treated as a deferred loss to be recognized when certain conditions are satisfied. These proposed Treasury Regulations would be effective for transactions that occur after the date the regulations are published as final Treasury Regulations. There can, however, be no assurance as to whether, when, and in what particular form such proposed Treasury Regulations will ultimately be finalized.
Net Investment Income Tax. In certain circumstances, certain U.S. shareholders that are individuals, estates or trusts are subject to a 3.8% tax on “net investment income,” which includes, among other things, dividends on and gains from the sale or other disposition of REIT shares. U.S. shareholders should consult their own tax advisors regarding this legislation.
Expansion of Medicare Tax. The Health Care and Reconciliation Act of 2010 requires that, in certain circumstances, certain U.S. holders that are individuals, estates, and trusts pay a 3.8% tax on “net investment income,” which includes, among other things, dividends on and gains from the sale or other disposition of REIT shares. The temporary 20% deduction allowed by Section 199A of the Code, as added by the TCJA, with respect to ordinary REIT dividends received by non-corporate taxpayers is allowed only for purposes of Chapter 1 of the Code and thus is apparently not allowed as a deduction allocable to such dividends for purposes of determining the amount of net investment income subject to the 3.8% Medicare tax, which is imposed under Chapter 2A of the Code. Prospective investors should consult their own tax advisors regarding this legislation.
Taxation of Tax Exempt Shareholders
U.S. tax-exempt entities, including qualified employee pension and profit sharing trusts and individual retirement accounts, generally are exempt from U.S. federal income taxation. Such entities, however, may be subject to taxation on their unrelated business taxable income, or UBTI. While some investments in real estate may generate UBTI, the IRS has ruled that dividend distributions from a REIT to a tax-exempt entity generally do not constitute UBTI. Based on that ruling, and provided that (1) a tax-exempt shareholder has not held our shares as “debt financed property” within the meaning of the Code (i.e., where the acquisition or holding of our shares is financed through a borrowing by the U.S. tax-exempt shareholder), (2) our shares are not otherwise used in an unrelated trade or business of a U.S. tax-exempt shareholder, and (3) we do not hold an asset that gives rise to “excess inclusion income,” distributions that we make and income from the sale of our shares generally should not give rise to UBTI to a U.S. tax-exempt shareholder.
Tax-exempt shareholders that are social clubs, voluntary employee benefit associations, supplemental unemployment benefit trusts, or qualified group legal services plans exempt from U.S. federal income taxation under Sections 501(c)(7), (c)(9), (c)(17) or (c)(20) of the Code, respectively, or single parent title-holding corporations exempt under Section 501(c)(2) and whose income is payable to any of the aforementioned tax-exempt organizations, are subject to different UBTI rules, which generally
require such shareholders to characterize distributions from us as UBTI unless the organization is able to properly claim a deduction for amounts set aside or placed in reserve for certain purposes so as to offset the income generated by its investment in our shares. These shareholders should consult with their tax advisors concerning these set aside and reserve requirements.
In certain circumstances, a pension trust (1) that is described in Section 401(a) of the Code, (2) is tax exempt under Section 501(a) of the Code, and (3) that owns more than 10% of the value of our shares could be required to treat a percentage of the dividends as UBTI, if we are a “pension-held REIT.” We will not be a pension-held REIT unless:
•either (1) one pension trust owns more than 25% of the value of our stock, or (2) one or more pension trusts, each individually holding more than 10% of the value of our shares, collectively own more than 50% of the value of our shares; and
•we would not have qualified as a REIT but for the fact that Section 856(h)(3) of the Code provides that shares owned by such trusts shall be treated, for purposes of the requirement that not more than 50% of the value of the outstanding shares of a REIT is owned, directly or indirectly, by five or fewer “individuals” (as defined in the Code to include certain entities), as owned by the beneficiaries of such trusts.
The percentage of any REIT dividend from a “pension-held REIT” that is treated as UBTI is equal to the ratio of the UBTI earned by the REIT, treating the REIT as if it were a pension trust and therefore subject to tax on UBTI, to the total gross income of the REIT. An exception applies where the percentage is less than 5% for any year, in which case none of the dividends would be treated as UBTI. The provisions requiring pension trusts to treat a portion of REIT distributions as UBTI will not apply if the REIT is able to satisfy the “not closely held requirement” without relying upon the “look-through” exception with respect to pension trusts. As a result of certain limitations on the transfer and ownership of our common and preferred shares contained in our declaration of trust, we do not expect to be classified as a “pension-held REIT,” and accordingly, the tax treatment described above with respect to pension-held REITs should be inapplicable to our tax-exempt shareholders.
Taxation of Non-U.S. Shareholders
The following discussion addresses the rules governing U.S. federal income taxation of non-U.S. shareholders. For purposes of this summary, “non-U.S. shareholder” is a beneficial owner of our shares that is not a U.S. shareholder (as defined above under “—Taxation of U.S. Shareholders—Taxation of Taxable U.S. Shareholders”) or an entity that is treated as a partnership for U.S. federal income tax purposes. These rules are complex, and no attempt is made herein to provide more than a brief summary of such rules. Accordingly, the discussion does not address all aspects of U.S. federal income taxation and does not address state local or foreign tax consequences that may be relevant to a non-U.S. shareholder in light of its particular circumstances. Prospective non-U.S. shareholders are urged to consult their tax advisors to determine the impact of U.S. federal, state, local and foreign income tax laws on their ownership of our common shares or preferred shares, including any reporting requirements.
Distributions Generally. As described in the discussion below, distributions paid by us with respect to our common shares, our preferred shares and depositary shares will be treated for U.S. federal income tax purposes as either:
•ordinary income dividends;
•long-term capital gain; or
•return of capital distributions.
This discussion assumes that our shares will continue to be considered regularly traded on an established securities market for purposes of the Foreign Investment in Real Property Tax Act of 1980, or FIRPTA, provisions described below. If our shares are no longer regularly traded on an established securities market, the tax considerations described below would materially differ.
Ordinary Income Dividends. A distribution paid by us to a non-U.S. shareholder will be treated as an ordinary income dividend if the distribution is payable out of our earnings and profits and:
•not attributable to our net capital gain; or
•the distribution is attributable to our net capital gain from the sale of U.S. Real Property Interests (“USRPIs”), and the non-U.S. shareholder owns 10% or less of the value of our common shares at all times during the one-year period ending on the date of the distribution.
In general, non-U.S. shareholders will not be considered to be engaged in a U.S. trade or business solely as a result of their ownership of our shares. In cases where the dividend income from a non-U.S. shareholder’s investment in our shares is, or is treated as, effectively connected with the non-U.S. shareholder’s conduct of a U.S. trade or business, the non-U.S. shareholder generally will be subject to U.S. federal income tax at graduated rates, in the same manner as U.S. shareholders are taxed with respect to such dividends. Such income must generally be reported on a U.S. income tax return filed by or on behalf of the non-U.S. shareholder. The income may also be subject to the 30% branch profits tax in the case of a non-U.S. shareholder that is a corporation.
Generally, we will withhold and remit to the IRS 30% (or lower applicable treaty rate) of dividend distributions (including distributions that may later be determined to have been made in excess of current and accumulated earnings and profits) that could not be treated as capital gain distributions with respect to the non-U.S. shareholder (and that are not deemed to be capital gain dividends for purposes of the FIRPTA withholding rules described below) unless:
•a lower treaty rate applies and the non-U.S. shareholder files an IRS Form W-8BEN or Form W-8BEN-E, as applicable, evidencing eligibility for that reduced treaty rate with us; or
•the non-U.S. shareholder files an IRS Form W-8ECI with us claiming that the distribution is income effectively connected with the non-U.S. shareholder’s trade or business; or
•the non-U.S. shareholder is a foreign sovereign or controlled entity of a foreign sovereign and also provides an IRS Form W-8EXP claiming an exemption from withholding under section 892 of the Code.
Return of Capital Distributions. Unless (A) our shares constitute a USRPI, as described in “—Dispositions of Our Shares” below, or (B) either (1) the non-U.S. shareholder’s investment in our shares is effectively connected with a U.S. trade or business conducted by such non-U.S. shareholder (in which case the non-U.S. shareholder will be subject to the same treatment as U.S. shareholders with respect to such gain) or (2) the non-U.S. shareholder is a nonresident alien individual who was present in the United States for 183 days or more during the taxable year and has a “tax home” in the United States (in which case the non-U.S. shareholder will be subject to a 30% tax on the individual’s net capital gain for the year), distributions that we make which are not dividends out of our earnings and profits will not be subject to U.S. federal income tax. If we cannot determine at the time a distribution is made whether or not the distribution will exceed current and accumulated earnings and profits, the distribution will be subject to withholding at the rate applicable to dividends. The non-U.S. shareholder may seek a refund from the IRS of any amounts withheld if it subsequently is determined that the distribution was, in fact, in excess of our current and accumulated earnings and profits. If our shares constitute a USRPI, as described below, distributions that we make in excess of the sum of (1) the non-U.S. shareholder’s proportionate share of our earnings and profits, and (2) the non-U.S. shareholder’s basis in its shares, will be taxed under FIRPTA at the rate of tax, including any applicable capital gains rates, that would apply to a U.S. shareholder of the same type (e.g., an individual or a corporation, as the case may be), and the collection of the tax will be enforced by a refundable withholding tax at a rate of 15% of the amount by which the distribution exceeds the non-U.S. shareholder’s share of our earnings and profits.
Capital Gain Dividends. A distribution paid by us to a non-U.S. shareholder will be treated as long-term capital gain if the distribution is paid out of our current or accumulated earnings and profits and:
•the distribution is attributable to our net capital gain (other than from the sale of USRPIs) and we timely designate the distribution as a capital gain dividend; or
•the distribution is attributable to our net capital gain from the sale of USRPIs and the non-U.S. common shareholder owns more than 10% of the value of common shares at any point during the one-year period ending on the date on which the distribution is paid.
Long-term capital gain that a non-U.S. shareholder is deemed to receive from a capital gain dividend that is not attributable to the sale of USRPIs generally will not be subject to U.S. federal income tax in the hands of the non-U.S. shareholder unless:
•the non-U.S. shareholder’s investment in our shares is effectively connected with a U.S. trade or business of the non-U.S. shareholder, in which case the non-U.S. shareholder will be subject to the same treatment as U.S. shareholders with respect to any gain, except that a non-U.S. shareholder that is a corporation also may be subject to the 30% (or lower applicable treaty rate) branch profits tax; or
•the non-U.S. shareholder is a nonresident alien individual who is present in the United States for 183 days or more during the taxable year and has a “tax home” in the United States in which case the nonresident alien individual will be subject to a 30% tax on his capital gains.
Under FIRPTA, distributions that are attributable to net capital gain from the sale by us of USRPIs and paid to a non-U.S. shareholder that owns more than 10% of the value of our shares at any time during the one-year period ending on the date on which the distribution is paid will be subject to U.S. tax as income effectively connected with a U.S. trade or business. The FIRPTA tax will apply to these distributions whether or not the distribution is designated as a capital gain dividend, and, in the case of a non-U.S. shareholder that is a corporation, such distributions also may be subject to the 30% (or lower applicable treaty rate) branch profits tax.
Any distribution paid by us that is treated as a capital gain dividend or that could be treated as a capital gain dividend with respect to a particular non-U.S. shareholder will be subject to special withholding rules under FIRPTA. We will withhold and remit to the IRS 21% (or, to the extent provided in Treasury Regulations, 20%) of any distribution that could be treated as a capital gain dividend with respect to the non-U.S. shareholder, whether or not the distribution is attributable to the sale by us of USRPIs. The amount withheld is creditable against the non-U.S. shareholder’s U.S. federal income tax liability or refundable when the non-U.S. shareholder properly and timely files a tax return with the IRS.
Certain non-U.S. pension funds that are “qualified foreign pension funds” as defined by Section 897(l) of the Internal Revenue Code and certain non-U.S. publicly traded entities that are “qualified shareholders” as defined by Section 897(k) of the Internal Revenue Code may be entitled to exceptions to the FIRPTA tax with respect to distributions we pay. Non-U.S. shareholders should consult with their tax advisors regarding the application of these exceptions.
Undistributed Capital Gain. Although the law is not entirely clear on the matter, it appears that amounts designated by us as undistributed capital gains in respect of our shares held by non-U.S. shareholders generally should be treated in the same manner as actual distributions by us of capital gain dividends. Under this approach, the non-U.S. shareholder would be able to offset as a credit against their U.S. federal income tax liability resulting therefrom their proportionate share of the tax paid by us on the undistributed capital gains treated as long-term capital gains to the non-U.S. shareholder, and generally receive from the IRS a refund to the extent their proportionate share of the tax paid by us were to exceed the non-U.S. shareholder’s actual U.S. federal income tax liability on such long-term capital gain. If we were to designate any portion of our net capital gain as undistributed capital gain, a non-U.S. shareholder should consult its tax advisors regarding taxation of such undistributed capital gain.
Dispositions of Our Shares. Unless our shares constitute a USRPI, a sale of our shares by a non-U.S. shareholder generally will not be subject to U.S. federal income taxation under FIRPTA. Generally, subject to the discussion below regarding dispositions by “qualified shareholders” and “qualified foreign pension funds,” with respect to any particular shareholder, our shares will constitute a USRPI only if each of the following three statements is true:
•Fifty percent or more of our assets on any of certain testing dates during a prescribed testing period consist of interests in real property located within the United States, excluding for this purpose, interests in real property solely in a capacity as creditor;
•We are not a “domestically-controlled qualified investment entity.” A domestically-controlled qualified investment entity includes a REIT, less than 50% of value of which is held directly or indirectly by non-U.S. shareholders at all times during a specified testing period. Although we believe that we are and will remain a domestically-controlled REIT, because our shares are publicly traded, we cannot guarantee that we are or will remain a domestically-controlled qualified investment entity; and
•Either (a) our shares are not “regularly traded,” as defined by applicable Treasury Regulations, on an established securities market; or (b) our shares are “regularly traded” on an established securities market and the selling non-U.S. shareholder has held over 10% of our outstanding common shares any time during the five-year period ending on the date of the sale.
Certain non-U.S. pension funds that are “qualified foreign pension funds” as defined by Section 897(l) of the Internal Revenue Code and certain non-U.S. publicly traded entities that are “qualified shareholders” as defined by Section 897(k) of the Internal Revenue Code may be entitled to exceptions to the FIRPTA tax with respect to the sale of our shares. Non-U.S. shareholders should consult with their tax advisors regarding the application of these exceptions.
Specific wash sales rules applicable to sales of shares in a domestically-controlled qualified investment entity could result in gain recognition, taxable under FIRPTA, upon the sale of our shares even if we are a domestically-controlled qualified investment entity. These rules would apply if a non-U.S. shareholder (1) disposes of our shares within a 30-day period preceding the ex-dividend date of a distribution, any portion of which, but for the disposition, would have been taxable to such non-U.S. shareholder as gain from the sale or exchange of a USRPI, (2) acquires, or enters into a contract or option to acquire, other shares of our shares during the 61-day period that begins 30 days prior to such ex-dividend date, and (3) if our shares are “regularly traded” on an established securities market in the United States, such non-US stockholder has owned more than 10%
of our outstanding shares at any time during the one-year period ending on the date of such distribution.
If gain on the sale of our shares were subject to taxation under FIRPTA, the non-U.S. shareholder would be required to file a U.S. federal income tax return and would be subject to the same treatment as a U.S. shareholder with respect to such gain, subject to the applicable alternative minimum tax and a special alternative minimum tax in the case of non-resident alien individuals, and, if our common shares were not “regularly traded” on an established securities market, the purchaser of the shares generally would be required to withhold 15% of the purchase price and remit such amount to the IRS.
Gain from the sale of our shares that would not otherwise be subject to FIRPTA will nonetheless be taxable in the United States to a non-U.S. shareholder as follows: (1) if the non-U.S. shareholder’s investment in our shares is effectively connected with a U.S. trade or business conducted by such non-U.S. shareholder, the non-U.S. shareholder will be subject to the same treatment as a U.S. shareholder with respect to such gain, or (2) if the non-U.S. shareholder is a nonresident alien individual who was present in the U.S. for 183 days or more during the taxable year and has a “tax home” in the United States, the nonresident alien individual will be subject to a 30% tax on the individual’s capital gain.
Taxation of Holders of Our Warrants and Rights
Warrants. Holders of our warrants will not generally recognize gain or loss upon the exercise of a warrant. A holder’s basis in the preferred shares, depositary shares representing preferred shares or common shares, as the case may be, received upon the exercise of the warrant will be equal to the sum of the holder’s adjusted tax basis in the warrant and the exercise price paid. A holder’s holding period in the preferred shares, depositary shares representing preferred shares or common shares, as the case may be, received upon the exercise of the warrant will not include the period during which the warrant was held by the holder. Upon the expiration of a warrant, the holder will recognize a capital loss in an amount equal to the holder’s adjusted tax basis in the warrant. Upon the sale or exchange of a warrant to a person other than us, a holder will recognize gain or loss in an amount equal to the difference between the amount realized on the sale or exchange and the holder’s adjusted tax basis in the warrant. Such gain or loss will be capital gain or loss and will be long-term capital gain or loss if the warrant was held for more than one year. Upon the sale of the warrant to us, the IRS may argue that the holder should recognize ordinary income on the sale. Prospective holders of our warrants should consult their own tax advisors as to the consequences of a sale of a warrant to us.
Rights. In the event of a rights offering, the tax consequences of the receipt, expiration, and exercise of the rights we issue will be addressed in detail in a prospectus supplement. Prospective holders of our rights should review the applicable prospectus supplement in connection with the ownership of any rights, and consult their own tax advisors as to the consequences of investing in the rights.
Dividend Reinvestment and Share Purchase Plan
General
We offer shareholders and prospective shareholders the opportunity to participate in our Dividend Reinvestment and Share Purchase Plan, which is referred to herein as the “DRIP.”
Although we do not currently offer any discount in connection with the DRIP, nor do we plan to offer such a discount at present, we reserve the right to offer in the future a discount on shares purchased, not to exceed 5%, with reinvested dividends or cash distributions and shares purchased through the optional cash investment feature. This discussion assumes that we do not offer a discount in connection with the DRIP. If we were to offer a discount in connection with the DRIP the tax considerations described below would materially differ. In the event that we offer a discount in connection with the DRIP, shareholders are urged to consult with their tax advisors regarding the tax treatment to them of receiving a discount.
Amounts Treated as a Distribution
Generally, a DRIP participant will be treated as having received a distribution with respect to our shares for U.S. federal income tax purposes in an amount determined as described below.
•A shareholder who participates in the dividend reinvestment feature of the DRIP and whose dividends are reinvested in our shares purchased from us will be treated for U.S. federal income tax purposes as having received a distribution from us with respect to our shares equal to the fair market value of our shares credited to the shareholder’s DRIP account on the date the dividends are reinvested. The amount of the distribution deemed received will be reported on the Form 1099-DIV received by the shareholder.
•A shareholder who participates in the dividend reinvestment feature of the DRIP and whose dividends are reinvested in our shares purchased in the open market, will be treated for U.S. federal income tax purposes as having received (and
will receive a Form 1099-DIV reporting) a distribution from us with respect to its shares equal to the fair market value of our shares credited to the shareholder’s DRIP account (plus any brokerage fees and any other expenses deducted from the amount of the distribution reinvested) on the date the dividends are reinvested.
•A shareholder who participates in the optional cash purchase through the DRIP (or a newly enrolled participant not currently our shareholder making their initial investment in our common shares through the DRIP’s optional cash purchase feature) will not be treated as receiving a distribution from us.
We will pay the annual maintenance cost for each shareholder’s DRIP account. Consistent with the conclusion reached by the IRS in a private letter ruling issued to another REIT, we intend to take the position that the administrative costs do not constitute a distribution which is either taxable to a shareholder or which would reduce the shareholder’s basis in their common shares. However, because the private letter ruling was not issued to us, we have no legal right to rely on its conclusions. Thus, it is possible that the IRS might view the shareholder’s share of the administrative costs as constituting a taxable distribution to them and/or a distribution which reduces the basis in their shares. For this and other reasons, we may in the future take a different position with respect to these costs.
In the situations described above, a shareholder will be treated as receiving a distribution from us even though no cash distribution is actually received. These distributions will be taxable in the same manner as all other distributions paid by us, as described above under “—Taxation of U.S. Shareholders—Taxation of Taxable U.S. Shareholders,” “—Taxation of U.S. Shareholders—Taxation of Tax-Exempt Shareholders,” or “—Taxation of Non-U.S. Shareholders,” as applicable.
Basis and Holding Period in Shares Acquired Pursuant to the DRIP. The tax basis for our shares acquired by reinvesting cash distributions through the DRIP generally will equal the fair market value of our shares on the date of distribution (plus the amount of any brokerage fees paid by the shareholder). The holding period for our shares acquired by reinvesting cash distributions will begin on the day following the date of distribution.
The tax basis in our shares acquired through an optional cash investment generally will equal the cost paid by the participant in acquiring our shares, including any brokerage fees paid by the shareholder. The holding period for our shares purchased through the optional cash investment feature of the DRIP generally will begin on the day our shares are purchased for the participant’s account.
Withdrawal of Shares from the DRIP. When a participant withdraws stock from the DRIP and receives whole shares, the participant will not realize any taxable income. However, if the participant receives cash for a fractional share, the participant will be required to recognize gain or loss with respect to that fractional share.
Effect of Withholding Requirements. Withholding requirements generally applicable to distributions from us will apply to all amounts treated as distributions pursuant to the DRIP. See “—Information Reporting and Backup Withholding Tax Applicable to Shareholders—U.S. Shareholders-Generally” and “—Information Reporting and Backup Withholding Tax Applicable to Shareholders—Non-U.S. Shareholders—Generally” for discussion of the withholding requirements that apply to other distributions that we pay. All withholding amounts will be withheld from distributions before the distributions are reinvested under the DRIP. Therefore, if a U.S. shareholder is subject to withholding, distributions which would otherwise be available for reinvestment under the DRIP will be reduced by the withholding amount.
Information Reporting and Backup Withholding Tax Applicable to Shareholders
U.S. Shareholders—Generally
In general, information-reporting requirements will apply to payments of distributions on our shares and payments of the proceeds of the sale of our shares to some U.S. shareholders, unless an exception applies. Further, the payer will be required to withhold backup withholding tax on such payments at the rate of 28% if:
(1) the payee fails to furnish a taxpayer identification number (“TIN”) to the payer or to establish an exemption from backup withholding;
(2) the IRS notifies the payer that the TIN furnished by the payee is incorrect;
(3) there has been a notified payee under-reporting with respect to interest, dividends or original issue discount described in Section 3406(c) of the Code; or
(4) there has been a failure of the payee to certify under the penalty of perjury that the payee is not subject to backup withholding under the Code.
Some shareholders may be exempt from backup withholding. Any amounts withheld under the backup withholding rules from a payment to a shareholder will be allowed as a credit against the shareholder’s U.S. federal income tax liability and may entitle the shareholder to a refund, provided that the required information is furnished to the IRS.
U.S. Shareholders—Withholding on Payments in Respect of Certain Foreign Accounts.
As described below, certain future payments made to “foreign financial institutions” and “non-financial foreign entities” may be subject to withholding at a rate of 30%. U.S. shareholders should consult their tax advisors regarding the effect, if any, of this withholding provision on their ownership and disposition of our common stock. See “—Non-U.S. Shareholders—Withholding on Payments to Certain Foreign Entities” below.
Non-U.S. Shareholders—Generally
Generally, information reporting will apply to payments or distributions on our shares, and backup withholding described above for a U.S. shareholder will apply, unless the payee certifies that it is not a U.S. person or otherwise establishes an exemption. The payment of the proceeds from the disposition of our shares to or through the U.S. office of a U.S. or foreign broker will be subject to information reporting and, possibly, backup withholding as described above for U.S. shareholders, or the withholding tax for non-U.S. shareholders, as applicable, unless the non-U.S. shareholder certifies as to its non-U.S. status or otherwise establishes an exemption, provided that the broker does not have actual knowledge that the shareholder is a U.S. person or that the conditions of any other exemption are not, in fact, satisfied. The proceeds of the disposition by a non-U.S. shareholder of our shares to or through a foreign office of a broker generally will not be subject to information reporting or backup withholding. However, if the broker is a U.S. person, a controlled foreign corporation for U.S. federal income tax purposes, or a foreign person 50% or more of whose gross income from all sources for specified periods is from activities that are effectively connected with a U.S. trade or business, a foreign partnership 50% or more of whose interests are held by partners who are U.S. persons, or a foreign partnership that is engaged in the conduct of a trade or business in the United States, then information reporting generally will apply as though the payment was made through a U.S. office of a U.S. or foreign broker unless the broker has documentary evidence as to the non-U.S. shareholder’s foreign status and has no actual knowledge to the contrary.
Applicable Treasury Regulations provide presumptions regarding the status of shareholders when payments to the shareholders cannot be reliably associated with appropriate documentation provided to the payor. If a non-U.S. shareholder fails to comply with the information reporting requirement, payments to such person may be subject to the full withholding tax even if such person might have been eligible for a reduced rate of withholding or no withholding under an applicable income tax treaty. Because the application of these Treasury Regulations varies depending on the non-U.S. shareholder’s particular circumstances, non-U.S. shareholders are urged to consult their tax advisor regarding the information reporting requirements applicable to them.
Backup withholding is not an additional tax. Any amounts that we withhold under the backup withholding rules will be refunded or credited against the non-U.S. shareholder’s U.S. federal income tax liability if certain required information is furnished to the IRS. Non-U.S. shareholders should consult their own tax advisors regarding application of backup withholding in their particular circumstances and the availability of and procedure for obtaining an exemption from backup withholding under current Treasury Regulations.
Non-U.S. Shareholders—Withholding on Payments to Certain Foreign Entities
The Foreign Account Tax Compliance Act (“FATCA”) imposes a 30% withholding tax on certain types of payments made to “foreign financial institutions” and certain other non-U.S. entities unless certain due diligence, reporting, withholding, and certification obligations requirements are satisfied.
As a general matter, FATCA imposes a 30% withholding tax on dividends in respect of our shares if paid to a foreign entity unless either (i) the foreign entity is a “foreign financial institution” that undertakes certain due diligence, reporting, withholding, and certification obligations, or in the case of a foreign financial institution that is a resident in a jurisdiction that has entered into an intergovernmental agreement to implement FATCA, the entity complies with the diligence and reporting requirements of such agreement, (ii) the foreign entity is not a “foreign financial institution” and identifies certain of its U.S. investors, or (iii) the foreign entity otherwise is exempted under FATCA. While withholding under FATCA would have applied to payments of gross proceeds from the sale or other disposition of our shares received after December 31, 2018, proposed Treasury Regulations eliminate FATCA withholding on payments of gross proceeds entirely. Taxpayers may generally rely on these proposed Treasury Regulations until final Treasury Regulations are issued.
If withholding is required under FATCA on a payment related to our shares, investors that otherwise would not be subject to withholding (or that otherwise would be entitled to a reduced rate of withholding) generally will be required to seek a refund or credit from the IRS to obtain the benefit of such exemption or reduction (provided that such benefit is available). Prospective
investors should consult their tax advisors regarding the effect of FATCA in their particular circumstances.
Taxation of Holders of Debt Securities
The following discussion summarizes certain U.S. federal income tax considerations relating to the purchase, ownership and disposition of certain debt securities that we may offer. This summary assumes the debt securities will be issued with no more than a de minimis amount of original issue discount for U.S. federal income tax purposes. This summary only applies to investors that will hold their debt securities as “capital assets” (within the meaning of Section 1221 of the Code) and purchase their debt securities in the initial offering at their issue price. If such debt securities are purchased at a price other than the offering price, the amortizable bond premium or market discount rules may apply which are not described herein. Prospective holders should consult their own tax advisors regarding these possibilities. This section also does not apply to any debt securities treated as “equity,” rather than debt, for U.S. federal income tax purposes.
The tax consequences of owning any notes issued with more than de minimis original issue discount, floating rate debt securities, convertible or exchangeable notes, indexed notes or other debt securities not covered by this discussion that we offer will be discussed in the applicable prospectus supplement.
U.S. Holders of Debt Securities
This section summarizes the taxation of U.S. Holders of debt securities that are not tax-exempt organizations. For these purposes, the term “U.S. Holder” is a beneficial owner of our debt securities that is, for U.S. federal income tax purposes:
•a citizen or resident of the United States;
•a corporation (including an entity treated as a corporation for U.S. federal income tax purposes) created or organized in or under the laws of the United States or of a political subdivision thereof (including the District of Columbia);
•an estate the income of which is subject to U.S. federal income taxation regardless of its source; or
•any trust if (1) a U.S. court is able to exercise primary supervision over the administration of such trust and one or more U.S. persons have the authority to control all substantial decisions of the trust, or (2) it has a valid election in place to be treated as a U.S. person.
If an entity or arrangement treated as a partnership for U.S. federal income tax purposes holds our debt securities, the U.S. federal income tax treatment of a partner generally will depend upon the status of the partner and the activities of the partnership. A partner of a partnership holding our debt securities should consult its own tax advisor regarding the U.S. federal income tax consequences to the partner of the acquisition, ownership and disposition of our debt securities by the partnership.
Payments of Interest. Interest on a note will generally be taxable to a U.S. Holder as ordinary interest income at the time it is received or accrued, in accordance with the U.S. Holder’s regular method of tax accounting for U.S. federal income tax purposes.
Sale, Exchange, Retirement, Redemption or Other Taxable Disposition of the Debt Securities. Upon a sale, exchange, retirement, redemption or other taxable disposition of debt securities, a U.S. Holder generally will recognize taxable gain or loss in an amount equal to the difference, if any, between the “amount realized” on the disposition and the U.S. Holder’s adjusted tax basis in such debt securities. The amount realized will include the amount of any cash and the fair market value of any property received for the debt securities (other than any amount attributable to accrued but unpaid interest, which will be taxable as ordinary income (as described above under “—Taxation of Holders of Debt Securities—U.S. Holders of Debt Securities—Payments of Interest”) to the extent not previously included in income). A U.S. Holder’s adjusted tax basis in a note generally will be equal to the cost of the note to such U.S. Holder decreased by any payments received on the note other than stated interest. Any such gain or loss generally will be capital gain or loss, and will be long-term capital gain or loss if the U.S. Holder’s holding period for the note is more than one year at the time of disposition. For non-corporate U.S. Holders, long-term capital gain generally will be subject to reduced rates of taxation. The deductibility of capital losses against ordinary income is subject to certain limitations.
Information Reporting and Backup Withholding. Payments of interest on, or the proceeds of the sale, exchange or other taxable disposition (including a retirement or redemption) of, a note are generally subject to information reporting unless the U.S. Holder is an exempt recipient (such as a corporation). Such payments may also be subject to U.S. federal backup withholding unless (1) the U.S. Holder is an exempt recipient (such as a corporation), or (2) prior to payment, the U.S. Holder provides a
taxpayer identification number and certifies as required on a duly completed and executed IRS Form W-9 (or permitted substitute or successor form), and otherwise complies with the requirements of the backup withholding rules. Backup withholding is not an additional tax. Any amounts withheld under the backup withholding rules will be allowed as a refund or credit against that U.S. Holder’s U.S. federal income tax liability provided the required information is timely furnished to the IRS.
Net Investment Income. In certain circumstances, certain U.S. Holders that are individuals, estates, or trusts are subject to a 3.8% tax on “net investment income, which includes, among other things, interest income and net gains from the sale, exchange or other taxable disposition (including a retirement or redemption) of the debt securities, unless such interest payments or net gains are derived in the ordinary course of the conduct of a trade or business (other than a trade or business that consists of certain passive activities or securities or commodities trading activities). Investors in debt securities should consult their own tax advisors regarding the applicability of this tax to their income and gain in respect of their investment in the debt securities.
Tax-Exempt Holders of Debt Securities
In general, a tax-exempt organization is exempt from U.S. federal income tax on its income, except to the extent of its UBTI (as defined above under “—Taxation of U.S. Shareholders-Taxation of U.S. Tax-Exempt Shareholders”). Interest income accrued on the debt securities and gain recognized in connection with dispositions of the debt securities generally will not constitute UBTI unless the tax-exempt organization holds the debt securities as debt-financed property (e.g., the tax-exempt organization has incurred “acquisition indebtedness” with respect to such note). Before making an investment in the debt securities, a tax-exempt investor should consult its tax advisors with regard to UBTI and the suitability of the investment in the debt securities.
Non-U.S. Holders of Debt Securities
The following discussion addresses the rules governing U.S. federal income taxation of Non-U.S. Holders of debt securities. For purposes of this summary, “Non-U.S. Holder” is a beneficial owner of our debt securities that is not (i) a U.S. Holder (as defined above under “—U.S. Holders of Debt Securities”) or (ii) an entity treated as a partnership for U.S. federal income tax purposes.
Payments of Interest. Subject to the discussions below concerning backup withholding and FATCA (as defined below), all payments of interest on the debt securities made to a Non-U.S. Holder will not be subject to U.S. federal income or withholding taxes under the “portfolio interest” exception of the Code, provided that the Non-U.S. Holder:
•does not own, actually or constructively, 10% or more of our stock,
•is not a controlled foreign corporation with respect to which we are a “related person” (within the meaning of Section 864(d)(4) of the Code),
•is not a bank whose receipt of interest on a note is described in Section 881(c)(3)(A) of the Code, and
•provides its name and address on an IRS Form W-8BEN or IRS Form W-8BEN-E (or other applicable form) and certifies, under penalties of perjury, that it is not a U.S. Holder.
The applicable Treasury Regulations provide alternative methods for satisfying the certification requirement described in this section. In addition, under these Treasury Regulations, special rules apply to pass-through entities and this certification requirement may also apply to beneficial owners of pass-through entities. If a Non-U.S. Holder cannot satisfy the requirements described above, payments of interest will generally be subject to the 30% U.S. federal withholding tax, unless the Non-U.S. Holder provides the applicable withholding agent with a properly executed (1) IRS Form W-8BEN or IRS Form W-8BEN-E (or other applicable form) claiming an exemption from or reduction in withholding under an applicable income tax treaty or (2) IRS Form W-8ECI (or other applicable form) stating that interest paid on the debt securities is not subject to U.S. federal withholding tax because it is effectively connected with the conduct by such Non-U.S. Holder of a trade or business in the United States (as discussed below under “—Non-U.S. Holders of Debt Securities—Income Effectively Connected with a U.S. Trade or Business”).
Sale, Exchange, Retirement, Redemption or Other Taxable Disposition of the Debt Securities. Subject to the discussions below concerning backup withholding and FATCA and except with respect to accrued but unpaid interest, which generally will be taxable as interest and may be subject to the rules described above under “—Non-U.S. Holders of Debt Securities—Payments of Interest,” a Non-U.S. Holder generally will not be subject to U.S. federal income or withholding tax on the receipt of payments of principal on a note, or on any gain recognized upon the sale, exchange, retirement, redemption or other taxable disposition of a note, unless:
•such gain is effectively connected with the conduct by such Non-U.S. Holder of a trade or business within the United States, in which case such gain will be taxed as described below under “—Non-U.S. Holders of Debt Securities—Income Effectively Connected with a U.S. Trade or Business,” or
•such Non-U.S. Holder is an individual who is present in the United States for 183 days or more in the taxable year of disposition, and certain other conditions are met, in which case such Non-U.S. Holder will be subject to tax at 30% (or, if applicable, a lower treaty rate) on the gain derived from such disposition, which may be offset by U.S. source capital losses.
Income Effectively Connected with a U.S. Trade or Business. If a Non-U.S. Holder is engaged in a trade or business in the United States, and if interest on the debt securities or gain realized on the sale, exchange or other taxable disposition (including a retirement or redemption) of the debt securities is effectively connected with the conduct of such trade or business, the Non-U.S. Holder generally will be subject to regular U.S. federal income tax on such income or gain in the same manner as if the Non-U.S. Holder were a U.S. Holder. If the Non-U.S. Holder is eligible for the benefits of an income tax treaty between the United States and the Non-U.S. Holder’s country of residence, any “effectively connected” income or gain generally will be subject to U.S. federal income tax only if it is also attributable to a permanent establishment or fixed base maintained by the Non-U.S. Holder in the United States. In addition, if such a Non-U.S. Holder is a foreign corporation, such holder may also be subject to a branch profits tax equal to 30% (or such lower rate provided by an applicable income tax treaty) of its effectively connected earnings and profits, subject to certain adjustments. Payments of interest that are effectively connected with a U.S. trade or business will not be subject to the 30% U.S. federal withholding tax provided that the Non-U.S. Holder claims exemption from withholding. To claim exemption from withholding, the Non-U.S. Holder must certify its qualification, which generally can be done by filing a properly executed IRS Form W-8ECI (or other applicable form).
Information Reporting and Backup Withholding. Generally, we must report annually to the IRS and to Non-U.S. Holders the amount of interest paid to Non-U.S. Holders and the amount of tax, if any, withheld with respect to those payments. Copies of these information returns reporting such interest and withholding may also be made available under the provisions of a specific treaty or agreement to the tax authorities of the country in which the Non-U.S. Holder resides. In general, a Non-U.S. Holder will not be subject to backup withholding or additional information reporting requirements with respect to payments of interest that we make, provided that the statement described above in last bullet point under “—Non-U.S. Holders of Debt Securities—Interest” has been received and we do not have actual knowledge or reason to know that the holder is a U.S. person, as defined under the Code, that is not an exempt recipient. In addition, proceeds from a sale or other disposition of a note by a Non-U.S. Holder generally will be subject to information reporting and, depending on the circumstances, backup withholding with respect to payments of the proceeds of the sale or disposition (including a retirement or redemption) of a note within the United States or conducted through certain U.S. or U.S.-related financial intermediaries, unless the statement described above has been received and we do not have actual knowledge or reason to know that the holder is a U.S. person. Backup withholding is not an additional tax. Any amounts withheld under the backup withholding rules will be allowed as a refund or a credit against a non-U.S. holder’s U.S. federal income tax liability if the required information is furnished in a timely manner to the IRS.
Additional Withholding Requirements. As discussed above under “—Information Reporting and Backup Withholding Tax Applicable to Shareholders—Non-U.S. Shareholders—Withholding on Payments to Certain Foreign Entities,” FATCA imposes a 30% withholding tax on certain types of payments made to “foreign financial institutions” and certain other non-U.S. entities unless certain due diligence, reporting, withholding, and certification obligations requirements are satisfied.
As a general matter, payments to Non-U.S. Holders that are foreign entities (whether as beneficial owner or intermediary) of interest on a debt obligation of a U.S. issuer will be subject to a withholding tax (separate and apart from, but without duplication of, the withholding tax described above) at a rate of 30%, unless various U.S. information reporting and due diligence requirements (generally relating to ownership by U.S. persons of interests in or accounts with those entities) have been satisfied. While withholding under FATCA would have applied to payments of gross proceeds from the sale or other disposition of, a debt obligation of a U.S. issuer received after December 31, 2018, proposed Treasury Regulations eliminate FATCA withholding on payments of gross proceeds entirely. Taxpayers may generally rely on these proposed Treasury Regulations until final Treasury Regulations are issued.
If withholding is required under FATCA on a payment related to the debt securities, Non-U.S. Holders that otherwise would not be subject to withholding (or that otherwise would be entitled to a reduced rate of withholding) generally will be required to seek a refund or credit from the IRS to obtain the benefit of such exemption or reduction (provided that such benefit is available). Prospective investors should consult their tax advisors regarding the effect of FATCA in their particular circumstances.
Other Tax Considerations
State, Local and Foreign Taxes
We may be required to pay tax in various state or local jurisdictions, including those in which we transact business, and our shareholders may be required to pay tax in various state or local jurisdictions, including those in which they reside. Our state and local tax treatment may not conform to the U.S. federal income tax consequences discussed above. In addition, a shareholder’s state and local tax treatment may not conform to the U.S. federal income tax consequences discussed above. Consequently, prospective investors should consult with their tax advisors regarding the effect of state and local tax laws on an investment in our shares and depositary shares.
A portion of our income is earned through our taxable REIT subsidiaries. The taxable REIT subsidiaries are subject to U.S. federal, state and local income tax at the full applicable corporate rates. In addition, a taxable REIT subsidiary will be limited in its ability to deduct interest payments in excess of a certain amount made directly or indirectly to us. To the extent that our taxable REIT subsidiaries and we are required to pay U.S. federal, state or local taxes, we will have less cash available for distribution to shareholders.
Tax Shelter Reporting
If a holder recognizes a loss as a result of a transaction with respect to our shares of at least (i) for a holder that is an individual, S corporation, trust or a partnership with at least one non-corporate partner, $2 million or more in a single taxable year or $4 million or more in a combination of taxable years, or (ii) for a holder that is either a corporation or a partnership with only corporate partners, $10 million or more in a single taxable year or $20 million or more in a combination of taxable years, such holder may be required to file a disclosure statement with the IRS on Form 8886. Direct shareholders of portfolio securities are in many cases exempt from this reporting requirement, but shareholders of a REIT currently are not excepted. The fact that a loss is reportable under these regulations does not affect the legal determination of whether the taxpayer’s treatment of the loss is proper. Shareholders should consult their tax advisors to determine the applicability of these regulations in light of their individual circumstances.
Legislative or Other Actions Affecting REITs
The rules dealing with U.S. federal income taxation are constantly under review by persons involved in the legislative process and by the IRS and the U.S. Treasury Department. We cannot give you any assurances as to whether, or in what form, any proposals affecting REITs or their shareholders will be enacted. Changes to the U.S. federal tax laws and interpretations thereof could adversely affect an investment in our shares. Shareholders should consult their tax advisors regarding the effect of potential changes to the U.S. federal tax laws and on an investment in our shares.
PART III
Certain information required by Part III is omitted from this Form 10-K in that we will file a definitive proxy statement pursuant to Regulation 14A with respect to our 2021 Annual Meeting (the “Proxy Statement”) no later than 120 days after the end of the fiscal year covered by this Form 10-K, and certain information included therein is incorporated herein by reference. Only those sections of the Proxy Statement which specifically address the items set forth herein are incorporated by reference. In addition, we have adopted a code of ethics that applies to all of our trustees, officers and employees, which can be reviewed and printed from our website www.washreit.com.
ITEM 10: DIRECTORS, EXECUTIVE OFFICERS AND CORPORATE GOVERNANCE
| | | | | |
| NAME | POSITION |
| Trustees | |
| Paul T. McDermott | Chairman and Chief Executive Officer, WashREIT |
| Edward S. Civera | Lead Independent Trustee, WashREIT; Retired Chairman, Catalyst Health Solutions, Inc. |
| Benjamin S. Butcher | Chief Executive Officer, President and Chairman of the Board of Directors of STAG Industrial, Inc. |
| William G. Byrnes | Retired Managing Director, Alex Brown & Sons |
| Ellen M. Goitia | Retired Partner, KPMG |
| Thomas H. Nolan, Jr. | Former Chairman of the Board and Chief Executive Officer, Spirit Realty Capital Inc. |
| Vice Adm. Anthony L. Winns (RET.) | President, Middle East-Africa Region, Lockheed Martin Corporation |
| |
| Executive Officers | |
| Stephen E. Riffee | Executive Vice President and Chief Financial Officer |
| Taryn D. Fielder | Senior Vice President, General Counsel and Corporate Secretary |
The other information required by this Item is hereby incorporated herein by reference to our Proxy Statement.
ITEM 11: EXECUTIVE COMPENSATION
The information required by this Item is hereby incorporated herein by reference to our Proxy Statement.
ITEM 12: SECURITY OWNERSHIP OF CERTAIN BENEFICIAL OWNERS AND MANAGEMENT AND RELATED STOCKHOLDER MATTERS
The information required by this Item is hereby incorporated herein by reference to our Proxy Statement.
ITEM 13: CERTAIN RELATIONSHIPS AND RELATED TRANSACTIONS, AND DIRECTOR INDEPENDENCE
The information required by this Item is hereby incorporated herein by reference to our Proxy Statement.
ITEM 14: PRINCIPAL ACCOUNTANT FEES AND SERVICES
The information required by this Item is hereby incorporated herein by reference to our Proxy Statement.
PART IV
ITEM 15: EXHIBITS AND FINANCIAL STATEMENT SCHEDULES
(A). The following documents are filed as part of this Form 10-K:
| | | | | | | | |
| 1 | Financial Statements | Page |
| | |
| Management's Report on Internal Control Over Financial Reporting | |
| Report of Independent Registered Public Accounting Firm | |
| Report of Independent Registered Public Accounting Firm on Internal Control Over Financial Reporting | |
| Consolidated Balance Sheets as of December 31, 2020 and 2019 | |
| Consolidated Statements of Operations for the Years Ended December 31, 2020, 2019 and 2018 | |
| Consolidated Statements of Comprehensive Income for the Years Ended December 31, 2020, 2019 and 2018 | |
| Consolidated Statements of Equity for the Years Ended December 31, 2020, 2019 and 2018 | |
| Consolidated Statements of Cash Flows for the Years Ended December 31, 2020, 2019 and 2018 | |
| Notes to Consolidated Financial Statements | |
| | |
| 2 | Financial Statement Schedules | |
| | |
| Schedule II – Valuation and Qualifying Accounts | |
| Schedule III – Consolidated Real Estate and Accumulated Depreciation | |
| All other schedules are omitted because they are either not required or the required information is shown in the financial statements or notes thereto. | |
| | |
| 3 | Exhibits: | |
| | | | | | | | | | | | | | | | | | | | | | | | | | | | | | | | |
| | Incorporated by Reference | | |
Exhibit
Number | Exhibit Description | Form | | File
Number | | Exhibit | | Filing Date | | Filed
Herewith |
| 3.1 | | | | | | | | | | X |
| 3.2 | | | | | | | | | | X |
| 3.3 | | 10-Q | | 001-06622 | | 3.2 | | 7/31/2017 | | |
| 4.1 | | 8-K | | 001-06622 | | (c) | | 8/13/1996 | | |
| 4.2 | | 8-K | | 001-06622 | | 99.1 | | 2/25/1998 | | |
| 4.3 | | 8-K | | 001-06622 | | 4.1 | | 7/5/2007 | | |
| 4.4 | | 8-K | | 001-06622 | | 4.1 | | 9/30/2010 | | |
| 4.5 | | 8-K | | 001-06622 | | 4.2 | | 9/30/2010 | | |
| 4.6 | | 8-K | | 001-06622 | | 4.1 | | 9/17/2012 | | |
| 4.7 | | 8-K | | 001-06622 | | 4.2 | | 9/17/2012 | | |
| 4.8 | | | | | | | | | | X |
| 10.1* | | 10-Q | | 001-06622 | | 10(j) | | 11/14/2002 | | |
| 10.2* | | 10-Q | | 001-06622 | | 10(k) | | 11/14/2002 | | |
| 10.3* | | 10-K | | 001-06622 | | 10(p) | | 3/16/2006 | | |
| 10.4* | | DEF 14A | | 001-06622 | | B | | 4/9/2007 | | |
| 10.5* | | 10-K | | 001-06622 | | 10(gg) | | 2/29/2008 | | |
| 10.6* | | 10-K | | 001-06622 | | 10(hh) | | 2/29/2008 | | |
| 10.7* | | 8-K | | 001-06622 | | 10(nn) | | 7/27/2009 | | |
| 10.8* | | 8-K | | 001-06622 | | 10.31 | | 11/2/2010 | | |
| 10.9* | | 8-K | | 001-06622 | | 10.32 | | 11/2/2010 | | |
| | | | | | | | | | | | | | | | | | | | | | | | | | | | | | | | |
| | Incorporated by Reference | | |
Exhibit
Number | Exhibit Description | Form | | File
Number | | Exhibit | | Filing Date | | Filed
Herewith |
| 10.10* | | 10-K | | 001-06622 | | 10.37 | | 2/27/2013 | | |
| 10.11* | | 10-Q | | 001-06622 | | 10.45 | | 5/9/2013 | | |
| 10.12* | | 10-Q | | 001-06622 | | 10.46 | | 5/9/2013 | | |
| 10.13* | | 10-Q | | 001-06622 | | 10.47 | | 5/9/2013 | | |
| 10.14* | | 10-Q | | 001-06622 | | 10.53 | | 11/1/2013 | | |
| 10.15* | | 10-Q | | 001-06622 | | 10.54 | | 11/1/2013 | | |
| 10.16* | | 10-K | | 001-06622 | | 10.44 | | 3/3/2014 | | |
| 10.17* | | 10-K | | 001-06622 | | 10.45 | | 3/3/2014 | | |
| 10.18* | | 10-K | | 001-06622 | | 10.46 | | 3/3/2014 | | |
| 10.19* | | 10-Q | | 001-06622 | | 10.47 | | 5/7/2014 | | |
| 10.20* | | 10-Q | | 001-06622 | | 10.50 | | 8/5/2014 | | |
| 10.21* | | 10-Q | | 001-06622 | | 10.51 | | 8/5/2014 | | |
| 10.22* | | 10-Q | | 001-06622 | | 10.54 | | 10/30/2014 | | |
| 10.23* | | 10-K | | 001-06622 | | 10.52 | | 3/2/2015 | | |
| 10.24* | | 10-K | | 001-06622 | | 10.54 | | 3/2/2015 | | |
| 10.25* | | 10-K | | 001-06622 | | 10.55 | | 3/2/2015 | | |
| 10.26* | | 10-K | | 001-06622 | | 10.56 | | 3/2/2015 | | |
| 10.27* | | 10-Q | | 001-06622 | | 10.57 | | 5/5/2015 | | |
| 10.28* | | 10-Q | | 001-06622 | | 10.58 | | 5/5/2015 | | |
| 10.29* | | 10-Q | | 001-06622 | | 10.60 | | 11/4/2015 | | |
| 10.30* | | 10-Q | | 001-06622 | | 10.61 | | 11/4/2015 | | |
| 10.31* | | DEF 14A | | 001-06622 | | Annex A | | 3/23/2016 | | |
| 10.32* | | 10-K | | 001-06622 | | 10.49 | | 2/20/2018 | | |
| 10.33* | | 10-K | | 001-06622 | | 10.50 | | 2/20/2018 | | |
| 10.34* | | 10-Q | | 001-06622 | | 10.1 | | 7/31/2017 | | |
| 10.35 | | 10-Q | | 001-06622 | | 10.53 | | 5/1/2018 | | |
| 10.36* | | 10-Q | | 001-06622 | | 10.54 | | 4/30/2018 | | |
| 10.37* | | 10-Q | | 001-06622 | | 10.1 | | 4/29/2019 | | |
| 10.38* | | 10-Q | | 001-06622 | | 10.2 | | 4/29/2019 | | |
| 10.39* | | 10-Q | | 001-06622 | | 10.3 | | 4/29/2019 | | |
| 10.40 | | 10-Q | | 001-06622 | | 10.1 | | 7/29/2019 | | |
| 10.41 | | 10-Q | | 001-06622 | | 10.2 | | 7/29/2019 | | |
| 10.42 | | 8-K | | 001-06622 | | 10.1 | | 7/26/2019 | | |
| 10.43* | | 10-K | | 001-06622 | | 10.45 | | 2/19/20 | | |
| 10.44* | | 10-K | | 001-06622 | | 10.46 | | 2/19/20 | | |
| 10.45 | | 10-Q | | 001-06622 | | 10.1 | | 10/30/20 | | |
| | | | | | | | | | | | | | | | | | | | | | | | | | | | | | | | |
| | Incorporated by Reference | | |
Exhibit
Number | Exhibit Description | Form | | File
Number | | Exhibit | | Filing Date | | Filed
Herewith |
| 21 | | | | | | | | | | X |
| 23 | | | | | | | | | | X |
| 24 | | | | | | | | | | X |
| 31.1 | | | | | | | | | | X |
| 31.2 | | | | | | | | | | X |
| 31.3 | | | | | | | | | | X |
| 32 | | | | | | | | | | X |
| 101.INS | XBRL Instance Document - the instance document does not appear in the Interactive Data File because its XBRL tags are embedded within the Inline XBRL document. | | | | | | | | | X |
| 101.SCH | Inline XBRL Taxonomy Extension Schema Document | | | | | | | | | X |
| 101.CAL | Inline XBRL Taxonomy Extension Calculation Linkbase Document | | | | | | | | | X |
| 101.DEF | Inline XBRL Taxonomy Extension Definition Linkbase Document | | | | | | | | | X |
| 101.LAB | Inline XBRL Taxonomy Extension Label Linkbase Document | | | | | | | | | X |
| 101.PRE | Inline XBRL Taxonomy Extension Presentation Linkbase Document | | | | | | | | | X |
| 104 | Cover Page Interactive Data File (embedded within the Inline XBRL document and contained in Exhibit 101) | | | | | | | | | |
* Management contracts or compensation plans or arrangements in which trustees or executive officers are eligible to participate.
In accordance with Item 601(b)(4)(iii)(A) of Regulation S-K, copies of certain instruments defining the rights of holders of long-term debt of WashREIT or its subsidiaries are not filed herewith. Pursuant to this regulation, we hereby agree to furnish a copy of any such instrument to the SEC upon request.
ITEM 16: FORM 10-K SUMMARY
We have chosen not to include a Form 10-K Summary.
SIGNATURES
Pursuant to the requirements of Section 13 or 15(d) of the Securities Exchange Act of 1934, the registrant has duly caused this report to be signed on its behalf by the undersigned, thereunto duly authorized.
WASHINGTON REAL ESTATE INVESTMENT TRUST
Date: February 16, 2021
By: /s/ Paul T. McDermott
Paul T. McDermott
President and Chief Executive Officer
Pursuant to the requirements of the Securities Exchange Act of 1934, this report has been signed below by the following persons on behalf of the registrant and in the capacities and on the dates indicated.
| | | | | | | | | | | | | | |
| Signature | | Title | | Date |
| | | | |
| /s/ Paul T. McDermott | | Chairman and Chief Executive Officer | | February 16, 2021 |
| Paul T. McDermott | | | | |
| | | | |
| /s/ Edward S. Civera* | | Lead Independent Trustee | | February 16, 2021 |
| Edward S. Civera | | | | |
| | | | |
| /s/ Benjamin S. Butcher* | | Trustee | | February 16, 2021 |
| Benjamin S. Butcher | | | | |
| | | | |
| /s/ William G. Byrnes* | | Trustee | | February 16, 2021 |
| William G. Byrnes | | | | |
| | | | |
| /s/ Ellen M. Goitia* | | Trustee | | February 16, 2021 |
| Ellen M. Goitia | | | | |
| | | | |
| /s/ Thomas H. Nolan, Jr.* | | Trustee | | February 16, 2021 |
| Thomas H. Nolan, Jr. | | | | |
| | | | |
| /s/ Anthony L. Winns* | | Trustee | | February 16, 2021 |
| Anthony L. Winns | | | | |
| | | | |
| /s/ Stephen E. Riffee | | Executive Vice President and | | February 16, 2021 |
| Stephen E. Riffee | | Chief Financial Officer | | |
| | (Principal Financial Officer) | | |
| | | | |
| /s/ W. Drew Hammond | | Vice President, Chief Accounting Officer and | | February 16, 2021 |
| W. Drew Hammond | | Treasurer | | |
| | (Principal Accounting Officer) | | |
* By: /s/ W. Drew Hammond through power of attorney
W. Drew Hammond
MANAGEMENT’S REPORT ON
INTERNAL CONTROL OVER FINANCIAL REPORTING
Management of Washington Real Estate Investment Trust (“WashREIT”) is responsible for establishing and maintaining adequate internal control over financial reporting and for the assessment of the effectiveness of internal controls over financial reporting. WashREIT’s internal control system over financial reporting is a process designed under the supervision of WashREIT’s principal executive and principal financial officers to provide reasonable assurance regarding the reliability of financial reporting and the preparation of the consolidated financial statements in accordance with U.S. generally accepted accounting principles.
All internal control systems, no matter how well designed, have inherent limitations. Therefore, even those systems determined to be effective can provide only reasonable assurance with respect to financial statement preparation and presentation. Also, projections of any evaluation of effectiveness to future periods are subject to the risk that controls may become inadequate because of changes in conditions.
In connection with the preparation of WashREIT’s annual consolidated financial statements, management has undertaken an assessment of the effectiveness of WashREIT’s internal control over financial reporting as of December 31, 2020, based on criteria established in Internal Control-Integrated Framework issued in 2013 by the Committee of Sponsoring Organizations of the Treadway Commission (the 2013 COSO Framework). Management’s assessment included an evaluation of the design of WashREIT’s internal control over financial reporting and testing of the operational effectiveness of those controls.
Based on this assessment, management has concluded that as of December 31, 2020, WashREIT’s internal control over financial reporting was effective at a reasonable assurance level regarding the reliability of financial reporting and the preparation of financial statements for external purposes in accordance with U.S. generally accepted accounting principles.
Ernst & Young LLP, the independent registered public accounting firm that audited WashREIT’s consolidated financial statements included in this report, has issued an unqualified opinion on the effectiveness of WashREIT’s internal control over financial reporting, a copy of which appears on page 85 of this annual report.
Report of Independent Registered Public Accounting Firm
To the Shareholders and the Board of Trustees of Washington Real Estate Investment Trust
Opinion on the Financial Statements
We have audited the accompanying consolidated balance sheets of Washington Real Estate Investment Trust and Subsidiaries (the Company) as of December 31, 2020 and 2019, the related consolidated statements of operations, comprehensive (loss) income, equity and cash flows for each of the three years in the period ended December 31, 2020, and the related notes and financial statement schedules listed in the Index at Item 15(a) (collectively referred to as the “consolidated financial statements”). In our opinion, the consolidated financial statements present fairly, in all material respects, the financial position of the Company at December 31, 2020 and 2019, and the results of its operations and its cash flows for each of the three years in the period ended December 31, 2020, in conformity with U.S. generally accepted accounting principles.
We also have audited, in accordance with the standards of the Public Company Accounting Oversight Board (United States) (PCAOB), the Company's internal control over financial reporting as of December 31, 2020, based on criteria established in Internal Control-Integrated Framework issued by the Committee of Sponsoring Organizations of the Treadway Commission (2013 framework) and our report dated February 16, 2021 expressed an unqualified opinion thereon.
Basis for Opinion
These financial statements are the responsibility of the Company’s management. Our responsibility is to express an opinion on the Company’s financial statements based on our audits. We are a public accounting firm registered with the PCAOB and are required to be independent with respect to the Company in accordance with the U.S. federal securities laws and the applicable rules and regulations of the Securities and Exchange Commission and the PCAOB.
We conducted our audits in accordance with the standards of the PCAOB. Those standards require that we plan and perform the audit to obtain reasonable assurance about whether the financial statements are free of material misstatement, whether due to error or fraud. Our audits included performing procedures to assess the risks of material misstatement of the financial statements, whether due to error or fraud, and performing procedures that respond to those risks. Such procedures included examining, on a test basis, evidence regarding the amounts and disclosures in the financial statements. Our audits also included evaluating the accounting principles used and significant estimates made by management, as well as evaluating the overall presentation of the financial statements. We believe that our audits provide a reasonable basis for our opinion.
Critical Audit Matter
The critical audit matter communicated below is a matter arising from the current period audit of the financial statements that was communicated or required to be communicated to the audit committee and that: (1) relates to accounts or disclosures that are material to the financial statements and (2) involved our especially challenging, subjective, or complex judgments. The communication of the critical audit matter does not alter in any way our opinion on the consolidated financial statements, taken as a whole, and we are not, by communicating the critical audit matter below providing a separate opinion on the critical audit matter or on the accounts or disclosures to which it relates.
| | | | | |
| Impairment Assessment of Income Producing Properties
|
Description of the Matter | The Company had net income producing property of $2.2 billion as of December 31, 2020. As discussed in Note 2 to the consolidated financial statements, real estate is evaluated for recoverability based on estimated cash flows if there are indicators of potential impairment.
Auditing the Company's impairment analysis involved a high degree of subjectivity due to the uncertainty around the Company’s estimated cash flows used in the impairment assessment. Estimated future cash flows are based on assumptions, including the projected annual and residual cash flows and the estimated holding period for individual properties, that are forward looking and could be affected by future economic and market conditions.
|
| | | | | |
How We Addressed the Matter in Our Audit | We obtained an understanding, evaluated the design and tested the operating effectiveness of controls over the Company’s process for assessing impairment of income producing properties. For example, we tested controls over management’s review of properties’ expected future cash flows, which is used to evaluate qualitative and quantitative indicators of impairment and in the recoverability evaluation, and we tested management’s review of the sensitivity of assumptions used in their impairment assessment.
Our testing of the Company’s impairment assessment included, among other procedures, evaluating the significant assumptions and testing the completeness and accuracy of the underlying data used by the Company to develop its estimated future cash flows for individual income producing properties. We held discussions with management about the current status of potential transactions and about management’s judgments to understand the probability of future events that could affect the holding period and other cash flow assumptions for the properties. We searched for and evaluated information that corroborates or contradicts the Company’s assumptions. We also compared the significant assumptions to current industry, market and economic trends and to the historical results of the properties. |
/s/ Ernst & Young LLP
We have served as the Company’s auditor since 2002.
Tysons, Virginia
February 16, 2021
Report of Independent Registered Public Accounting Firm
To the Shareholders and the Board of Trustees of Washington Real Estate Investment Trust
Opinion on Internal Control Over Financial Reporting
We have audited Washington Real Estate Investment Trust and Subsidiaries’ internal control over financial reporting as of December 31, 2020, based on criteria established in Internal Control—Integrated Framework issued by the Committee of Sponsoring Organizations of the Treadway Commission (2013 framework) (the COSO criteria). In our opinion, Washington Real Estate Investment Trust and Subsidiaries (the Company) maintained, in all material respects, effective internal control over financial reporting as of December 31, 2020, based on the COSO criteria.
We also have audited, in accordance with the standards of the Public Company Accounting Oversight Board (United States) (PCAOB), the 2020 consolidated financial statements of the Company and our report dated February 16, 2021 expressed an unqualified opinion thereon.
Basis for Opinion
The Company’s management is responsible for maintaining effective internal control over financial reporting and for its assessment of the effectiveness of internal control over financial reporting included in the accompanying Management’s Report on Internal Control Over Financial Reporting. Our responsibility is to express an opinion on the Company’s internal control over financial reporting based on our audit. We are a public accounting firm registered with the PCAOB and are required to be independent with respect to the Company in accordance with the U.S. federal securities laws and the applicable rules and regulations of the Securities and Exchange Commission and the PCAOB.
We conducted our audit in accordance with the standards of the PCAOB. Those standards require that we plan and perform the audit to obtain reasonable assurance about whether effective internal control over financial reporting was maintained in all material respects.
Our audit included obtaining an understanding of internal control over financial reporting, assessing the risk that a material weakness exists, testing and evaluating the design and operating effectiveness of internal control based on the assessed risk, and performing such other procedures as we considered necessary in the circumstances. We believe that our audit provides a reasonable basis for our opinion.
Definition and Limitations of Internal Control Over Financial Reporting
A company’s internal control over financial reporting is a process designed to provide reasonable assurance regarding the reliability of financial reporting and the preparation of financial statements for external purposes in accordance with generally accepted accounting principles. A company’s internal control over financial reporting includes those policies and procedures that (1) pertain to the maintenance of records that, in reasonable detail, accurately and fairly reflect the transactions and dispositions of the assets of the company; (2) provide reasonable assurance that transactions are recorded as necessary to permit preparation of financial statements in accordance with generally accepted accounting principles, and that receipts and expenditures of the company are being made only in accordance with authorizations of management and directors of the company; and (3) provide reasonable assurance regarding prevention or timely detection of unauthorized acquisition, use, or disposition of the company’s assets that could have a material effect on the financial statements.
Because of its inherent limitations, internal control over financial reporting may not prevent or detect misstatements. Also, projections of any evaluation of effectiveness to future periods are subject to the risk that controls may become inadequate because of changes in conditions, or that the degree of compliance with the policies or procedures may deteriorate.
/s/ Ernst & Young LLP
Tysons, Virginia
February 16, 2021
WASHINGTON REAL ESTATE INVESTMENT TRUST AND SUBSIDIARIES
CONSOLIDATED BALANCE SHEETS
(IN THOUSANDS, EXCEPT PER SHARE DATA)
| | | | | | | | | | | |
| December 31, |
| 2020 | | 2019 |
| Assets | | | |
| Land | $ | 551,578 | | | $ | 566,807 | |
| Income producing property | 2,432,039 | | | 2,392,415 | |
| 2,983,617 | | | 2,959,222 | |
| Accumulated depreciation and amortization | (749,014) | | | (693,610) | |
| Net income producing property | 2,234,603 | | | 2,265,612 | |
| Properties under development or held for future development | 37,615 | | | 124,193 | |
| Total real estate held for investment, net | 2,272,218 | | | 2,389,805 | |
| Investment in real estate held for sale, net | — | | | 57,028 | |
| Cash and cash equivalents | 7,700 | | | 12,939 | |
| Restricted cash | 603 | | | 1,812 | |
| Rents and other receivables | 58,257 | | | 65,259 | |
| Prepaid expenses and other assets | 71,040 | | | 95,149 | |
| Other assets related to properties sold or held for sale | — | | | 6,336 | |
| Total assets | $ | 2,409,818 | | | $ | 2,628,328 | |
| Liabilities | | | |
| Notes payable, net | $ | 945,370 | | | $ | 996,722 | |
| Mortgage notes payable, net | — | | | 47,074 | |
| Line of credit | 42,000 | | | 56,000 | |
| Accounts payable and other liabilities | 58,773 | | | 71,136 | |
| Dividend payable | 25,361 | | | 24,668 | |
| Advance rents | 7,215 | | | 9,353 | |
| Tenant security deposits | 9,990 | | | 10,595 | |
| Other liabilities related to properties sold or held for sale | — | | | 718 | |
| Total liabilities | 1,088,709 | | | 1,216,266 | |
| Equity | | | |
| Shareholders’ equity | | | |
Preferred shares; $0.01 par value; 10,000 shares authorized; no shares issued or outstanding | — | | | — | |
Shares of beneficial interest, $0.01 par value; 100,000 shares authorized; 84,409 and 82,099 shares issued and outstanding, as of December 31, 2020 and December 31, 2019, respectively | 844 | | | 821 | |
| Additional paid in capital | 1,649,366 | | | 1,592,487 | |
| Distributions in excess of net income | (298,860) | | | (183,405) | |
| Accumulated other comprehensive (loss) income | (30,563) | | | 1,823 | |
| Total shareholders’ equity | 1,320,787 | | | 1,411,726 | |
| Noncontrolling interests in subsidiaries | 322 | | | 336 | |
| Total equity | 1,321,109 | | | 1,412,062 | |
| Total liabilities and equity | $ | 2,409,818 | | | $ | 2,628,328 | |
See accompanying notes to the consolidated financial statements.
WASHINGTON REAL ESTATE INVESTMENT TRUST AND SUBSIDIARIES
CONSOLIDATED STATEMENTS OF OPERATIONS
(IN THOUSANDS, EXCEPT PER SHARE DATA)
| | | | | | | | | | | | | | | | | |
| Year Ended December 31, |
| 2020 | | 2019 | | 2018 |
| Revenue | | | | | |
Real estate rental revenue | $ | 294,118 | | | $ | 309,180 | | | $ | 291,730 | |
| Expenses | | | | | |
Real estate expenses | 112,909 | | | 115,580 | | | 105,592 | |
Depreciation and amortization | 120,030 | | | 136,253 | | | 111,826 | |
| | | | | |
| Real estate impairment | — | | | 8,374 | | | 1,886 | |
General and administrative expenses | 23,951 | | | 26,068 | | | 22,089 | |
| | | | | |
| 256,890 | | | 286,275 | | | 241,393 | |
| Other operating income | | | | | |
| (Loss) gain on sale of real estate | (15,009) | | | 59,961 | | | 2,495 | |
| Real estate operating income | 22,219 | | | 82,866 | | | 52,832 | |
| Other income (expense) | | | | | |
Interest expense | (37,305) | | | (53,734) | | | (50,501) | |
| Loss on interest rate derivatives | (560) | | | — | | | — | |
| Loss on extinguishment of debt | (34) | | | — | | | (1,178) | |
| | | | | |
| (37,899) | | | (53,734) | | | (51,679) | |
| (Loss) income from continuing operations | (15,680) | | | 29,132 | | | 1,153 | |
| Discontinued operations: | | | | | |
Income from operations of properties sold or held for sale | — | | | 16,158 | | | 24,477 | |
Gain on sale of real estate | — | | | 339,024 | | | — | |
Loss on extinguishment of debt | — | | | (764) | | | — | |
Income from discontinued operations | — | | | 354,418 | | | 24,477 | |
| Net (loss) income | $ | (15,680) | | | $ | 383,550 | | | $ | 25,630 | |
| | | | | |
| | | | | |
| Basic net (loss) income per share | | | | | |
Continuing operations | $ | (0.20) | | | $ | 0.36 | | | $ | 0.01 | |
Discontinued operations, including gain on sale of real estate | — | | | 4.39 | | | 0.31 | |
| Net (loss) income per share | $ | (0.20) | | | $ | 4.75 | | | $ | 0.32 | |
| Diluted net (loss) income per share | | | | | |
Continuing operations | $ | (0.20) | | | $ | 0.36 | | | $ | 0.01 | |
Discontinued operations, including gain on sale of real estate | — | | | 4.39 | | | 0.31 | |
| Net (loss) income per share | $ | (0.20) | | | $ | 4.75 | | | $ | 0.32 | |
| Weighted average shares outstanding – basic | 82,348 | | | 80,257 | | | 78,960 | |
| Weighted average shares outstanding – diluted | 82,348 | | | 80,335 | | | 79,042 | |
| | | | | |
See accompanying notes to the consolidated financial statements.
WASHINGTON REAL ESTATE INVESTMENT TRUST AND SUBSIDIARIES
CONSOLIDATED STATEMENTS OF COMPREHENSIVE (LOSS) INCOME
(IN THOUSANDS)
| | | | | | | | | | | | | | | | | |
| | Year Ended December 31, |
| | 2020 | | 2019 | | 2018 |
| Net (loss) income | $ | (15,680) | | | $ | 383,550 | | | $ | 25,630 | |
| Other comprehensive (loss) income: | | | | | |
| Unrealized (loss) gain on interest rate derivatives | (33,025) | | | (8,016) | | | 420 | |
| Reclassification of unrealized loss on interest rate derivatives to earnings | 639 | | | — | | | — | |
| Comprehensive (loss) income | $ | (48,066) | | | $ | 375,534 | | | $ | 26,050 | |
| | | | | |
| | | | | |
See accompanying notes to the financial statements.
WASHINGTON REAL ESTATE INVESTMENT TRUST AND SUBSIDIARIES
CONSOLIDATED STATEMENTS OF EQUITY
(IN THOUSANDS)
| | | | | | | | | | | | | | | | | | | | | | | | | | | | | | | | | | | | | | | | | | | | | | | |
| Shares | | Shares of
Beneficial
Interest at
Par Value | | Additional
Paid in
Capital | | Distributions in Excess
of Net Income | | Accumulated
Other
Comprehensive
Income (Loss) | | Total
Shareholders’
Equity | | Non- controlling
Interests in
Subsidiary | | Total
Equity |
| Balance, December 31, 2017 | 78,510 | | | $ | 785 | | | $ | 1,483,980 | | | $ | (399,213) | | | $ | 9,419 | | | $ | 1,094,971 | | | $ | 365 | | | $ | 1,095,336 | |
| Net income | — | | | — | | | — | | | 25,630 | | | — | | | 25,630 | | | — | | | 25,630 | |
| Unrealized gain on interest rate derivatives | — | | | — | | | — | | | — | | | 420 | | | 420 | | | — | | | 420 | |
| Distributions to noncontrolling interests | — | | | — | | | — | | | — | | | — | | | — | | | (14) | | | (14) | |
Dividends ($1.20 per common share) | — | | | — | | | — | | | (95,502) | | | — | | | (95,502) | | | — | | | (95,502) | |
| Equity offerings, net of issuance costs | 1,165 | | | 11 | | | 35,461 | | | — | | | — | | | 35,472 | | | — | | | 35,472 | |
| Shares issued under Dividend Reinvestment Program | 81 | | | 1 | | | 1,972 | | | — | | | — | | | 1,973 | | | — | | | 1,973 | |
| Share grants, net of forfeitures and tax withholdings | 154 | | | 2 | | | 5,161 | | | — | | | — | | | 5,163 | | | — | | | 5,163 | |
| Balance, December 31, 2018 | 79,910 | | | 799 | | | 1,526,574 | | | (469,085) | | | 9,839 | | | 1,068,127 | | | 351 | | | 1,068,478 | |
| Cumulative effect of change in accounting principle (see note 4) | — | | | — | | | — | | | (906) | | | — | | | (906) | | | — | | | (906) | |
| Net income | — | | | — | | | — | | | 383,550 | | | — | | | 383,550 | | | — | | | 383,550 | |
| Unrealized loss on interest rate derivatives | — | | | — | | | — | | | — | | | (8,016) | | | (8,016) | | | — | | | (8,016) | |
| Distributions to noncontrolling interests | — | | | — | | | — | | | — | | | — | | | — | | | (15) | | | (15) | |
Dividends ($1.20 per common share) | — | | | — | | | — | | | (96,964) | | | — | | | (96,964) | | | — | | | (96,964) | |
| Equity offerings, net of issuance costs | 1,859 | | | 18 | | | 54,898 | | | — | | | — | | | 54,916 | | | — | | | 54,916 | |
| Shares issued under Dividend Reinvestment Program | 173 | | | 2 | | | 4,753 | | | — | | | — | | | 4,755 | | | — | | | 4,755 | |
| Share grants, net of forfeitures and tax withholdings | 157 | | | 2 | | | 6,262 | | | — | | | — | | | 6,264 | | | — | | | 6,264 | |
| Balance, December 31, 2019 | 82,099 | | | 821 | | | 1,592,487 | | | (183,405) | | | 1,823 | | | 1,411,726 | | | 336 | | | 1,412,062 | |
| Net loss | — | | | — | | | — | | | (15,680) | | | — | | | (15,680) | | | — | | | (15,680) | |
| Unrealized loss on interest rate derivatives | — | | | — | | | — | | | — | | | (33,025) | | | (33,025) | | | — | | | (33,025) | |
| Loss on interest rate derivatives | — | | | — | | | — | | | — | | | 560 | | | 560 | | | — | | | 560 | |
| Amortization of swap settlements | — | | | — | | | — | | | — | | | 79 | | | 79 | | | — | | | 79 | |
| Distributions to noncontrolling interests | — | | | — | | | — | | | — | | | — | | | — | | | (14) | | | (14) | |
Dividends ($1.20 per common share) | — | | | — | | | — | | | (99,775) | | | — | | | (99,775) | | | — | | | (99,775) | |
| Equity offerings, net of issuance costs | 2,046 | | | 20 | | | 48,335 | | | — | | | — | | | 48,355 | | | — | | | 48,355 | |
| Shares issued under Dividend Reinvestment Program | 90 | | | 1 | | | 2,120 | | | — | | | — | | | 2,121 | | | — | | | 2,121 | |
| Share grants, net of forfeitures and tax withholdings | 174 | | | 2 | | | 6,424 | | | — | | | — | | | 6,426 | | | — | | | 6,426 | |
| Balance, December 31, 2020 | 84,409 | | | $ | 844 | | | $ | 1,649,366 | | | $ | (298,860) | | | $ | (30,563) | | | $ | 1,320,787 | | | $ | 322 | | | $ | 1,321,109 | |
| | | | | | | | | | | | | | | |
See accompanying notes to the consolidated financial statements.
| | | | | | | | | | | | | | | | | |
| WASHINGTON REAL ESTATE INVESTMENT TRUST AND SUBSIDIARIES |
| | | | | |
| CONSOLIDATED STATEMENTS OF CASH FLOWS |
| (IN THOUSANDS) |
| | | | | |
| Year Ended December 31, |
| 2020 | | 2019 | | 2018 |
| Cash flows from operating activities | | | | | |
| Net (loss) income | $ | (15,680) | | | $ | 383,550 | | | $ | 25,630 | |
| Adjustments to reconcile net (loss) income to net cash provided by operating activities: | | | | | |
| Depreciation and amortization | 120,030 | | | 141,179 | | | 121,228 | |
| Credit losses (gains) on lease related receivables | 5,422 | | | (10) | | | 2,136 | |
| Real estate impairment | — | | | 8,374 | | | 1,886 | |
| Loss (gain) on sale of real estate | 15,009 | | | (398,985) | | | (2,495) | |
| Share-based compensation expense | 7,874 | | | 7,743 | | | 6,746 | |
| Amortization of debt premiums, discounts and related financing costs | 2,794 | | | 3,195 | | | 2,101 | |
| Loss on interest rate derivatives | 560 | | | — | | | — | |
| Loss on extinguishment of debt | 34 | | | 764 | | | 1,178 | |
| Changes in other assets | (7,258) | | | (10,086) | | | (8,674) | |
| Changes in other liabilities | (15,794) | | | (4,801) | | | (2,367) | |
| Net cash provided by operating activities | 112,991 | | | 130,923 | | | 147,369 | |
| Cash flows from investing activities | | | | | |
| Real estate acquisitions, net | — | | | (528,589) | | | (106,400) | |
| Net cash received from sale of real estate | 152,889 | | | 706,064 | | | 174,297 | |
| Capital improvements to real estate | (58,095) | | | (68,456) | | | (71,070) | |
| Development in progress | (28,812) | | | (47,492) | | | (34,806) | |
| Non-real estate capital improvements | (222) | | | (491) | | | (963) | |
| | | | | |
| | | | | |
| Net cash provided by (used in) investing activities | 65,760 | | | 61,036 | | | (38,942) | |
| Cash flows from financing activities | | | | | |
| Line of credit (repayments) borrowings, net | (14,000) | | | (132,000) | | | 22,000 | |
| Dividends paid | (99,080) | | | (96,361) | | | (95,059) | |
| Principal payments – mortgage notes payable | (46,567) | | | (12,724) | | | (170,081) | |
| Proceeds from notes payable | 350,000 | | | — | | | — | |
| Repayments of notes payable | (250,000) | | | — | | | — | |
| Repayments of unsecured term loan debt | (300,000) | | | (450,000) | | | (150,000) | |
| Proceeds from term loan | 150,000 | | | 450,000 | | | 250,000 | |
| Settlement of interest rate derivatives | (20,948) | | | — | | | — | |
| Payment of financing costs | (3,284) | | | (1,303) | | | (5,650) | |
| Distributions to noncontrolling interests | (14) | | | (15) | | | (14) | |
| Proceeds from dividend reinvestment program | 2,121 | | | 4,755 | | | 1,973 | |
| Net proceeds from equity issuances | 48,355 | | | 54,916 | | | 35,472 | |
| Payment of tax withholdings for restricted share awards | (1,782) | | | (2,116) | | | (2,051) | |
| | | | | |
| | | | | |
| | | | | |
| Net cash used in financing activities | (185,199) | | | (184,848) | | | (113,410) | |
| Net (decrease) increase in cash, cash equivalents and restricted cash | (6,448) | | | 7,111 | | | (4,983) | |
| Cash, cash equivalents and restricted cash at beginning of year | 14,751 | | | 7,640 | | | 12,623 | |
| Cash, cash equivalents and restricted cash at end of year | $ | 8,303 | | | $ | 14,751 | | | $ | 7,640 | |
| | | | | |
| | | | | | | | | | | | | | | | | |
| WASHINGTON REAL ESTATE INVESTMENT TRUST AND SUBSIDIARIES |
| | | | | |
| CONSOLIDATED STATEMENTS OF CASH FLOWS |
| (IN THOUSANDS) |
| | | | | |
| Year Ended December 31, |
| 2020 | | 2019 | | 2018 |
| Supplemental disclosure of cash flow information: | | | | | |
| Cash paid for interest, net of capitalized interest expense | $ | 37,542 | | | $ | 50,999 | | | $ | 49,058 | |
| | | | | |
| Change in accrued capital improvements and development costs | (5,850) | | | 7,908 | | | (2,769) | |
| Dividend payable | 25,361 | | | 24,668 | | | 24,022 | |
| | | | | |
| | | | | |
| | | | | |
| Reconciliation of cash, cash equivalents and restricted cash: | | | | | |
| Cash and cash equivalents | $ | 7,700 | | | $ | 12,939 | | | $ | 6,016 | |
| Restricted cash | 603 | | | 1,812 | | | 1,624 | |
| Cash, cash equivalents and restricted cash | $ | 8,303 | | | $ | 14,751 | | | $ | 7,640 | |
See accompanying notes to the consolidated financial statements.
WASHINGTON REAL ESTATE INVESTMENT TRUST AND SUBSIDIARIES
NOTES TO CONSOLIDATED FINANCIAL STATEMENTS
FOR THE YEARS ENDED DECEMBER 31, 2020, 2019 AND 2018
NOTE 1: NATURE OF BUSINESS
Washington Real Estate Investment Trust (“WashREIT”), a Maryland real estate investment trust, is a self-administered equity real estate investment trust, successor to a trust organized in 1960. Our business consists of the ownership and operation of income-producing real estate properties in the greater Washington metro region. We own a portfolio of multifamily and commercial properties.
U.S. Federal Income Taxes
We believe that we qualify as a REIT under Sections 856-860 of the Internal Revenue Code of 1986, as amended (the "Code"), and intend to continue to qualify as such. To maintain our status as a REIT, we are, among other things, required to distribute 90% of our REIT taxable income (which is generally our ordinary taxable income, with certain modifications), excluding any net capital gains and any deductions for dividends paid to our shareholders on an annual basis. When selling a property, we generally have the option of (a) reinvesting the sales proceeds of property sold in a way that allows us to defer recognition of some or all taxable gain realized on the sale, (b) distributing gains to the shareholders with no tax to us or (c) treating net long-term capital gains as having been distributed to our shareholders, paying the tax on the gain deemed distributed and allocating the tax paid as a credit to our shareholders. During the three years ended December 31, 2020, we sold our interests in the following properties (in thousands):
| | | | | | | | | | | |
| Disposition Date | Property | Type | (Loss) Gain on Sale |
| April 21, 2020 | John Marshall II | Office | $ | (6,855) | |
| December 2, 2020 | Monument II | Office | $ | (8,595) | |
| December 17, 2020 | 1227 25th Street | Office | 1,125 | |
| | Total 2020 | $ | (14,325) | |
| | | |
| June 26, 2019 | Quantico Corporate Center (1) | Office | $ | (1,046) | |
| July 23, 2019 | Shopping Center Portfolio (2) | Retail | 333,023 | |
| August 21, 2019 | Frederick Crossing and Frederick County Square | Retail | 9,507 | |
| August 27, 2019 | Centre at Hagerstown | Retail | (3,506) | |
| December 19, 2019 | 1776 G Street | Office | 61,007 | |
| | Total 2019 | $ | 398,985 | |
| | | |
| January 19, 2018 | Braddock Metro Center | Office | $ | — | |
| June 28, 2018 | 2445 M Street | Office | 2,495 | |
| | Total 2018 | $ | 2,495 | |
| | | |
______________________________
(1) Consists of 925 and 1000 Corporate Drive.
(2) Consists of five retail properties: Gateway Overlook, Wheaton Park, Olney Village Center, Bradlee Shopping Center and Shoppes of Foxchase.
Seven of the eight retail properties sold during 2019 were identified for deferred exchanges under Section 1031 of the Code (see note 3). We acquired eight multifamily replacement properties (see note 3) during 2019. The taxable gains for 1776 G Street and a portion of the Shopping Center Portfolio proceeds not reinvested in the deferred exchange were distributed to shareholders through quarterly dividends in 2019.
Generally, and subject to our ongoing qualification as a REIT, no provisions for income taxes are necessary except for taxes on undistributed taxable income and taxes on the income generated by our taxable REIT subsidiaries (“TRSs”). Our TRSs are subject to corporate federal and state income tax on their taxable income at regular statutory rates. As of both December 31, 2020 and 2019, our TRSs had a deferred tax asset of $1.4 million that was fully reserved. As of December 31, 2019, we had deferred state and local tax liabilities of $0.6 million. These deferred tax liabilities were primarily related to temporary differences in the timing of the recognition of revenue, amortization and depreciation. We did not have deferred state or local
tax liabilities as of December 31, 2020.
Beginning in 2018, ordinary taxable income per share is equal to the Section 199A dividend that was created by the Tax Cuts and Jobs Act. The following is a breakdown of the taxable percentage of our dividends for the three years ended December 31, 2020, 2019 and 2018 (unaudited):
| | | | | | | | | | | | | | | | | |
| 2020 | | 2019 | | 2018 |
| Ordinary income/Section 199A dividends | 36 | % | | 80 | % | | 29 | % |
| Return of capital | 64 | % | | 20 | % | | 71 | % |
| Qualified dividends | — | % | | — | % | | — | % |
| Unrecaptured Section 1250 gain | — | % | | — | % | | — | % |
| Capital gain | — | % | | — | % | | — | % |
NOTE 2: SUMMARY OF SIGNIFICANT ACCOUNTING POLICIES AND BASIS OF PRESENTATION
Principles of Consolidation and Basis of Presentation
The accompanying audited consolidated financial statements include the consolidated accounts of WashREIT and our subsidiaries and entities in which WashREIT has a controlling financial interest. All intercompany balances and transactions have been eliminated in consolidation.
We have prepared the accompanying audited consolidated financial statements pursuant to the rules and regulations of the Securities and Exchange Commission.
Use of Estimates in the Financial Statements
The preparation of financial statements in conformity with Generally Accepted Accounting Principles ("GAAP") requires management to make certain estimates and assumptions that affect the reported amounts of assets and liabilities and disclosure of contingent assets and liabilities at the date of the financial statements and the reported amounts of revenues and expenses during the reporting period. Actual results could differ from those estimates.
Recent Accounting Standards
Standards Adopted
| | | | | | | | |
| Standard/Description | Effective Date and Adoption Considerations | Effect on Financial Statements or Other significant Matters |
ASU 2016-13, Measurement of Credit Losses on Financial Instruments. This standard requires financial assets measured at an amortized cost basis, including trade receivables, to be presented at the net amount expected to be collected. This standard does not apply to receivables arising from operating leases accounted for in accordance with Topic 842. | We adopted the new standard as of January 1, 2020. | The adoption of the new standard did not have a material impact on our consolidated financial statements. |
ASU 2018-15, Intangibles - Goodwill and Other - Internal-Use Software. This standard requires a customer in a cloud computing arrangement that is a service contract to follow the internal-use software guidance to determine which implementation costs to capitalize as assets. | We adopted the new standard as of January 1, 2020. | The adoption of the new standard did not have a material impact on our consolidated financial statements. |
| | | | | | | | |
| Standard/Description | Effective Date and Adoption Considerations | Effect on Financial Statements or Other significant Matters |
ASU 2020-04, Reference Rate Reform - Facilitation of the Effects of Reference Rate Reform on Financial Reporting. This standard contains optional practical expedients and exceptions for applying Generally Accepted Accounting Principles (“GAAP”) to contracts, hedging relations, and other transactions affected by reference rate reform if certain criteria are met. | We elected certain optional practical expedients as of January 1, 2020. | The guidance in ASU 2020-04 is optional and may be elected over time as reference rate reform activities occur. As of January 1, 2020, we have elected to apply the hedge accounting expedients related to probability and the assessments of effectiveness for future LIBOR-indexed cash flows to assume that the index upon which future hedged transactions will be based matches the index on the corresponding derivatives. Application of these expedients preserves the presentation of derivatives consistent with past presentation. We continue to evaluate the impact of the guidance and may apply other elections as applicable as additional changes in the market occur. |
| | |
| | |
| | |
| | |
| | |
COVID-19 Lease Modification Accounting Relief
In April 2020, the Financial Accounting Standards Board (“FASB”) staff issued a question-and-answer document (“Q&A”) that addresses their belief that the guidance on lease modifications in GAAP does not contemplate concessions being executed as rapidly as they were executed as a result of the major financial crisis arising from the COVID-19 pandemic. Under ASC 842, Leases, we evaluate, on a lease by lease basis, if a lease concession is the result of a new arrangement reached with the tenant, which could result in lease modification accounting, or if a lease concession is contemplated in the existing lease agreement, which is precluded from lease modification accounting. In the Q&A, the staff stated that entities may elect to not evaluate whether a concession provided by a lessor to a lessee in response to the COVID-19 pandemic is a lease modification. This election must be applied consistently to leases with similar characteristics and circumstances. The election permits entities, if certain criteria are met, to account for concessions as if they were contemplated in the existing contract or evaluate the lease concessions for lease modification accounting. If elected, abatement concessions are accounted for as negative variable rental revenue and rent deferrals are accounted for as if the lease is unchanged. We have elected to utilize the relief provided by the FASB staff. This election did not have a material impact on our consolidated financial statements as of December 31, 2020, and we do not expect material impacts in future periods.
Revenue Recognition
We lease multifamily properties under operating leases with terms of generally one year or less. We lease commercial properties under operating leases with an average term of seven years. Substantially all commercial leases contain fixed escalations or, in some instances, changes based on the Consumer Price Index, which occur at specified times during the term of the lease. In certain commercial leases, variable lease income, such as percentage rent, is recognized when rents are earned. We recognize rental income and rental abatements from our multifamily and commercial leases on a straight-line basis over the lease term. Recognition of rental income commences when control of the leased space has been transferred to the tenant.
We recognize gains on sales of real estate when we have executed a contract for sale of the asset, transferred controlling financial interest in the asset to the buyer and determined that it is probable that we will collect substantially all of the consideration for the asset. Our real estate sale transactions typically meet these criteria at closing.
We recognize cost reimbursement income from pass-through expenses on an accrual basis over the periods in which the expenses were incurred. Pass-through expenses are comprised of real estate taxes, operating expenses and common area maintenance costs which are reimbursed by tenants in accordance with specific allowable costs per tenant lease agreements.
Parking revenues are derived from leases, monthly parking agreements and transient parking. We recognize parking revenues from leases on a straight-line basis over the lease term and monthly parking revenues as earned. We recognize transient parking revenue when our performance obligation is met.
Rents and Other Receivables
Lease related receivables, which include contractual amounts accrued and unpaid from tenants and accrued straight-line rents receivable, are reduced for credit losses. Such amounts are recognized as a reduction to real estate rental revenues. We evaluate the collectability of lease receivables monthly using several factors including a lessee’s creditworthiness. We recognize the credit loss on lease related receivables when, in the opinion of management, collection of substantially all lease payments is not probable. When collectability is determined not probable, any lease income recognized subsequent to recognizing the credit loss is limited to the lesser of the lease income reflected on a straight-line basis or cash collected. The adoption of ASU 2016-02
resulted in an adjustment to our opening distributions in excess of net income balance of $0.9 million, associated with lease related receivables where collection of substantially all operating lease payments was not probable as of January 1, 2019.
Debt Issuance Costs
We amortize external debt issuance costs using the effective interest rate method or the straight-line method, which approximates the effective interest rate method over the estimated life of the related debt. We record debt issuance costs related to notes and mortgage notes, net of amortization, on our consolidated balance sheets as an offset to their related debt. We record debt issuance costs related to revolving lines of credit on our consolidated balance sheets with Prepaid expenses and other assets, regardless of whether a balance on the line of credit is outstanding. We record the amortization of all debt issuance costs as interest expense.
Deferred Leasing Costs
We capitalize and amortize direct and incremental costs associated with the successful negotiation of leases, both external commissions and internal direct costs, on a straight-line basis over the terms of the respective leases. We record the amortization of deferred leasing costs in Depreciation and amortization on the consolidated statements of operations. If an applicable lease terminates prior to the expiration of its initial lease term, we write off the carrying amount of the costs to amortization expense.
We capitalize and amortize leasing incentives associated with the successful negotiation of leases on a straight-line basis against revenue over the terms of the respective leases. We record the amortization of deferred leasing incentives as a reduction in revenue. If an applicable lease terminates prior to the expiration of its initial lease term, we write off the carrying amount of the costs as a reduction in revenue.
Real Estate and Depreciation
We depreciate buildings on a straight-line basis over estimated useful lives ranging from 28 to 50 years. We capitalize all capital improvements associated with replacements, improvements or major repairs to real property that extend its useful life and depreciate them using the straight-line method over their estimated useful lives ranging from 3 to 40 years. We also capitalize costs incurred in connection with our development projects, including interest incurred on borrowing obligations and other internal costs during periods in which qualifying expenditures have been made and activities necessary to get the development projects ready for their intended use are in progress. Capitalization of these costs begins when the activities and related expenditures commence and ceases when the project is substantially complete and ready for its intended use, at which time the project is placed into service and depreciation commences. In addition, we capitalize tenant leasehold improvements when certain criteria are met, including when we supervise construction and will own the improvements. We depreciate all tenant improvements over the shorter of the useful life of the improvements or the term of the related tenant lease.
Real estate depreciation expense from continuing operations was $103.4 million, $101.7 million and $82.9 million during the years ended December 31, 2020, 2019 and 2018, respectively.
We charge maintenance and repair costs that do not extend an asset’s useful life to expense as incurred.
Interest expense from continuing operations and interest capitalized to real estate assets related to development and major renovation activities for the three years ended December 31, 2020 were as follows (in thousands):
| | | | | | | | | | | | | | | | | |
| Year Ended December 31, |
| 2020 | | 2019 | | 2018 |
| Total interest incurred | $ | 39,524 | | | $ | 56,948 | | | $ | 52,592 | |
| Capitalized interest | (2,219) | | | (3,214) | | | (2,091) | |
| Interest expense, net of capitalized interest | $ | 37,305 | | | $ | 53,734 | | | $ | 50,501 | |
We recognize impairment losses on long-lived assets used in operations, development assets or land held for future development if indicators of impairment are present and the net undiscounted cash flows estimated to be generated by those assets are less than the assets' carrying amount. Estimates of undiscounted cash flows are based on forward-looking assumptions, including annual and residual cash flows and our estimated holding period for each property. Such assumptions involve a high degree of judgment and could be affected by future economic and market conditions. When determining if a property has indicators of impairment, we evaluate the property's occupancy, our expected holding period for the property,
strategic decisions regarding the property's future operations or development and other market factors. If such carrying amount is in excess of the estimated undiscounted cash flows from the operation and disposal of the property, we would recognize an impairment loss equivalent to an amount required to adjust the carrying amount to its estimated fair value, calculated in accordance with current GAAP fair value provisions. Assets held for sale are recorded at the lower of cost or fair value less costs to sell.
Acquisitions
The properties we acquire typically are not businesses as defined by ASU 2017-01, Business Combinations (Topic 805) - Clarifying the Definition of a Business. Per this definition, a set of transferred assets and activities is not a business when substantially all of the fair value of the gross assets acquired is concentrated in a single identifiable asset or group of similar identifiable assets. We therefore account for such acquisitions as asset acquisitions. Acquisition costs are capitalized and identifiable assets (including physical assets and in-place leases), liabilities assumed and any noncontrolling interests are measured by allocating the cost of the acquisition on a relative fair value basis. Acquisitions executed prior to our adoption of ASU 2017-01 as of January 1, 2017 were accounted for as business combinations.
We determine the fair values of acquired buildings on an “as-if-vacant” basis considering a variety of factors, including the replacement cost of the property, estimated rental and absorption rates, estimated future cash flows and valuation assumptions consistent with current market conditions. We determine the fair value of land acquired based on comparisons to similar properties that have been recently marketed for sale or sold.
The fair value of in-place leases consists of the following components – (a) the estimated cost to replace the leases, including foregone rents during the period of finding a new tenant and foregone recovery of tenant pass-throughs (referred to as “absorption cost”); (b) the estimated cost of tenant improvements and other direct costs associated with obtaining a new tenant (referred to as “tenant origination cost”); (c) estimated leasing commissions associated with obtaining a new tenant (referred to as “leasing commissions”); (d) the above/at/below market cash flow of the leases, determined by comparing the projected cash flows of the leases in place, including consideration of renewal options, to projected cash flows of comparable market-rate leases (referred to as “net lease intangible”); and (e) the value, if any, of customer relationships, determined based on our evaluation of the specific characteristics of each tenant’s lease and our overall relationship with the tenant (referred to as “customer relationship value”). We have attributed no value to customer relationships as of December 31, 2020 and 2019.
We discount the amounts used to calculate net lease intangibles using an interest rate which reflects the risks associated with the leases acquired. We classify tenant origination costs as income producing property on our consolidated balance sheets and amortize the tenant origination costs as depreciation expense on a straight-line basis over the remaining life of the underlying leases. We classify leasing commissions and absorption costs as other assets and amortize leasing commissions and absorption costs as amortization expense on a straight-line basis over the remaining life of the underlying leases. We classify net lease intangible assets as other assets and amortize them on a straight-line basis as a decrease to real estate rental revenue over the remaining term of the underlying leases. We classify net lease intangible liabilities as other liabilities and amortize them on a straight-line basis as an increase to real estate rental revenue over the remaining term of the underlying leases. If any of the fair value of below market lease intangibles includes fair value associated with a renewal option, such amounts are not amortized until the renewal option is executed, else the related value is expensed at that time. Should a tenant terminate its lease prior to the expiration date, we accelerate the amortization of the unamortized portion of the tenant origination cost, leasing commissions, absorption costs and net lease intangible associated with that lease, over its new, shorter term.
Software Developed for Internal Use
The costs of software developed for internal use that qualify for capitalization are included with Prepaid expenses and other assets on our consolidated balance sheets. These capitalized costs include external direct costs utilized in developing or obtaining the applications and expenses for employees who are directly associated with the development of the applications. Capitalization of such costs begins when the preliminary project stage is complete and continues until the project is substantially complete and is ready for its intended purpose. Completed projects are amortized on a straight-line basis over their estimated useful lives.
Held for Sale and Discontinued Operations
We classify properties as held for sale when they meet the necessary criteria, which include: (a) senior management commits to a plan to sell the assets; (b) the assets are available for immediate sale in their present condition subject only to terms that are usual and customary for sales of such assets; (c) an active program to locate a buyer and other actions required to complete the plan to sell the assets has been initiated; (d) the sale of the assets is probable and transfer of the assets is expected to qualify for
recognition as a completed sale within one year; (e) the assets are being actively marketed for sale at a price that is reasonable in relation to its current fair value; and (f) actions required to complete the plan indicate that it is unlikely that significant changes to the plan will be made or that the plan will be withdrawn. Depreciation on these properties is discontinued at the time they are classified as held for sale, but operating revenues, operating expenses and interest expense continue to be recognized until the date of sale.
Revenues and expenses of properties that are either sold or classified as held for sale are presented as discontinued operations for all periods presented in the consolidated statements of operations if the dispositions represent a strategic shift that has (or will have) a major effect on our operations and financial results. Interest on debt that can be identified as specifically attributed to these properties is included in discontinued operations. If the dispositions do not represent a strategic shift that has (or will have) a major effect on our operations and financial results, then the revenues and expenses of the properties that are classified as sold or held for sale are presented as continuing operations in the consolidated statements of operations for all periods presented.
Segments
We evaluate performance based upon net operating income from the combined properties in each segment. Our reportable operating segments are consolidations of similar properties. GAAP requires that segment disclosures present the measure(s) used by the chief operating decision maker for purposes of assessing segments’ performance. Net operating income is a key measurement of our segment profit and loss. Net operating income is defined as segment real estate rental revenue less segment real estate expenses.
Cash and Cash Equivalents
Cash and cash equivalents include cash and commercial paper with original maturities of 90 days or less. We maintain cash deposits with financial institutions that at times exceed applicable insurance limits. We reduce this risk by maintaining such deposits with high quality financial institutions that management believes are credit-worthy.
Restricted Cash
Restricted cash includes funds escrowed for tenant security deposits, real estate tax, insurance and mortgage escrows and escrow deposits required by lenders on certain of our properties to be used for future building renovations or tenant improvements.
Earnings Per Common Share
We determine “Basic earnings per share” using the two-class method as our unvested restricted share awards and units have non-forfeitable rights to dividends, and are therefore considered participating securities. We compute basic earnings per share by dividing net income less the allocation of undistributed earnings to unvested restricted share awards and units by the weighted-average number of common shares outstanding for the period.
We also determine “Diluted earnings per share” under the two-class method with respect to the unvested restricted share awards. We further evaluate any other potentially dilutive securities at the end of the period and adjust the basic earnings per share calculation for the impact of those securities that are dilutive. Our dilutive earnings per share calculation includes the dilutive impact of operating partnership units under the if-converted method and our share based awards with performance conditions prior to the grant date and all market condition awards under the contingently issuable method.
Stock Based Compensation
We currently maintain equity based compensation plans for trustees, officers and employees.
We recognize compensation expense for service-based share awards ratably over the period from the service inception date through the vesting period based on the fair market value of the shares on the date of grant. We account for forfeitures as they occur. If an award's service inception date precedes the grant date, we initially measure compensation expense for awards with performance conditions at fair value at the service inception date based on probability of payout, and we remeasure compensation expense at subsequent reporting dates until all of the award’s key terms and conditions are known and the grant date is established. We amortize awards with performance conditions using the graded expense method. We measure compensation expense for awards with market conditions based on the grant date fair value, as determined using a Monte Carlo simulation, and we amortize the expense ratably over the requisite service period, regardless of whether the market conditions
are achieved and the awards ultimately vest. Compensation expense for the trustee grants, which fully vest immediately, is fully recognized upon issuance based upon the fair market value of the shares on the date of grant.
Accounting for Uncertainty in Income Taxes
We can recognize a tax benefit only if it is “more likely than not” that a particular tax position will be sustained upon examination or audit. To the extent that the “more likely than not” standard has been satisfied, the benefit associated with a tax position is measured as the largest amount that is greater than 50% likely of being recognized upon settlement. As of December 31, 2020 and 2019, we did not have any unrecognized tax benefits. We do not believe that there will be any material changes to our uncertain tax positions over the next twelve months.
We are subject to federal income tax as well as income tax of the states of Maryland and Virginia, and the District of Columbia. However, as a REIT, we generally are not subject to income tax on our taxable income to the extent it is distributed as dividends to our shareholders.
Tax returns filed for 2017 through 2019 tax years are subject to examination by taxing authorities. We classify interest and penalties related to uncertain tax positions, if any, in our financial statements as a component of general and administrative expenses.
Derivatives
We borrow funds at a combination of fixed and variable rates. Borrowings under our revolving credit facility and term loans bear interest at variable rates. Our interest rate risk management objectives are to minimize interest rate fluctuation on long-term indebtedness and limit the impact of interest rate changes on earnings and cash flows. To achieve these objectives, from time to time, we may enter into interest rate hedge contracts such as collars, swaps, caps and treasury lock agreements in order to mitigate our interest rate risk with respect to various debt instruments. We generally do not hold or issue these derivative contracts for trading or speculative purposes. The interest rate swaps we enter into are recorded at fair value on a recurring basis. We assess the effectiveness of our cash flow hedges both at inception and on an ongoing basis. The effective portion of changes in fair value of the interest rate swaps associated with our cash flow hedges is recorded in Accumulated other comprehensive income (loss). Our cash flow hedges become ineffective if critical terms of the hedging instrument and the debt instrument, such as notional amounts, settlement dates, reset dates, calculation period and LIBOR do not perfectly match. In addition, we evaluate the default risk of the counterparty by monitoring its creditworthiness. When ineffectiveness of a cash flow hedge exists, the ineffective portion of changes in fair value of the interest rate swaps associated with our cash flow hedges is recognized in earnings in the period affected.
NOTE 3: REAL ESTATE
As of December 31, 2020 and 2019, our real estate investment portfolio classified as income producing property that is held and used, at cost, consists of properties valued as follows (in thousands):
| | | | | | | | | | | |
| | December 31, |
| | 2020 | | 2019 |
| Multifamily | $ | 1,606,085 | | | $ | 1,469,011 | |
| Office | 1,214,481 | | | 1,329,722 | |
| Other | 163,051 | | | 160,489 | |
| $ | 2,983,617 | | | $ | 2,959,222 | |
Our results of operations are dependent on the overall economic health of our markets, tenants and the specific segments in which we own properties. All property types are affected by external economic factors, such as inflation, consumer confidence and unemployment rates, as well as changing tenant and consumer requirements.
As of December 31, 2020, no property accounted for more than approximately 10% of total assets. No single property or tenant accounted for more than 10% of real estate rental revenue.
We have properties under development/redevelopment and held for current or future development. The cost of our real estate portfolio under development or held for future development as of December 31, 2020 and 2019 is as follows (in thousands):
| | | | | | | | | | | |
| | December 31, |
| | 2020 | | 2019 |
| Multifamily | $ | 36,493 | | | $ | 123,071 | |
| Office | 478 | | | 478 | |
| Other | 644 | | | 644 | |
| $ | 37,615 | | | $ | 124,193 | |
As of December 31, 2020, we have invested $133.5 million, including the cost of acquired land, in Trove, a 401-unit multifamily development adjacent to The Wellington. During 2020, we substantially completed major construction activities for Trove's base building and garage and delivered 374 units. As of December 31, 2020, we have placed into service assets totaling $126.4 million. We expect to place the remainder of the Trove development costs into service during the first quarter of 2021. We have also invested $28.6 million, including the cost of acquired land, in a multifamily development adjacent to Riverside Apartments. In addition, in our multifamily and office segments, we continue to capitalize qualifying costs on several other projects with minor development activity necessary to ready each project for its intended use.
Acquisitions
Our current strategy is to recycle legacy assets that lack the income growth potential we seek and to invest in high-quality assets with compelling value-add returns through redevelopment opportunities in our existing portfolio and acquisitions that meet our stringent investment criteria. We focus on properties near major transportation nodes and in areas with strong employment drivers and superior growth demographics.
Properties and land for development acquired during the three years ended December 31, 2020 were as follows:
| | | | | | | | | | | | | | | | | | | | | | | | | | | | | | | | |
| Acquisition Date | | Property | | Type | | # of units (unaudited) | | Rentable
Square Feet
(unaudited) | | Contract
Purchase Price
(in thousands) |
| April 30, 2019 | | Assembly Portfolio - Virginia (1) | | Multifamily | | 1,685 | | | N/A | | $ | 379,100 | |
| June 27, 2019 | | Assembly Portfolio - Maryland (2) | | Multifamily | | 428 | | | N/A | | 82,070 | |
| July 23, 2019 | | Cascade at Landmark | | Multifamily | | 277 | | | N/A | | 69,750 | |
| | | | | | 2,390 | | | | | $ | 530,920 | |
| | | | | | | | | | |
| January 18, 2018 | | Arlington Tower | | Office | | N/A | | 391,000 | | $ | 250,000 | |
| | | | | | | | | | |
| | | | | | | | | | |
______________________________
(1) Consists of Assembly Alexandria, Assembly Manassas, Assembly Dulles, Assembly Leesburg and Assembly Herndon.
(2) Consists of Assembly Germantown and Assembly Watkins Mill. The Assembly Portfolio - Virginia and Assembly Portfolio - Maryland properties are collectively the “Assembly Portfolio.”
The purchases of the Assembly Portfolio and Cascade at Landmark were structured as exchanges under Section 1031 of the Code in a manner such that legal title was held by a 1031 exchange facilitator until certain identified properties were sold and the deferred exchanges were completed. We retained all of the legal and economic benefits and obligations related to the Assembly Portfolio and Cascade at Landmark. As such, the Assembly Portfolio and Cascade at Landmark were considered to be variable interest entities until legal title was transferred to us upon completion of the 1031 exchanges, which occurred during the third quarter of 2019. We consolidated the assets and liabilities of the Assembly Portfolio and Cascade at Landmark because we determined that WashREIT was the primary beneficiary of these properties.
The results of operations from acquired operating properties are included in the consolidated statements of operations as of their acquisition dates.
We did not have any acquisition activity for the year ended December 31, 2020. The revenue and earnings of our acquisitions during their year of acquisition for the two years ended December 31, 2019 are as follows (in thousands):
| | | | | | | | | | | | | |
| | | Year Ended December 31, |
| | | 2019 | | 2018 |
| Real estate rental revenue | | | $ | 27,641 | | | $ | 22,389 | |
| Net (loss) income | | | (10,167) | | | 3,623 | |
As discussed in note 2, we record the acquired physical assets (land, building and tenant improvements), in-place leases (absorption, tenant origination costs, leasing commissions and net lease intangible assets/liabilities) and any other assumed liabilities on a relative fair value basis.
We recorded the total cost of the above acquisitions as follows (in thousands):
| | | | | | | | | | | | | |
| | | | 2019 | | 2018 |
| Land | | | $ | 92,391 | | | $ | 63,970 | |
| | | | | |
| Buildings and improvements | | | 423,663 | | | 142,900 | |
| Tenant origination costs | | | — | | | 13,625 | |
| Leasing commissions/absorption costs | | | 15,474 | | | 27,465 | |
| Net lease intangible assets | | | — | | | 3,142 | |
| Net lease intangible liabilities | | | — | | | (545) | |
| | | | | |
| | | | | |
| | | | | |
| Total | | | $ | 531,528 | | | $ | 250,557 | |
The difference in the total cost of the 2019 acquisitions of $531.5 million and the cash paid for the acquisitions per the consolidated statements of cash flows of $528.6 million is primarily due to credits received at settlement totaling $2.9 million.
The difference in the total contract purchase price of $250.0 million for the 2018 acquisition and cash paid for the acquisition per the consolidated statements of cash flows of $106.4 million is primarily due to a mortgage note assumed and repaid at settlement ($135.5 million), an acquisition deposit made during 2017 ($6.3 million) and a net credit to the buyer for certain expenditures ($2.4 million), partially offset by capitalized acquisition related costs ($0.6 million).
Balances, net of accumulated depreciation or amortization, as appropriate, of the components of the fair value of in-place leases at December 31, 2020 and 2019 were as follows (in thousands):
| | | | | | | | | | | | | | | | | | | | | | | | | | | | | | | | | | | |
| | December 31, |
| | 2020 | | 2019 |
| | Gross Carrying Value | | Accumulated Amortization | | Net | | Gross Carrying Value | | Accumulated Amortization | | Net |
| Tenant origination costs | $ | 43,536 | | | $ | 30,096 | | | $ | 13,440 | | | $ | 50,155 | | | $ | 33,364 | | | $ | 16,791 | |
| Leasing commissions/absorption costs | 107,102 | | | 83,588 | | | 23,514 | | | 122,348 | | | 92,401 | | | 29,947 | |
| Net lease intangible assets | 11,595 | | | 9,390 | | | 2,205 | | | 15,183 | | | 11,964 | | | 3,219 | |
| Net lease intangible liabilities | 27,809 | | | 20,247 | | | 7,562 | | | 29,836 | | | 20,854 | | | 8,982 | |
| Below-market ground lease intangible asset | 12,080 | | | 2,472 | | | 9,608 | | | 12,080 | | | 2,282 | | | 9,798 | |
Amortization of these combined components during the three years ended December 31, 2020, 2019 and 2018 was as follows (in thousands):
| | | | | | | | | | | | | | | | | |
| Year Ended December 31, |
| 2020 | | 2019 | | 2018 |
| Depreciation and amortization expense | $ | 9,997 | | | $ | 27,123 | | | $ | 22,361 | |
| Real estate rental revenue increase, net | (406) | | | (924) | | | (1,225) | |
| $ | 9,591 | | | $ | 26,199 | | | $ | 21,136 | |
Amortization of these combined components over the next five years and thereafter is projected to be as follows (in thousands):
| | | | | | | | | | | | | | | | | |
| Depreciation and amortization expense | | Real estate rental revenue, net increase | | Total |
| 2021 | $ | 8,576 | | | $ | (547) | | | $ | 8,029 | |
| 2022 | 8,078 | | | (736) | | | 7,342 | |
| 2023 | 6,032 | | | (974) | | | 5,058 | |
| 2024 | 5,264 | | | (862) | | | 4,402 | |
| 2025 | 4,231 | | | (777) | | | 3,454 | |
| Thereafter | 14,380 | | | (1,460) | | | 12,920 | |
Properties Sold and Held for Sale
We intend to hold our properties for investment with a view to long-term appreciation, to engage in the business of acquiring, developing and owning our properties, and to make occasional sales of the properties that no longer meet our long-term strategy or return objectives and where market conditions for sale are favorable. The proceeds from the sales may be reinvested into other properties, used to fund development operations or to support other corporate needs or distributed to our shareholders. Depreciation on these properties is discontinued when classified as held for sale, but operating revenues, other operating expenses and interest continue to be recognized through the date of sale.
We classified as held for sale or sold our interests in the following properties during the three years ended December 31, 2020:
| | | | | | | | | | | | | | | | | | | | | | | | | | | | | | | | | | | | | | |
| Disposition Date | | Property | | Type | | # of units (unaudited) | | Rentable
Square Feet
(unaudited) | | Contract
Sale Price
(in thousands) | | (Loss) Gain on Sale
(in thousands) |
| April 21, 2020 | | John Marshall II | | Office | | N/A | | 223,000 | | | $ | 57,000 | | | $ | (6,855) | |
| December 2, 2020 | | Monument II | | Office | | N/A | | 207,000 | | | 53,000 | | | (8,595) | |
| December 17, 2020 | | 1227 25th Street | | Office | | N/A | | 135,000 | | | 53,500 | | | 1,125 | |
| | | | Total 2020 | | | | 565,000 | | | $ | 163,500 | | | $ | (14,325) | |
| | | | | | | | | | | | |
| June 26, 2019 | | Quantico Corporate Center (1) | | Office | | N/A | | 272,000 | | | $ | 33,000 | | | $ | (1,046) | |
| July 23, 2019 | | Shopping Center Portfolio (2) | | Retail | | N/A | | 800,000 | | | 485,250 | | | 333,023 | |
| August 21, 2019 | | Frederick Crossing and Frederick County Square | | Retail | | N/A | | 520,000 | | | 57,500 | | | 9,507 | |
| August 27, 2019 | | Centre at Hagerstown | | Retail | | N/A | | 330,000 | | | 23,500 | | | (3,506) | |
| December 19, 2019 | | 1776 G Street | | Office | | N/A | | 262,000 | | | 129,500 | | | 61,007 | |
| | | | Total 2019 | | | | 2,184,000 | | | $ | 728,750 | | | $ | 398,985 | |
| | | | | | | | | | | | |
| January 19, 2018 | | Braddock Metro Center | | Office | | N/A | | 356,000 | | | $ | 93,000 | | | $ | — | |
| June 28, 2018 | | 2445 M Street | | Office | | N/A | | 292,000 | | | 101,600 | | | 2,495 | |
| | | | Total 2018 | | | | 648,000 | | | $ | 194,600 | | | $ | 2,495 | |
| | | | | | | | | | | | |
______________________________
(1) Consists of 925 and 1000 Corporate Drive.
(2) Consists of five retail properties: Gateway Overlook, Wheaton Park, Olney Village Center, Bradlee Shopping Center and Shoppes of Foxchase.
We have fully transferred control of the assets associated with these disposed properties and do not have continuing involvement in the operations of these properties.
In November 2020, we executed a purchase and sale agreement to sell 1227 25th Street for a contract sale price of $53.5 million and closed on the sale on December 17, 2020, recognizing a gain on sale of real estate of $1.1 million.
In December 2020, we executed a purchase and sale agreement to sell Monument II for a contract sale price of $53.0 million and closed on the sale on December 2, 2020, recognizing a loss on sale of real estate of $8.6 million.
In December 2019, we executed a purchase and sale agreement to sell John Marshall II for a contract sale price of $63.4 million. Upon execution of the purchase and sale agreement, the property met the criteria for classification as held for sale. In April 2020, we executed an amendment to the purchase and sale agreement which decreased the contract sale price to $57.0 million and closed on the sale on April 21, 2020, recognizing a loss on sale of real estate of $6.9 million.
During the second quarter of 2019, we sold Quantico Corporate Center, an office property in Stafford, Virginia, consisting of two office buildings totaling 272,000 square feet, for a contract sale price of $33.0 million, recognizing a loss on sale of real estate of $1.0 million. Prior to the sale, due to the negotiations to sell the property, we evaluated Quantico Corporate Center for impairment and recognized an $8.4 million impairment charge during the first quarter of 2019 in order to reduce the carrying value of the property to its estimated fair value. We based this fair valuation on the expected sale price from a potential sale. There were few observable market transactions for similar properties. This fair valuation falls into Level 2 of the fair value hierarchy due to its reliance on a quoted price in a market that is not active.
In June 2019, we had entered into two separate purchase and sale agreements with two separate buyers to sell the Shopping Center Portfolio and the Power Center Portfolio (Frederick Crossing, Frederick County Square and Centre at Hagerstown). As of June 30, 2019, we received a non-refundable deposit from the potential buyer of the Shopping Center Portfolio and expected to receive a non-refundable deposit from the potential buyer of the Power Center Portfolio in July 2019, and the properties in the Retail Portfolio (as defined below) met the criteria for classification as held for sale.
We closed on the Shopping Center Portfolio sale transaction on July 23, 2019 for a contract sales price of $485.3 million, recognizing a gain on sale of real estate of $333.0 million. Prior to closing on the disposition of the Shopping Center Portfolio, we prepaid the mortgage note secured by Olney Village Center (a property in the Shopping Center Portfolio), incurring a loss on extinguishment of debt of approximately $0.8 million which we recognized in the third quarter of 2019.
In the third quarter of 2019, the purchase and sale agreement to sell the Power Center Portfolio was amended to include only Frederick Crossing and Frederick County Square. We closed on the sales of these assets on August 21, 2019 for a contract sales price of $57.5 million, recognizing a gain on sale of real estate of $9.5 million. Following the amendment to the purchase and sale agreement to sell the Power Center Portfolio, we marketed Centre at Hagerstown for sale and identified a separate buyer. We closed on the sale of this asset on August 27, 2019, recognizing a loss on sale of real estate of $3.5 million.
References to the “Retail Portfolio” include the Shopping Center Portfolio and the Power Center Portfolio. The disposition of the Retail Portfolio represents a strategic shift that had a major effect on our financial results and we have accordingly reported the Retail Portfolio as discontinued operations. The Retail Portfolio represents assets generating a majority of the revenue from our retail properties and we have determined that our retail line of business is no longer a reportable segment (see note 14).
In October 2019, we renewed and extended our lease with the World Bank at 1776 G Street NW, an office property in Washington, D.C., through December 31, 2025. In December 2019, we sold the property to the World Bank for a contract sale price of $129.5 million, recognizing a gain on sale of real estate of $61.0 million.
During the first quarter of 2018, we sold Braddock Metro Center, a 356,000 square foot office property in Alexandria, Virginia for a contract sales price of $93.0 million. Due to then-ongoing negotiations to sell the property, we evaluated Braddock Metro Center for impairment and recognized a $9.1 million impairment charge during 2017 in order to reduce the carrying value of the property to its estimated fair value, less selling costs. We based this fair valuation on the expected sale price from a potential sale. There are few observable market transactions for similar properties. This fair valuation falls into Level 2 of the fair value hierarchy due to its reliance on a quoted price in a market that is not active.
During the first quarter of 2018, we executed a purchase and sale agreement to sell 2445 M Street, a 292,000 square foot office property in Washington, D.C., for a contract sales price of $100.0 million, with settlement originally scheduled for the third quarter of 2018. During 2017, we evaluated 2445 M Street for impairment and recognized a $24.1 million impairment charge in order to reduce the carrying value of the property to its estimated fair value. Upon execution of the purchase and sale agreement, the property met the criteria for classification as held for sale. Due to the property’s classification as held for sale, we recorded an additional impairment charge of $1.9 million in the first quarter of 2018 in order to reduce the carrying value of the property to its estimated fair value, less estimated selling costs. We based this fair value on the expected sales price from a potential sale. There are few observable market transactions for similar properties. This fair valuation falls into Level 2 of the fair value hierarchy due to its reliance on a quoted price in a market that is not active. During the second quarter of 2018, we executed an amendment to the purchase and sale agreement which increased the contract sales price to $101.6 million and advanced the settlement date. On June 28, 2018, we sold 2445 M Street, recognizing a gain on sale of real estate of $2.5 million.
Discontinued Operations
The results of the Retail Portfolio are classified as discontinued operations and are summarized as follows (amounts in thousands, except for share data):
| | | | | | | | | | | | | |
| Year Ended December 31, |
| 2019 | | 2018 | | |
| Real estate rental revenue | $ | 28,200 | | | $ | 45,160 | | | |
| Real estate expenses | (6,803) | | | (10,638) | | | |
| Depreciation and amortization | (4,926) | | | (9,402) | | | |
| Interest expense | (313) | | | (643) | | | |
| Loss on extinguishment of debt | (764) | | | — | | | |
| Gain on sale of real estate | 339,024 | | | — | | | |
| Income from discontinued operations | $ | 354,418 | | | $ | 24,477 | | | |
| | | | | |
| Basic net income per share | $ | 4.39 | | | $ | 0.31 | | | |
| Diluted net income per share | $ | 4.39 | | | $ | 0.31 | | | |
| | | | | |
| Capital expenditures | $ | 809 | | | $ | 2,138 | | | |
All assets and liabilities related to the Retail Portfolio were sold as of December 31, 2019.
NOTE 4: LEASE ACCOUNTING
Leasing as a Lessor
Future Minimum Rental Income
As of December 31, 2020, non-cancelable commercial operating leases provide for future minimum rental income from continuing operations as follows (in thousands):
| | | | | | | | |
| 2021 | | $ | 122,062 | |
| 2022 | | 109,939 | |
| 2023 | | 93,467 | |
| 2024 | | 80,793 | |
| 2025 | | 63,923 | |
| Thereafter | | 215,443 | |
| | $ | 685,627 | |
Apartment leases are not included as the terms are generally for one year or less. Rental income under most of these commercial leases increase in future years based on agreed-upon percentages or in some instances, changes in the Consumer Price Index.
Leasing as a Lessee
2000 M Street, an office property in Washington, D.C., is subject to an operating ground lease with a remaining term of 50 years. Rental payments under this lease are subject to percentage rent variable payments, which are not included as part of our measurement of straight-line rental expense. We recognized straight-line rental expense of $0.3 million during each of the three years ended December 31, 2020. We recognized variable rental payments of $0.8 million, $0.9 million and $0.9 million during the years ended December 31, 2020, 2019 and 2018 respectively. We recognized a right-of-use asset (included in Income producing property) and lease liability (included in Accounts payable and other liabilities) of $4.2 million. We used a discount rate of approximately 5.9%, which was derived from our assessment of securitized rates for similar assets and credit quality. We recognized $0.2 million and $0.3 million of right-of-use asset and lease liability amortization during the years ended December 31, 2020 and 2019, respectively.
The following table sets forth the undiscounted cash flows of our scheduled obligations for future minimum payments on our operating ground lease as of December 31, 2020 and a reconciliation of those cash flows to the operating lease liability as of December 31, 2020 (in thousands):
| | | | | | | | |
| 2021 | | $ | 260 | |
| 2022 | | 260 | |
| 2023 | | 260 | |
| 2024 | | 260 | |
| 2025 | | 260 | |
| Thereafter | | 11,635 | |
| | 12,935 | |
| Imputed interest | | (9,203) | |
| Lease liability | | $ | 3,732 | |
NOTE 5: MORTGAGE NOTE PAYABLE
In January 2020, we prepaid the $45.6 million mortgage note secured by Yale West, which was scheduled to mature in 2052. As a result of the transaction, we recognized a gain on extinguishment of debt of $0.5 million related to the write-off of an unamortized mortgage premium of $1.4 million, partially offset by a prepayment penalty of $0.9 million. Following this repayment, we have no outstanding mortgage notes as of December 31, 2020.
As of December 31, 2019, we had one outstanding mortgage notes payable, collateralized by a building and related land from our portfolio, as follows (in thousands):
| | | | | | | | | | | | | | | | | | | | |
| Properties | | Assumption/Issuance Date (1) | | Effective Interest Rate (2) | | December 31, 2019 |
| Yale West | | 2/21/2014 | | 3.75 | % | | $ | 45,654 | |
| | | | | | |
| Premiums and discounts, net | | | | | | 1,470 | |
| Debt issuance costs, net | | | | (50) | |
| | | | | | $ | 47,074 | |
______________________________
(1) This mortgage was assumed with the acquisition of the collateralized property. We record mortgages assumed in an acquisition at fair value.
(2) Yield on the assumption/issuance date, including the effects of any premiums, discounts or fair value adjustments on the notes.
Principal and interest were payable monthly until the maturity date, at which time all unpaid principal and interest were payable in full.
Total cost basis of the above mortgaged property was $77.4 million at December 31, 2019.
NOTE 6: UNSECURED LINES OF CREDIT PAYABLE
During the first quarter of 2018, we entered into an amended and restated credit agreement (“Credit Agreement”) which provides for a $700.0 million unsecured revolving credit facility (“Revolving Credit Facility”), the continuation of an existing $150.0 million unsecured term loan (“2015 Term Loan”) and an additional $250.0 million unsecured term loan (“2018 Term Loan”). The Revolving Credit Facility has a four-year term ending in March 2022, with two six-month extension options. The Credit Agreement has an accordion feature that allows us to increase the facility up to $1.5 billion in the aggregate, to the extent the lenders agree to provide additional revolving loan commitments or term loans.
The 2018 Term Loan increases and replaces the $150.0 million unsecured term loan, initially entered into on July 22, 2016 (“2016 Term Loan”), that was scheduled to mature in July 2023. The 2018 Term Loan is scheduled to mature in July 2023 and bears interest at a rate of either one month LIBOR plus a margin ranging from 0.85% to 1.75% or the base rate plus a margin ranging from 0.0% to 0.75% (in each case depending upon WashREIT’s credit rating). We used the $100.0 million of additional proceeds from the 2018 Term Loan primarily to repay outstanding borrowings on the Revolving Credit Facility.
We had previously used interest rate derivatives to effectively fix the interest rate of the 2016 Term Loan. These interest rate
derivatives now effectively fix the interest rate on a $150.0 million portion of the 2018 Term Loan at 2.31%. In March 2018, we entered into interest rate derivatives that commenced on June 29, 2018 to effectively fix the interest rate on the remaining $100.0 million of the 2018 Term Loan at 3.71%. The 2018 Term Loan has an all-in fixed interest rate of 2.87%.
The amount of the Revolving Credit Facility unused and available at December 31, 2020 was as follows (in thousands):
| | | | | |
| Committed capacity | $ | 700,000 | |
| Borrowings outstanding | (42,000) | |
| |
| Unused and available | $ | 658,000 | |
We executed borrowings and repayments on the Revolving Credit Facility during 2020 as follows (in thousands):
| | | | | |
| Balance at December 31, 2019 | $ | 56,000 | |
| Borrowings | 732,000 | |
| Repayments | (746,000) | |
| Balance at December 31, 2020 | $ | 42,000 | |
The Revolving Credit Facility bears interest at a rate of either one month LIBOR plus a margin ranging from 0.775% to 1.55% or the base rate plus a margin ranging from 0.0% to 0.55% (in each case depending upon WashREIT’s credit rating). The base rate is the highest of the administrative agent's prime rate, the federal funds rate plus 0.50% and the LIBOR market index rate plus 1.0%. In addition, the Revolving Credit Facility requires the payment of a facility fee ranging from 0.10% to 0.30% (depending on WashREIT’s credit rating) on the $700.0 million committed capacity, without regard to usage. As of December 31, 2020, the interest rate on the facility was LIBOR plus 1.00%, the one month LIBOR was 0.14% and the facility fee was 0.20%.
All outstanding advances for the Revolving Credit Facility are due and payable upon maturity in March 2022, unless extended pursuant to one or both of the two six-month extension options. Interest only payments are due and payable generally on a monthly basis.
For the three years ended December 31, 2020, we recognized interest expense (excluding facility fees) and facility fees as follows (in thousands):
| | | | | | | | | | | | | | | | | |
| Year Ended December 31, |
| 2020 | | 2019 | | 2018 |
| Interest expense (excluding facility fees) | $ | 3,035 | | | $ | 6,554 | | | $ | 6,843 | |
| Facility fees | 1,423 | | | 1,400 | | | 1,371 | |
The Revolving Credit Facility contains and the prior unsecured credit facility that it replaced contained certain financial and non-financial covenants, all of which we have met as of December 31, 2020 and 2019. Included in these covenants are limits on our total indebtedness, secured and unsecured indebtedness and required debt service payments.
Information related to revolving credit facilities for the three years ended December 31, 2020 as follows (in thousands, except percentage amounts):
| | | | | | | | | | | | | | | | | |
| Year Ended December 31, |
| 2020 | | 2019 | | 2018 |
| Total revolving credit facilities at December 31 | $ | 700,000 | | | $ | 700,000 | | | $ | 700,000 | |
| Borrowings outstanding at December 31 | 42,000 | | | 56,000 | | | 188,000 | |
| Weighted average daily borrowings during the year | 204,809 | | | 196,074 | | | 230,934 | |
| Maximum daily borrowings during the year | 456,000 | | | 300,000 | | | 429,000 | |
| Weighted average interest rate during the year | 1.48 | % | | 3.34 | % | | 2.96 | % |
| Weighted average interest rate on borrowings outstanding at December 31 | 1.15 | % | | 2.73 | % | | 3.52 | % |
The covenants under our Credit Agreement require us to insure our properties against loss or damage in amounts customarily maintained by similar businesses or as they may be required by applicable law. The covenants for the notes require us to keep all of our insurable properties insured against loss or damage at least equal to their then full insurable value. We have an
insurance policy that has no terrorism exclusion, except for non-certified nuclear, chemical and biological acts of terrorism. Our financial condition and results of operations are subject to the risks associated with acts of terrorism and the potential for uninsured losses as the result of any such acts. Effective November 26, 2002, under this existing coverage, any losses caused by certified acts of terrorism would be partially reimbursed by the United States under a formula established by federal law. Under this formula, the United States pays 85% of covered terrorism losses exceeding the statutorily established deductible paid by the insurance provider, and insurers pay 10% until aggregate insured losses from all insurers reach $100 billion in a calendar year. If the aggregate amount of insured losses under this program exceeds $100 billion during the applicable period for all insured and insurers combined, then each insurance provider will not be liable for payment of any amount which exceeds the aggregate amount of $100 billion. On December 20, 2019, The Terrorism Risk Insurance Program Reauthorization Act of 2019 was signed into law, extending the program through December 31, 2027.
NOTE 7: NOTES PAYABLE
Our unsecured notes and term loans outstanding as of December 31, 2020 and 2019 are as follows (in thousands):
| | | | | | | | | | | | | | | | | | | | | | | | | | | | | |
| | | Effective | | December 31, | | Payoff Date/ |
| Coupon/Stated Rate | | Rate (1) | | 2020 | | 2019 | | Maturity Date (2) |
| 10-Year Unsecured Notes | 4.95 | % | | 5.05 | % | | $ | — | | | $ | 250,000 | | | 10/1/2020 |
| 2015 Term Loan | 1 Month LIBOR + 110 basis points | | 2.72 | % | | — | | | 150,000 | | | 3/15/2021 |
| 10-Year Unsecured Notes | 3.95 | % | | 4.02 | % | | 300,000 | | | 300,000 | | | 10/15/2022 |
2018 Term Loan (3) | 1 Month LIBOR + 110 basis points | | 2.87 | % | | 250,000 | | | 250,000 | | | 7/21/2023 |
| 30-Year Unsecured Notes | 7.25 | % | | 7.36 | % | | 50,000 | | | 50,000 | | | 2/25/2028 |
| Green Bonds | 3.44 | % | | 4.09 | % | | 350,000 | | | — | | | 12/29/2030 |
| Total principal | | | | | 950,000 | | | 1,000,000 | | | |
| Premiums and discounts, net | | | | (456) | | | (797) | | | |
| Deferred issuance costs, net | | | | (4,174) | | | (2,481) | | | |
| Total | | | | $ | 945,370 | | | $ | 996,722 | | | |
______________________________
(1) For fixed rate notes, the effective rate represents the yield on issuance date, including the effects of discounts on the notes. For variable rate notes, the effective rate represents the rate as fixed by interest rate derivatives (see note 8).
(2) No principal amounts are due prior to maturity.
(3) The 2018 Term Loan increased and replaced the 2016 Term Loan (see note 6).
In April 2020, we used borrowings from our Revolving Credit Facility to prepay all $250.0 million of our 4.95% 10-year unsecured notes without penalty.
On May 5, 2020, we entered into a one-year, $150.0 million unsecured term loan facility (“2020 Term Loan”), maturing on May 5, 2021 with a one-year extension option. The 2020 Term Loan bears interest at LIBOR + 1.50%, which margin is subject to change based on our credit ratings, with a 0.50% floor for the LIBOR rate. We used the proceeds to repay borrowings under our Revolving Credit Facility. We repaid in full the 2020 Term Loan on November 30, 2020.
On September 29, 2020, we entered into a note purchase agreement to issue $350.0 million aggregate principal amount of 3.44% senior unsecured 10-year notes payable (the “Green Bonds”). The effective interest rate under the Green Bonds, including amortization of the associated interest rate swaps (see note 8), is 4.09%. The closing and full funding of the Green Bonds occurred on December 17, 2020. We incurred $2.6 million of debt issuance costs associated with the Green Bonds which are reported on our consolidated balance sheets as an offset to their related debt. The Green Bonds are senior unsecured obligations of WashREIT and rank equal in right to payment with all other senior unsecured indebtedness of WashREIT.
The proceeds of the sale of the Green Bonds were and will be used to finance or refinance recently completed and future green building and energy efficiency, sustainable water and wastewater management and renewable energy projects (“Eligible Green Projects”).
In the fourth quarter of 2020, we repaid all $150.0 million of borrowings on the 2015 Term Loan and all $150.0 million of borrowings on the 2020 Term Loan. As a result of these transactions, we recognized a loss on extinguishment of debt of $0.3 million.
The note purchase agreement contains customary financial covenants, including a maximum total leverage ratio, a maximum secured leverage ratio, a minimum fixed charge coverage ratio, a minimum unencumbered interest coverage ratio, and a maximum unencumbered leverage ratio. The note purchase agreement also contains restrictive covenants that, among other things, restrict the ability of WashREIT and its subsidiaries to enter into transactions with affiliates, consolidate or merge or transfer or lease all or substantially all of its assets, create liens, make dividends and distributions if an event of default exists, or substantially change the general nature of our business. Such financial and restrictive covenants are substantially similar to the corresponding covenants contained in our Credit Agreement.
The note purchase agreement also contains customary events of default, including payment defaults, cross defaults with certain other indebtedness, breaches of certain covenants and bankruptcy events. In the case of an event of default, we will generally be prohibited from paying any dividends, subject to certain exceptions including payment of dividends necessary to maintain REIT status, and the Purchasers may, among other remedies, accelerate the payment of all obligations. In the event of a change in control of WashREIT, we must offer to prepay the Green Bonds at par.
On April 30, 2019, we entered into a six-month, $450.0 million unsecured term loan facility (“2019 Term Loan”), maturing on October 30, 2019 with an option to extend for a six-month period. The 2019 Term Loan bore interest, at WashREIT’s option, at a rate of either LIBOR plus a margin ranging from 0.75% to 1.65% or the base rate plus a margin ranging 0.0% to 0.65% (in each case depending upon WashREIT’s credit rating). The base rate was the highest of the administrative agent’s prime rate, the federal funds rate plus 0.50% and the daily one-month LIBOR rate plus 1.0%. At WashREIT’s election, the 2019 Term Loan had an interest rate of one-week LIBOR plus 100 basis points, based on WashREIT’s current unsecured debt rating. The 2019 Term Loan was used to fund the acquisition of the Assembly Portfolio (see note 3). During the third quarter of 2019, we repaid the $450.0 million of borrowings on the 2019 Term Loan with proceeds from the sale of the Retail Portfolio (see note 3).
The required principal payments on the unsecured notes and term loans as of December 31, 2020 are as follows (in thousands):
| | | | | |
| 2021 | $ | — | |
| 2022 | 300,000 | |
| 2023 | 250,000 | |
| 2024 | — | |
| 2025 | — | |
| Thereafter | 400,000 | |
| $ | 950,000 | |
Interest on these notes is payable semi-annually, except for the term loans, for which interest is payable monthly. These notes contain certain financial and non-financial covenants, all of which we have met as of December 31, 2020. Included in these covenants is the requirement to maintain a minimum level of unencumbered assets, as well as limits on our total indebtedness, secured indebtedness and required debt service payments.
NOTE 8: DERIVATIVE INSTRUMENTS
On September 15, 2015, we entered into two interest rate swap arrangements with a total notional amount of $150.0 million to swap the floating interest rate under the $150.0 million 2015 Term Loan (see note 6) to an all-in fixed interest rate of 2.72% starting on October 15, 2015 and extending until the maturity of the 2015 Term Loan on March 15, 2021.
On July 22, 2016, we entered into two forward interest rate swap arrangements with a total notional amount of $150.0 million to swap the floating interest rate under the $150.0 million 2016 Term Loan (see note 6) to an all-in fixed interest rate of 2.86%, starting on March 31, 2017 and extending until the scheduled maturity of the 2016 Term Loan on July 21, 2023.
On March 29, 2018, we entered into the $250.0 million 2018 Term Loan (see note 6) maturing on July 21, 2023, which increased and replaced the 2016 Term Loan. The interest rate swap arrangements that had effectively fixed the 2016 Term Loan now effectively fix the interest rate on a $150.0 million portion of the 2018 Term Loan at 2.31%. On March 29, 2018, we entered into four interest rate swap arrangements with a total notional amount of $100.0 million to effectively fix the interest rate on the remaining $100.0 million of the 2018 Term Loan at 3.71%, that commenced on June 29, 2018 and extending until the maturity of the 2018 Term Loan on July 21, 2023. The $250.0 million 2018 Term Loan has an all-in fixed interest rate of 2.87% (see note 6 and note 7).
In November 2019, we entered into four forward interest rate swap arrangements, each effective as of April 1, 2020 (“Forward Swaps”) with a total notional amount of $200.0 million to reduce our exposure to adverse fluctuations in interest rates on future
fixed-rate debt to replace all $250.0 million of our 4.95% 10-year unsecured notes that were scheduled to mature in October 2020. In April 2020, we used borrowings from our Revolving Credit Facility to prepay all $250.0 million of our 4.95% 10-year unsecured notes without penalty. In September 2020, in conjunction with the entry into the note purchase agreement to issue the Green Bonds, we terminated the Forward Swaps. At the time of termination, the Forward Swaps had a liability fair value of $20.4 million, which will be amortized as interest expense over the 10-year term of the Green Bonds. On October 2, 2020, we paid the $20.4 million liability associated with the termination of the Forward Swaps.
In December 2020, in connection with the prepayment of our 2015 Term Loan, we terminated interest rate swap agreements with notional amounts in the aggregate of $150.0 million (see note 7). As a result of the termination, the accumulated fair value of the interest rate swaps was reclassified from Accumulated other comprehensive loss to Loss on interest rate derivatives on our consolidated income statements, which resulted in a realized loss of approximately $0.6 million.
The interest rate swaps qualify as cash flow hedges and are recorded at fair value in accordance with GAAP, based on discounted cash flow methodologies and observable inputs. We record the effective portion of changes in fair value of the cash flow hedges in other comprehensive income. The resulting unrealized loss on the effective portions of the cash flow hedges was the only activity in other comprehensive income (loss) during the periods presented in our consolidated financial statements. We assess the effectiveness of our cash flow hedges both at inception and on an ongoing basis. The cash flow hedges were highly effective for all periods presented.
The fair values of the interest rate swaps as of December 31, 2020 and 2019, are as follows (in thousands):
| | | | | | | | | | | | | | | | | | | | | |
| Aggregate
Notional
Amount | Effective Date | | Fair Value |
| | Derivative Assets (Liabilities) | |
| | December 31, | |
| Derivative Instrument | Maturity Date | 2020 | | 2019 | |
| Interest rate swaps | $ | 150,000 | | October 15, 2015 | March 15, 2021 | $ | — | | | $ | (62) | | |
| Interest rate swaps | 150,000 | | March 31, 2017 | July 21, 2023 | (4,009) | | | 1,825 | | |
| Interest rate swaps | 100,000 | | June 29, 2018 | July 21, 2023 | (6,246) | | | (3,664) | | |
| Interest rate swaps | 200,000 | | April 1, 2020 | April 1, 2030 | — | | | 3,724 | | |
| | | | $ | (10,255) | | | $ | 1,823 | | |
We record interest rate swaps on our consolidated balance sheets with prepaid expenses and other assets when in a net asset position, and with accounts payable and other liabilities when in a net liability position. The interest rate swaps have been effective since inception. The gains or losses on the effective swaps are recognized in other comprehensive income, as follows (in thousands):
| | | | | | | | | | | | | | | | | |
| Year Ending December 31, |
| 2020 | | 2019 | | 2018 |
| Unrealized (loss) gain on interest rate hedges | $ | (33,025) | | | $ | (8,016) | | | $ | 420 | |
Amounts reported in Accumulated other comprehensive income related to derivatives will be reclassified to interest expense as interest payments are made on our variable-rate debt. The gains or losses reclassified from Accumulated other comprehensive income into interest expense for the three years ended December 31, 2020, were as follows (in thousands):
| | | | | | | | | | | | | | | | | |
| Year Ending December 31, |
| 2020 | | 2019 | | 2018 |
| Loss reclassified from Accumulated other comprehensive income (loss) into interest expense | $ | 79 | | | $ | — | | | $ | — | |
During the next twelve months, we estimate that $6.0 million will be reclassified as an increase to interest expense.
We have agreements with each of our derivative counterparties that contain a provision whereby we could be declared in default on our derivative obligations if repayment of the underlying indebtedness is accelerated by the lender due to our default on the indebtedness. As of December 31, 2020, we did not have any derivatives in an asset position and the fair value of the derivative liabilities, including accrued interest, was $10.3 million. As of December 31, 2020, we have not posted any collateral related to these agreements.
Derivative instruments expose us to credit risk in the event of non-performance by the counterparty under the terms of the interest rate hedge agreement. We believe that we minimize our credit risk on these transactions by dealing with major, creditworthy financial institutions. We monitor the credit ratings of counterparties and our exposure to any single entity, thus minimizing our credit risk concentration.
NOTE 9: FAIR VALUE DISCLOSURES
Assets and Liabilities Measured at Fair Value
For assets and liabilities measured at fair value on a recurring basis, quantitative disclosures about the fair value measurements are required to be disclosed separately for each major category of assets and liabilities, as follows:
Level 1: Quoted prices in active markets for identical assets
Level 2: Significant other observable inputs
Level 3: Significant unobservable inputs
The only assets or liabilities we had at December 31, 2020 and 2019 that are recorded at fair value on a recurring basis are the assets held in the Supplemental Executive Retirement Plan ("SERP"), which primarily consists of investments in mutual funds, and the interest rate swaps (see note 8).
We base the valuations related to the SERP on assumptions derived from significant other observable inputs and accordingly these valuations fall into Level 2 in the fair value hierarchy.
The valuation of the interest rate swaps is determined using widely accepted valuation techniques, including discounted cash flow analysis on the expected cash flows of each interest rate swap. This analysis reflects the contractual terms of the interest rate swaps, including the period to maturity, and uses observable market-based inputs, including interest rate curves and implied volatilities. The fair values of interest rate swaps are determined using the market standard methodology of netting the discounted future fixed cash payments (or receipts) and the discounted expected variable cash receipts (or payments). The variable cash payments (or receipts) are based on an expectation of future interest rates (forward curves) derived from observable market interest rate curves. To comply with the provisions of ASC 820, we incorporate credit valuation adjustments in the fair value measurements to appropriately reflect both our own nonperformance risk and the respective counterparty’s nonperformance risk. These credit valuation adjustments were concluded to not be significant inputs for the fair value calculations for the periods presented. In adjusting the fair value of our derivative contracts for the effect of nonperformance risk, we have considered the impact of netting and any applicable credit enhancements, such as the posting of collateral, thresholds, mutual puts and guarantees. The valuation of interest rate swaps fall into Level 2 in the fair value hierarchy.
The fair values of these assets and liabilities at December 31, 2020 and 2019 were as follows (in thousands):
| | | | | | | | | | | | | | | | | | | | | | | | | | | | | | | | | | | | | | | | | | | | | | | |
| | December 31, 2020 | | December 31, 2019 |
| | Fair Value | | Quoted Prices in Active Markets for Identical Assets (Level 1) | | Significant Other Observable Inputs
(Level 2) | | Significant Unobservable Inputs
(Level 3) | | Fair Value | | Quoted Prices in Active Markets for Identical Assets
(Level 1) | | Significant Other Observable Inputs
(Level 2) | | Significant Unobservable Inputs
(Level 3) |
| Assets: | | | | | | | | | | | | | | | |
| SERP | $ | 2,433 | | | $ | — | | | $ | 2,433 | | | $ | — | | | $ | 1,792 | | | $ | — | | | $ | 1,792 | | | $ | — | |
| Interest rate swaps | — | | | — | | | — | | | — | | | 5,549 | | | — | | | 5,549 | | | — | |
| Liabilities: | | | | | | | | | | | | | | | |
| Interest rate swaps | $ | (10,255) | | | $ | — | | | $ | (10,255) | | | $ | — | | | $ | (3,726) | | | $ | — | | | $ | (3,726) | | | $ | — | |
Financial Assets and Liabilities Not Measured at Fair Value
The following disclosures of estimated fair value were determined by management using available market information and established valuation methodologies, including discounted cash flow models. Many of these estimates involve significant judgment. The estimated fair value disclosed may not necessarily be indicative of the amounts we could realize on disposition of the financial instruments. The use of different market assumptions or estimation methodologies could have an effect on the estimated fair value amounts. In addition, fair value estimates are made at a point in time and thus, estimates of fair value subsequent to December 31, 2020 may differ significantly from the amounts presented.
Below is a summary of significant methodologies used in estimating fair values and a schedule of fair values at December 31, 2020.
Cash and Cash Equivalents and Restricted Cash
Cash and cash equivalents and restricted cash include cash and commercial paper with original maturities of less than 90 days, which are valued at the carrying value, which approximates fair value due to the short maturity of these instruments (Level 1 inputs).
Debt
Mortgage notes payable consist of instruments in which certain of our real estate assets are used for collateral. We estimate the fair value of the mortgage notes payable by discounting the contractual cash flows at a rate equal to the relevant treasury rates (with respect to the timing of each cash flow) plus credit spreads estimated through independent comparisons to real estate assets or loans with similar characteristics. Line of credit payable consist of bank facilities which we use for various purposes including working capital, acquisition funding and capital improvements. The line of credit advances and term loans with floating interest rates are priced at a specified rate plus a spread. We estimate the market value based on a comparison of the spreads of the advances to market given the adjustable base rate. We estimate the fair value of the notes payable by discounting the contractual cash flows at a rate equal to the relevant treasury rates (with respect to the timing of each cash flow) plus credit spreads derived using the relevant securities’ market prices. We classify these fair value measurements as Level 3 as we use significant unobservable inputs and management judgment due to the absence of quoted market prices.
As of December 31, 2020 and 2019, the carrying values and estimated fair values of our financial instruments were as follows (in thousands):
| | | | | | | | | | | | | | | | | | | | | | | |
| December 31, |
| | 2020 | | 2019 |
| Carrying
Value | | Fair Value | | Carrying
Value | | Fair Value |
| Cash and cash equivalents | $ | 7,700 | | | $ | 7,700 | | | $ | 12,939 | | | $ | 12,939 | |
| Restricted cash | 603 | | | 603 | | | 1,812 | | | 1,812 | |
| Mortgage notes payable | — | | | — | | | 47,074 | | | 47,899 | |
| Line of credit payable | 42,000 | | | 42,000 | | | 56,000 | | | 56,000 | |
| Notes payable | 945,370 | | | 978,678 | | | 996,722 | | | 1,022,937 | |
NOTE 10: STOCK BASED COMPENSATION
WashREIT maintains short-term and long-term incentive plans that allow for stock-based awards to officers and non-officer employees. Stock based awards are provided to officers and non-officer employees, as well as trustees, under the Washington Real Estate Investment Trust 2016 Omnibus Incentive Plan which allows for awards in the form of restricted shares, restricted share units, options, and other awards up to an aggregate of 2,400,000 shares over the ten year period in which the plan will be in effect. Restricted share units are converted into shares of our stock upon full vesting through the issuance of new shares. There were no options issued or outstanding as of December 31, 2020 and 2019.
On February 14, 2020, the board of trustees adopted an Amended and Restated Executive Officer Short-Term Incentive Plan (the “Officer STIP”) and an Amended and Restated Executive Officer Long-Term Incentive Plan (the “Officer LTIP”). Upon adoption by the board of trustees, both plans became effective for the performance periods beginning January 1, 2020.
Officer STIP
Under the Officer STIP, as revised, all named executive officers will have the opportunity to receive an annual cash bonus based on the achievement of certain performance measures that will be established for each performance period. Each year, the Compensation Committee will establish the threshold, target and high performance goals for each performance measure, as well as the weighting attributable to each such performance measure, with the aggregate weighting for all such performance measures to total 100%. Such performance measures will consist of one or more financial performance measures and, if determined by the Compensation Committee, individual performance measures.
Upon or following completion of a performance period, the degree of achievement of each financial performance measure will be determined by the Compensation Committee. The degree of achievement of any individual financial performance measures will be determined by the Compensation Committee in its discretion with respect to the Chief Executive Officer, and by the Chief Executive Officer or other immediate supervisor in his or her discretion with respect to all other participants (subject to final approval by the Compensation Committee), and the Compensation Committee will evaluate the degree of achievement of the individual performance measures on a scale of below 1 (below threshold), 1 (threshold), 2 (target) or 3 (high) or any fractional number between 1 and 3.
Each participant’s total award under the Officer STIP with respect to a performance period will be stated as a percentage of the participant’s annual base salary determined as of the first day of that performance period, which percentage will depend upon the participant’s position and the degree of achievement of threshold, target, and high performance goals for the performance period which, except as otherwise determined by the Compensation Committee, will be as set forth in the table below:
| | | | | | | | | | | |
| Threshold | Target | High |
| President and Chief Executive Officer | 63% | 125% | 188% |
| Executive Vice President | 48% | 93% | 160% |
| Senior Vice President | 35% | 65% | 115% |
If a Change in Control (as defined in the Officer STIP) occurs during a performance period while the participant is employed, the participant will receive a prorated award under the Officer STIP calculated based on the actual levels of achievement of the prorated performance goals as of the date of the Change in Control.
Officer LTIP
Under the Officer LTIP, as revised, all named executive officers will have the opportunity to receive awards based on (i) the achievement of performance measures, which will be established for each performance period, and (ii) continued employment with the Company. The aggregate weighting for the performance measures and the time-based measures, as determined by the Compensation Committee, will total 100%. The performance measures will consist of one or more shareholder return measures and one or more strategic measures. The awards earned under the Officer LTIP, if any, are payable in our common shares of beneficial interest. Each participant’s total award under the Officer LTIP with respect to a performance period will be stated as a percentage of the participant’s annual base salary determined as of the beginning of that performance period. The percentage will depend upon the participant’s position and the degree of achievement of threshold, target, and high performance goals for the performance period which, except as otherwise determined by the Compensation Committee, will be as set forth in the table below:
| | | | | | | | | | | |
| Threshold | Target | High |
| President and Chief Executive Officer | 198% | 275% | 440% |
| Executive Vice President | 143% | 200% | 295% |
| Senior Vice President | 100% | 143% | 207% |
Any time-based awards under the Officer LTIP will be subject to a three-year vesting schedule, with any award vesting in one-third increments on December 15 of each year of the applicable performance period if the participant remains employed by the Company on each of such dates. The Officer LTIP provides that following a performance period, 100% of any performance-based award will vest immediately upon grant.
Each year, the Compensation Committee will establish the threshold, target and high performance goals for each performance measure. Upon or following completion of a performance period, the degree of achievement of each performance measure will be determined by the Compensation Committee in its discretion.
If a Change in Control (as defined in the Officer LTIP) occurs during a performance period while the participant is employed, the Officer LTIP provides that all time-based awards which are unvested will become vested, and the participant will receive a pro-rated portion of the shareholder return measure-based awards and the strategic measure-based awards will be calculated at target.
Prior Short-Term Incentive Plan ("Prior STIP")
Under the Prior STIP, executive officers earned awards, payable 50% in cash and 50% in restricted shares, based on a percentage of salary and an achievement rating subject to the discretion of the Compensation Committee of the board of trustees in consideration of various performance conditions and other subjective factors during a one-year performance period. With respect to the 50% of the Prior STIP award payable in restricted shares, the restricted shares will vest over a three-year period commencing on the January 1 following the end of the one-year performance period. Prior to the adoption of the 2016 Omnibus Incentive Plan, stock based awards to officers, non-officer employees and trustees were issued under the Washington Real Estate Investment Trust 2007 Omnibus Long-Term Incentive Plan which allowed for awards in the form of restricted shares, restricted share units, options and other awards up to an aggregate of 2,000,000 shares while the plan was in effect.
The grant date for the 50% of the Prior STIP award payable in restricted shares was the date on which the Compensation Committee approved the Prior STIP awards. We recognize compensation expense on this 50% when the grant date occurs at the end of the one-year period through the three-year vesting period.
Bonuses payable under the short-term incentive plans for non-executive officers and staff are payable 100% in cash.
Prior Long-Term Incentive Plan ("Prior LTIP")
Under the Prior LTIP, executive officers earned awards payable, 75% in unrestricted shares and 25% in restricted shares, based on a percentage of salary and the achievement of certain market conditions. For performance periods beginning prior to January 1, 2018, performance was evaluated based 50% on absolute total shareholder return (“TSR”) and 50% on relative TSR over a three-year evaluation period with a new three-year period initiating under the existing plan each year. During the first quarter of 2018, we amended the Prior LTIP for executive officers to eliminate the absolute TSR component and only utilize relative TSR in the measurement of market condition performance. Under the amended Prior LTIP, relative TSR was evaluated 50% relative to a defined population of peer companies and 50% relative to the FTSE NAREIT Diversified Index. The amendment became effective for three-year performance periods commencing on or after January 1, 2018. The officers' total award opportunities under the Prior LTIP stated as a percentage of base salary ranged from 80% to 150% at target level. The unrestricted shares vest immediately at the end of the three-year performance period, and the restricted shares vest over a one-year period commencing on the January 1 following the end of the three-year performance period.
We recognize compensation expense ratably (over three years for the 75% unrestricted shares and over four years for the 25% restricted shares) based on the grant date fair value, as determined using a Monte Carlo simulation, and regardless of whether the market conditions are achieved and the awards ultimately vest.
We use a binomial model which employs the Monte Carlo method as of the grant date to determine the fair value of the officer LTIP awards. For three-year performance periods commencing on or after January 1, 2018, the market condition performance measurement is based on total shareholder return relative to a defined population of peer companies (50% weighting) and relative to the FTSE NAREIT Diversified Index (50% weighting). The model evaluates the awards for changing total shareholder return over the term of the vesting, relative to the peer companies and relative to the FTSE NAREIT Diversified Index, and uses random simulations that are based on past stock characteristics as well as dividend growth and other factors for WashREIT and each of the peer companies. For three-year performance periods commencing prior to January 1, 2018, the market condition performance measurement was based on total shareholder return on an absolute basis (50% weighting) and relative to a defined population of peer companies (50% weighting).
The assumptions used to value the TSR portion of the officer LTIP and Prior LTIP awards were as follows:
| | | | | | | | | | | | | | | | | |
| 2020 Awards | | 2019 Awards | | 2018 Awards |
Expected volatility (1) | 17.5 | % | | 18.1 | % | | 17.9 | % |
Risk-free interest rate (2) | 1.4 | % | | 2.4 | % | | 2.4 | % |
Expected term (3) | 3 years | | 3 and 4 years | | 3 and 4 years |
| Share price at grant date | $31.50 | | $23.00 | | $ | 26.06 | |
______________________________
(1) Expected volatility based upon historical volatility of our daily closing share price.
(2) Risk-free interest rate based on U.S. treasury constant maturity bonds on the measurement date with a maturity equal to the market condition performance period.
(3) Expected term based on the market condition performance period.
The calculated grant date fair value as a percentage of base salary for the officers for the three-year performance period that commenced in 2020 ranged from approximately 20% to 42% for the 50% of the LTIP based on TSR relative to a defined
population of peer companies and from 22% to 46% for the 50% of the LTIP based on TSR relative to the FTSE NAREIT Diversified Index.
The calculated grant date fair value as a percentage of base salary for the officers for the three-year performance period that commenced in 2019 ranged from approximately 35% to 68% for the 50% of the LTIP based on TSR relative to a defined population of peer companies and from 39% to 74% for the 50% of the LTIP based on TSR relative to the FTSE NAREIT Diversified Index.
The calculated grant date fair value as a percentage of base salary for the officers for the three-year performance period that commenced in 2018 ranged from approximately 31% to 60% for the 50% of the LTIP based on TSR relative to a defined population of peer companies and from 35% to 68% for the 50% of the LTIP based on TSR relative to the FTSE NAREIT Diversified Index.
During 2017, our chief executive officer was granted a one-time equity award of 100,000 restricted shares. None of the restricted shares vest until the fifth anniversary of the grant date, at which time 100% of the restricted shares will vest, subject to Mr. McDermott's continued employment with WashREIT until such vesting date.
Our non-executive officers and other employees earn restricted share unit awards under a long-term incentive plan for non-executive officers and staff based upon various percentages of their salaries and annual performance calculations. The restricted share unit awards vest ratably over three years from December 15 preceding the grant date based upon continued employment. We recognize compensation expense for these awards according to a graded vesting schedule over the three-year requisite service period.
Restricted share awards made to retirement-eligible employees fully vest on the grant date. Employees are considered retirement-eligible when they are both over the age of 55 and have been employed by WashREIT for at least 20 years, or over the age of 65. We fully recognize compensation expense for such awards as of the grant date.
Trustee Awards
We award share based compensation to our trustees in the form of restricted shares which vest immediately and are restricted from sale for the period of the trustees' service. The value of share-based compensation for each trustee was $100,000 for each of three years ended December 31, 2020.
Total Compensation Expense
Total compensation expense recognized in the consolidated financial statements for each of the three years ended December 31, 2020 for all share based awards was $7.9 million, $7.7 million and $6.7 million, respectively, net of capitalized stock-based compensation expense of $0.4 million, $0.2 million and $0.3 million, respectively.
Restricted Share Awards with Performance and Service Conditions
The activity for the three years ended December 31, 2020 related to our restricted share awards, excluding those subject to market conditions, was as follows:
| | | | | | | | | | | |
| | Shares | | Wtd Avg Grant Fair Value |
| Unvested at December 31, 2017 | 236,694 | | | $ | 27.96 | |
| Granted | 304,087 | | | 25.98 | |
| Vested during year | (224,150) | | | 27.40 | |
| Forfeited | (5,621) | | | 29.43 | |
| Unvested at December 31, 2018 | 311,010 | | | 29.07 | |
| Granted | 213,782 | | | 26.26 | |
| Vested during year | (236,013) | | | 27.43 | |
| Forfeited | (19,396) | | | 26.60 | |
| Unvested at December 31, 2019 | 269,383 | | | 28.45 | |
| Granted | 285,101 | | | 30.39 | |
| Vested during year | (239,033) | | | 27.54 | |
| Forfeited | (8,456) | | | 28.35 | |
| Unvested at December 31, 2020 | 306,995 | | | 30.96 | |
The total fair value of share grants vested for each of the three years ended December 31, 2020 was $6.6 million, $6.5 million and $6.1 million, respectively.
As of December 31, 2020, the total compensation cost related to non-vested share awards not yet recognized was $7.0 million, which we expect to recognize over a weighted average period of 21 months.
Restricted and Unrestricted Shares with Market Conditions
Stock based awards with market conditions under the LTIP and Prior LTIP were granted in 2020, 2019 and 2018 with fair market values, as determined using a Monte Carlo simulation, as follows (in thousands):
| | | | | | | | | | | | | | | | | | | | | | | | | | | | | |
| | |
| 2020 Awards | | 2019 Awards | | 2018 Awards |
| | Unrestricted (1) | | Restricted | | Unrestricted | | Restricted | | Unrestricted |
| Relative Peer TSR | $ | 510 | | | $ | 184 | | | $ | 552 | | | $ | 203 | | | $ | 608 | |
Absolute/Index TSR (2) | 565 | | | 201 | | | 602 | | | 230 | | | 690 | |
The unamortized value of these awards with market conditions as of December 31, 2020 was as follows (in thousands):
| | | | | | | | | | | | | | | | | | | | | | | | | | | | | |
| | 2020 Awards | | 2019 Awards | | 2018 Awards |
| Unrestricted | | Restricted | | Unrestricted | | Restricted | | Unrestricted |
| Relative Peer TSR | $ | 355 | | | $ | 92 | | | $ | 184 | | | $ | 42 | | | $ | — | |
Absolute/Index TSR (1) | 393 | | | 100 | | | 201 | | | 48 | | | — | |
______________________________
(1) The 2020 Awards were granted under the 2020 LTIP, whereby all of the shares vest immediately at the end of the three-year performance period. The 2019 and 2018 Awards were granted under the Prior LTIP, whereby the unrestricted shares (75%) vest immediately at the end of the three-year performance period and the restricted shares (25%) vest over a one-year period commencing on the January 1 following the end of the three-year performance period.
(2) The performance conditions for the 2020, 2019 and 2018 awards were evaluated based on 50% on TSR relative to a defined population of peer companies and 50% on TSR relative to the FTSE NAREIT Diversified Index.
NOTE 11: OTHER BENEFIT PLANS
We have a Retirement Savings Plan (the “401(k) Plan”), which permits all eligible employees to defer a portion of their compensation in accordance with the Code. Under the 401(k) Plan, we may make discretionary contributions on behalf of eligible employees. For each of the three years ended December 31, 2020, we made contributions to the 401(k) plan of $0.4 million, $0.5 million and $0.5 million, respectively.
We have adopted non-qualified deferred compensation plans for the officers and members of the board of trustees. The plans allow for a deferral of a percentage of annual cash compensation and trustee fees. The plans are unfunded and payments are to be made out of the general assets of WashREIT. The deferred compensation liability was $0.7 million and $0.9 million at December 31, 2020 and 2019, respectively.
In November 2005, the board of trustees approved the establishment of a SERP for the benefit of officers. This is a defined contribution plan under which, upon a participant's termination of employment from WashREIT for any reason other than discharge for cause, the participant will be entitled to receive a benefit equal to the participant's accrued benefit times the participant's vested interest. We account for this plan in accordance with ASC 710-10 and ASC 320-10, whereby the investments are reported at fair value, and unrealized holding gains and losses are included in earnings. At December 31, 2020 and 2019, the accrued benefit liability was $2.4 million and $1.8 million, respectively. For each of the three years ended December 31, 2020, we recognized current service cost of $0.2 million, $0.2 million and $0.3 million, respectively.
NOTE 12: EARNINGS PER COMMON SHARE
We determine “Basic earnings per share” using the two-class method as our unvested restricted share awards and units have non-forfeitable rights to dividends, and are therefore considered participating securities. We compute basic earnings per share by dividing net income less the allocation of undistributed earnings to unvested restricted share awards and units by the weighted-average number of common shares outstanding for the period.
We also determine “Diluted earnings per share” as the more dilutive of the two-class method or the treasury stock method with respect to the unvested restricted share awards. We further evaluate any other potentially dilutive securities at the end of the period and adjust the basic earnings per share calculation for the impact of those securities that are dilutive. Our dilutive earnings per share calculation includes the dilutive impact of operating partnership units under the if-converted method and our share based awards with performance conditions prior to the grant date and all market condition awards under the contingently issuable method.
The computation of basic and diluted earnings per share for the three years ended December 31, 2020 was as follows (in thousands, except per share data):
| | | | | | | | | | | | | | | | | |
| Year Ended December 31, |
| | 2020 | | 2019 | | 2018 |
| Numerator: | | | | | |
| (Loss) income from continuing operations | $ | (15,680) | | | $ | 29,132 | | | $ | 1,153 | |
| | | | | |
| Allocation of distributed earnings to unvested restricted share awards to continuing operations | (545) | | | (125) | | | (526) | |
| Adjusted (loss) income from continuing operations | (16,225) | | | 29,007 | | | 627 | |
| Income from discontinued operations, including gain on sale of real estate | — | | | 354,418 | | | 24,477 | |
| | | | | |
| Allocation of earnings from discontinued operations to unvested restricted share awards | — | | | (1,837) | | | — | |
| Adjusted income from discontinued operations | — | | | 352,581 | | | 24,477 | |
| Adjusted net (loss) income | $ | (16,225) | | | $ | 381,588 | | | $ | 25,104 | |
| Denominator: | | | | | |
| Weighted average shares outstanding – basic | 82,348 | | | 80,257 | | | 78,960 | |
| Effect of dilutive securities: | | | | | |
| Operating partnership units | — | | | 12 | | | 12 | |
| Employee restricted share awards | — | | | 66 | | | 70 | |
| Weighted average shares outstanding – diluted | 82,348 | | | 80,335 | | | 79,042 | |
| | | | | |
| Earnings per common share, basic: | | | | | |
| Continuing operations | $ | (0.20) | | | $ | 0.36 | | | $ | 0.01 | |
| Discontinued operations | — | | | 4.39 | | | 0.31 | |
| Basic net (loss) income per common share | $ | (0.20) | | | $ | 4.75 | | | $ | 0.32 | |
| Earnings per common share, diluted: | | | | | |
| Continuing operations | $ | (0.20) | | | $ | 0.36 | | | $ | 0.01 | |
| Discontinued operations | — | | | 4.39 | | | 0.31 | |
| Diluted net (loss) income per common share | $ | (0.20) | | | $ | 4.75 | | | $ | 0.32 | |
| | | | | |
| Dividends declared per common share | $ | 1.20 | | | $ | 1.20 | | | $ | 1.20 | |
NOTE 13: COMMITMENTS AND CONTINGENCIES
Development Commitments
At December 31, 2020, we had no committed contracts outstanding with third parties in connection with our development and redevelopment projects.
Litigation
We are involved from time to time in various legal proceedings, lawsuits, examinations by various tax authorities and claims that have arisen in the ordinary course of business. Management believes that the resolution of any such current matters will not have a material adverse effect on our financial condition or results of operations.
NOTE 14: SEGMENT INFORMATION
We evaluate real estate performance and allocate resources by property type through two reportable segments: office and multifamily. Office properties provide office space for various types of businesses and professions. Multifamily properties provide rental housing for individuals and families throughout the Washington metro region. We have eight retail properties that do not meet the qualitative or quantitative criteria for a reportable segment and are classified as “Corporate and other” in our segment disclosure tables.
We evaluate performance based upon net operating income of the combined properties in each segment. Our reportable operating segments are consolidations of similar properties. GAAP requires that segment disclosures present the measure(s) used by the chief operating decision maker for purposes of assessing each segment’s performance. Net operating income is a key measurement of our segment profit and loss and is defined as real estate rental revenue less real estate expenses.
Real estate rental revenue as a percentage of the total for each of the reportable operating segments for the three years ended December 31, 2020 was as follows:
| | | | | | | | | | | | | | | | | |
| | Year Ended December 31, |
| | 2020 | | 2019 | | 2018 |
| Multifamily | 49 | % | | 41 | % | | 33 | % |
| Office | 45 | % | | 53 | % | | 61 | % |
| Corporate and other | 6 | % | | 6 | % | | 6 | % |
The percentage of income producing real estate assets classified as held and used, at cost, for each of the reportable operating segments as of December 31, 2020 and 2019 was as follows:
| | | | | | | | | | | |
| | December 31, |
| | 2020 | | 2019 |
| Multifamily | 54 | % | | 50 | % |
| Office | 41 | % | | 45 | % |
| Corporate and other | 5 | % | | 5 | % |
The accounting policies of each of the segments are the same as those described in note 2.
The following tables present revenues, net operating income, capital expenditures and total assets for the three years ended December 31, 2020 from these segments, and reconciles net operating income of reportable segments to net (loss) income as reported (in thousands):
| | | | | | | | | | | | | | | | | | | | | | | | | |
| | Year Ended December 31, 2020 |
| | Office | | | | Multifamily | | Corporate
and Other (1) | | Consolidated |
| Real estate rental revenue | $ | 132,327 | | | | | $ | 145,045 | | | $ | 16,746 | | | $ | 294,118 | |
| Real estate expenses | 49,452 | | | | | 58,115 | | | 5,342 | | | 112,909 | |
| Net operating income | $ | 82,875 | | | | | $ | 86,930 | | | $ | 11,404 | | | $ | 181,209 | |
| Depreciation and amortization | | | | | | | | | (120,030) | |
| General and administrative | | | | | | | | | (23,951) | |
| | | | | | | | | |
| Interest expense | | | | | | | | | (37,305) | |
| Loss on interest rate derivatives | | | | | | | | | (560) | |
| Loss on extinguishment of debt | | | | | | | | | (34) | |
| | | | | | | | | |
| | | | | | | | | |
| Loss on sale of real estate | | | | | | | | | (15,009) | |
| | | | | | | | | |
| | | | | | | | | |
| | | | | | | | | |
| | | | | | | | | |
| | | | | | | | | |
| | | | | | | | | |
| Net loss | | | | | | | | | $ | (15,680) | |
| | | | | | | | | |
| | | | | | | | | |
| Capital expenditures | $ | 31,148 | | | | | $ | 24,675 | | | $ | 2,494 | | | $ | 58,317 | |
| Total assets | $ | 940,069 | | | | | $ | 1,333,235 | | | $ | 136,514 | | | $ | 2,409,818 | |
| | | | | | | | | | | | | | | | | | | | | | | | | |
| | Year Ended December 31, 2019 |
| | Office | | | | Multifamily | | Corporate and Other (1) | | Consolidated |
| Real estate rental revenue | $ | 164,059 | | | | | $ | 126,131 | | | $ | 18,990 | | | $ | 309,180 | |
| Real estate expenses | 60,923 | | | | | 49,135 | | | 5,522 | | | 115,580 | |
| Net operating income | $ | 103,136 | | | | | $ | 76,996 | | | $ | 13,468 | | | $ | 193,600 | |
| Depreciation and amortization | | | | | | | | | (136,253) | |
| General and administrative | | | | | | | | | (26,068) | |
| Real estate impairment | | | | | | | | | (8,374) | |
| | | | | | | | | |
| Interest expense | | | | | | | | | (53,734) | |
| | | | | | | | | |
| Gain on sale of real estate | | | | | | | | | 59,961 | |
| | | | | | | | | |
| | | | | | | | | |
| Discontinued operations: | | | | | | | | | |
| Income from properties sold or held for sale | | | | | | | | | 16,158 | |
| Gain on sale of real estate | | | | | | | | | 339,024 | |
| Loss on extinguishment of debt | | | | | | | | | (764) | |
| Net income | | | | | | | | | $ | 383,550 | |
| | | | | | | | | |
| | | | | | | | | |
| Capital expenditures | $ | 38,634 | | | | | $ | 25,779 | | | $ | 4,534 | | | $ | 68,947 | |
| Total assets | $ | 1,134,147 | | | | | $ | 1,340,634 | | | $ | 153,547 | | | $ | 2,628,328 | |
| | | | | | | | | | | | | | | | | | | | | | | | | |
| | Year Ended December 31, 2018 |
| | Office | | | | Multifamily | | Corporate and Other (1) | | Consolidated |
| Real estate rental revenue | $ | 178,474 | | | | | 95,194 | | 18,062 | | | $ | 291,730 | |
| Real estate expenses | 63,321 | | | | | 37,235 | | 5,036 | | | 105,592 | |
| Net operating income | $ | 115,153 | | | | | $ | 57,959 | | | $ | 13,026 | | | $ | 186,138 | |
| Depreciation and amortization | | | | | | | | | (111,826) | |
| General and administrative | | | | | | | | | (22,089) | |
| | | | | | | | | |
| Interest expense | | | | | | | | | (50,501) | |
| Real estate impairment | | | | | | | | | (1,886) | |
| | | | | | | | | |
| Loss on extinguishment of debt | | | | | | | | | (1,178) | |
| Gain on sale of real estate | | | | | | | | | 2,495 | |
| | | | | | | | | |
| | | | | | | | | |
| Discontinued operations: | | | | | | | | | |
| Income from properties sold or held for sale | | | | | | | | | 24,477 | |
| | | | | | | | | |
| | | | | | | | | |
| | | | | | | | | |
| Net income | | | | | | | | | $ | 25,630 | |
| | | | | | | | | |
| | | | | | | | | |
| Capital expenditures | $ | 42,019 | | | | | $ | 25,117 | | $ | 4,897 | | | $ | 72,033 | |
| Total assets | $ | 1,248,673 | | | | | $ | 792,170 | | $ | 376,261 | | | $ | 2,417,104 | |
______________________________
(1) Includes the retail properties not classified as discontinued operations: Takoma Park, Westminster, Concord Centre, Chevy Chase Metro Plaza, 800 S. Washington Street, Randolph Shopping Center, Montrose Shopping Center and Spring Valley Village, and total assets and capital expenditures include all retail properties, including those classified as discontinued operations.
NOTE 15: SELECTED QUARTERLY FINANCIAL DATA (UNAUDITED)
Unaudited financial data by quarter in each of the years ended December 31, 2020 and 2019 were as follows (in thousands, except for per share data):
| | | | | | | | | | | | | | | | | | | | | | | |
| | Quarter(1), (2) |
| | First | | Second | | Third | | Fourth |
| 2020 | | | | | | | |
| Real estate rental revenue | $ | 76,792 | | | $ | 72,870 | | | $ | 73,227 | | | $ | 71,229 | |
| Income (loss) from continuing operations | $ | 1,719 | | | $ | (5,406) | | | $ | (956) | | | $ | (11,037) | |
| Net income (loss) | $ | 1,719 | | | $ | (5,406) | | | $ | (956) | | | $ | (11,037) | |
| | | | | | | |
| Income (loss) from continuing operations per share | | | | | | | |
| Basic | $ | 0.02 | | | $ | (0.07) | | | $ | (0.01) | | | $ | (0.13) | |
| Diluted | $ | 0.02 | | | $ | (0.07) | | | $ | (0.01) | | | $ | (0.13) | |
| Net income (loss) per share | | | | | | | |
| Basic | $ | 0.02 | | | $ | (0.07) | | | $ | (0.01) | | | $ | (0.13) | |
| Diluted | $ | 0.02 | | | $ | (0.07) | | | $ | (0.01) | | | $ | (0.13) | |
| 2019 | | | | | | | |
| Real estate rental revenue | $ | 71,434 | | | $ | 76,820 | | | $ | 80,259 | | | $ | 80,667 | |
| (Loss) income from continuing operations | $ | (10,443) | | | $ | (6,191) | | | $ | (8,432) | | | $ | 54,198 | |
| Net (loss) income | $ | (4,405) | | | $ | 987 | | | $ | 332,770 | | | $ | 54,198 | |
| | | | | | | |
| (Loss) income from continuing operations per share | | | | | | | |
| Basic | $ | (0.13) | | | $ | (0.08) | | | $ | (0.10) | | | $ | 0.66 | |
| Diluted | $ | (0.13) | | | $ | (0.08) | | | $ | (0.10) | | | $ | 0.66 | |
| Net (loss) income per share | | | | | | | |
| Basic | $ | (0.06) | | | $ | 0.01 | | | $ | 4.14 | | | $ | 0.66 | |
| Diluted | $ | (0.06) | | | $ | 0.01 | | | $ | 4.14 | | | $ | 0.66 | |
______________________________
(1)With regard to per share calculations, the sum of the quarterly results may not equal full year results due to rounding.
(2)The second quarter of 2020 includes loss on sale of real estate of $7.5 million. The fourth quarter of 2020 includes loss on sale of real estate of $7.5 million. The second quarter of 2019 includes a loss on sale of real estate of $1.0 million. The third and fourth quarters of 2019 include gains on sale of real estate of $339.0 million and $61.0 million, respectively.
NOTE 16: SHAREHOLDERS' EQUITY
On May 4, 2018, we entered into eight separate equity distribution agreements (collectively, the “2018 Equity Distribution Agreements”) with each of Wells Fargo Securities, LLC, BNY Mellon Capital Markets, LLC, Capital One Securities, Inc., Citigroup Global Markets Inc., Goldman Sachs & Co. LLC, J.P. Morgan Securities LLC, KeyBanc Capital Markets Inc. and Truist Securities Inc., (f/k/a SunTrust Robinson Humphrey, Inc.) relating to the issuance of up to $250.0 million of our common shares from time to time under our at-the-market program. Issuances of our common shares are made at market prices prevailing at the time of issuance. We may use net proceeds from the issuance of common shares under this program for general business purposes, including, without limitation, working capital, the acquisition, renovation, expansion, improvement, development or redevelopment of income producing properties or the repayment of debt. Our issuances and net proceeds on the 2018 Equity Distribution Agreements for the three years ended December 31, 2020 were as follows (in thousands, except per share data):
| | | | | | | | | | | | | | | | | |
| Year Ended December 31, |
| 2020 | | 2019 | | 2018 |
| Issuance of common shares | 2,000 | | | 1,859 | | | 1,165 | |
| Weighted average price per share | $ | 23.86 | | | $ | 30.00 | | | $ | 31.18 | |
| Net proceeds | $ | 48,355 | | | $ | 54,916 | | | $ | 35,472 | |
We have a dividend reinvestment program, whereby shareholders may use their dividends and optional cash payments to purchase common shares. The common shares sold under this program may either be common shares issued by us or common
shares purchased in the open market. Net proceeds under this program are used for general corporate purposes.
Our issuances and net proceeds on the dividend reinvestment program for the three years ended December 31, 2020 were as follows (in thousands, except per share data):
| | | | | | | | | | | | | | | | | |
| Year Ended December 31, |
| 2020 | | 2019 | | 2018 |
| Issuance of common shares | 89 | | | 173 | | | 81 | |
| Weighted average price per share | $ | 24.12 | | | $ | 27.58 | | | $ | 29.18 | |
| Net proceeds | $ | 2,121 | | | $ | 4,755 | | | $ | 1,973 | |
NOTE 17: DEFERRED COSTS
As of December 31, 2020 and 2019, deferred leasing costs and deferred leasing incentives were included in prepaid expenses and other assets as follows (in thousands):
| | | | | | | | | | | | | | | | | | | | | | | | | | | | | | | | | | | |
| | December 31, |
| | 2020 | | 2019 |
| | Gross Carrying
Value | | Accumulated
Amortization | | Net | | Gross Carrying
Value | | Accumulated
Amortization | | Net |
| | | | | | | | | | | |
| Deferred leasing costs | $ | 55,736 | | | $ | 30,700 | | | $ | 25,036 | | | $ | 60,900 | | | $ | 29,580 | | | $ | 31,320 | |
| Deferred leasing incentives | 22,942 | | | 18,076 | | | 4,866 | | | 18,926 | | | 11,133 | | | 7,793 | |
Amortization, including write-offs, of deferred leasing costs and deferred leasing incentives for the three years ended December 31, 2020 were as follows (in thousands):
| | | | | | | | | | | | | | | | | |
| Year Ended December 31, |
| 2020 | | 2019 | | 2018 |
| | | | | |
| Deferred leasing costs amortization | $ | 5,389 | | | $ | 6,599 | | | $ | 5,881 | |
| Deferred leasing incentives amortization | 2,070 | | | 2,862 | | | 2,811 | |
SCHEDULE II
VALUATION AND QUALIFYING ACCOUNTS
FOR THE YEARS ENDED December 31, 2020, 2019 AND 2018
(IN THOUSANDS)
| | | | | | | | | | | | | | | | | | | | | | | |
| Balance at Beginning of Year | | Additions Charged to Expenses | | Net Recoveries | | Balance at End of Year |
| | | | | | | |
| | | | | | | |
| | | | | | | |
| | | | | | | |
| Valuation allowance for deferred tax assets | | | | | | |
| 2020 | $ | 1,402 | | | $ | — | | | $ | — | | | $ | 1,402 | |
| 2019 | $ | 1,419 | | | $ | — | | | $ | (17) | | | $ | 1,402 | |
| 2018 | $ | 1,413 | | | $ | 6 | | | $ | — | | | $ | 1,419 | |
SCHEDULE III
| | | | | | | | | | | | | | | | | | | | | | | | | | | | | | | | | | | | | | | | | | | | | | | | | | | | | | | | | | | | | | | | | | | | | | | | | | | | | | | | |
| | | | | Initial Cost (a) | | Net Improvements (Retirement) since Acquisition | | Gross Amounts at Which Carried at December 31, 2020 | | Accumulated Depreciation at December 31, 2020 | | | | | | | | | | |
| Properties | | Location | | Land | | Buildings and Improvements | | Land | | Buildings and Improvements | | Total (b) | | Year of Construction | | Date of Acquisition | | Net
Rentable
Square
Feet | | Units | | Depreciation Life (c) |
| Multifamily Properties | | | | | | | | | | | | | | | | | | | | | | | | | | |
| 3801 Connecticut Avenue | | Washington, D.C. | | $ | 420,000 | | | $ | 2,678,000 | | | $ | 20,399,000 | | | $ | 420,000 | | | $ | 23,077,000 | | | $ | 23,497,000 | | | $ | 14,646,000 | | | 1951 | | Jan 1963 | | 178,000 | | | 307 | | | 30 years |
| Roosevelt Towers | | Virginia | | 336,000 | | | 1,996,000 | | | 13,915,000 | | | 336,000 | | | 15,911,000 | | | 16,247,000 | | | 12,104,000 | | | 1964 | | May 1965 | | 170,000 | | | 191 | | | 40 years |
| Park Adams | | Virginia | | 287,000 | | | 1,654,000 | | | 14,053,000 | | | 287,000 | | | 15,707,000 | | | 15,994,000 | | | 11,776,000 | | | 1959 | | Jan 1969 | | 173,000 | | | 200 | | | 35 years |
| The Ashby at McLean (e) | | Virginia | | 4,356,000 | | | 17,102,000 | | | 28,435,000 | | | 4,356,000 | | | 45,537,000 | | | 49,893,000 | | | 30,928,000 | | | 1982 | | Aug 1996 | | 274,000 | | | 256 | | | 30 years |
| Bethesda Hill Apartments | | Maryland | | 3,900,000 | | | 13,412,000 | | | 16,664,000 | | | 3,900,000 | | | 30,076,000 | | | 33,976,000 | | | 22,059,000 | | | 1986 | | Nov 1997 | | 225,000 | | | 195 | | | 30 years |
| Bennett Park | | Virginia | | 2,861,000 | | | 917,000 | | | 82,514,000 | | | 4,774,000 | | | 81,518,000 | | | 86,292,000 | | | 43,271,000 | | | 2007 | | Feb 2001 | | 215,000 | | | 224 | | | 28 years |
| The Clayborne | | Virginia | | 269,000 | | | — | | | 31,574,000 | | | 699,000 | | | 31,144,000 | | | 31,843,000 | | | 17,936,000 | | | 2008 | | Jun 2003 | | 60,000 | | | 74 | | | 26 years |
| The Kenmore | | Washington, D.C. | | 28,222,000 | | | 33,955,000 | | | 19,618,000 | | | 28,222,000 | | | 53,573,000 | | | 81,795,000 | | | 19,891,000 | | | 1948 | | Sep 2008 | | 268,000 | | | 374 | | | 30 years |
| The Maxwell | | Virginia | | 12,787,000 | | | — | | | 38,240,000 | | | 12,848,000 | | | 38,179,000 | | | 51,027,000 | | | 12,541,000 | | | 2014 | | Jun 2011 | | 116,000 | | | 163 | | | 30 years |
| Yale West | | Washington, D.C. | | 14,684,000 | | | 62,069,000 | | | 1,775,000 | | | 14,684,000 | | | 63,844,000 | | | 78,528,000 | | | 15,728,000 | | | 2011 | | Feb 2014 | | 173,000 | | | 216 | | | 30 years |
| The Paramount (e) | | Virginia | | 8,568,000 | | | 38,716,000 | | | 3,512,000 | | | 8,568,000 | | | 42,228,000 | | | 50,796,000 | | | 12,922,000 | | | 1984 | | Oct 2013 | | 141,000 | | | 135 | | | 30 years |
| The Wellington | | Virginia | | 30,548,000 | | | 116,563,000 | | | 17,815,000 | | | 30,548,000 | | | 134,378,000 | | | 164,926,000 | | | 27,667,000 | | | 1960 | | Jul 2015 | | 600,000 | | | 711 | | | 30 years |
| Trove (d) | | Virginia | | 15,000,000 | | | — | | | 117,215,000 | | | 15,000,000 | | | 117,215,000 | | | 132,215,000 | | | 3,261,000 | | | 2020 | | Jul 2015 | | 293,000 | | | 401 | | | 30 years |
| Riverside Apartments | | Virginia | | 38,924,000 | | | 184,854,000 | | | 40,324,000 | | | 38,924,000 | | | 225,178,000 | | | 264,102,000 | | | 40,760,000 | | | 1971 | | May 2016 | | 1,001,000 | | | 1,222 | | | 30 years |
| Riverside Apartments land parcel (d) | | Virginia | | 15,968,000 | | | — | | | 12,658,000 | | | — | | | 28,626,000 | | | 28,626,000 | | | — | | | n/a | | May 2016 | | — | | | n/a | | n/a |
| Assembly Alexandria | | Virginia | | 23,942,000 | | | 93,672,000 | | | 5,501,000 | | | 23,942,000 | | | 99,173,000 | | | 123,115,000 | | | 6,474,000 | | | 1990 | | Jun 2019 | | 437,000 | | | 532 | | | 30 years |
| Assembly Manassas | | Virginia | | 13,586,000 | | | 68,802,000 | | | 1,741,000 | | | 13,586,000 | | | 70,543,000 | | | 84,129,000 | | | 4,975,000 | | | 1986 | | Jun 2019 | | 390,000 | | | 408 | | | 30 years |
| Assembly Dulles | | Virginia | | 12,476,000 | | | 66,852,000 | | | 1,964,000 | | | 12,476,000 | | | 68,816,000 | | | 81,292,000 | | | 4,723,000 | | | 2000 | | Jun 2019 | | 361,000 | | | 328 | | | 30 years |
| Assembly Leesburg | | Virginia | | 4,113,000 | | | 21,286,000 | | | 387,000 | | | 4,113,000 | | | 21,673,000 | | | 25,786,000 | | | 1,679,000 | | | 1986 | | Jun 2019 | | 124,000 | | | 134 | | | 30 years |
| Assembly Herndon | | Virginia | | 11,225,000 | | | 51,534,000 | | | 4,023,000 | | | 11,225,000 | | | 55,557,000 | | | 66,782,000 | | | 3,984,000 | | | 1991 | | Jun 2019 | | 221,000 | | | 283 | | | 30 years |
| Assembly Germantown | | Maryland | | 7,609,000 | | | 34,431,000 | | | 1,193,000 | | | 7,609,000 | | | 35,624,000 | | | 43,233,000 | | | 2,566,000 | | | 1990 | | Jun 2019 | | 211,000 | | | 218 | | | 30 years |
| Assembly Watkins Mill | | Maryland | | 7,151,000 | | | 30,851,000 | | | 636,000 | | | 7,151,000 | | | 31,487,000 | | | 38,638,000 | | | 2,207,000 | | | 1975 | | Jun 2019 | | 193,000 | | | 210 | | | 30 years |
| Cascade at Landmark | | Virginia | | 12,289,000 | | | 56,235,000 | | | 1,322,000 | | | 12,289,000 | | | 57,557,000 | | | 69,846,000 | | | 3,627,000 | | | 1988 | | Jun 2019 | | 273,000 | | | 277 | | | 30 years |
| | | | $ | 269,521,000 | | | $ | 897,579,000 | | | $ | 475,478,000 | | | $ | 255,957,000 | | | $ | 1,386,621,000 | | | $ | 1,642,578,000 | | | $ | 315,725,000 | | | | | | | 6,097,000 | | | 7,059 | | | |
| Office Buildings | | | | | | | | | | | | | | | | | | | | | | | | | | |
| 1901 Pennsylvania Avenue | | Washington, D.C. | | $ | 892,000 | | | $ | 3,481,000 | | | $ | 21,602,000 | | | $ | 892,000 | | | $ | 25,083,000 | | | $ | 25,975,000 | | | $ | 19,521,000 | | | 1960 | | May 1977 | | 101,000 | | | | | 28 years |
| 515 King Street | | Virginia | | 4,102,000 | | | 3,931,000 | | | 9,319,000 | | | 4,102,000 | | | 13,250,000 | | | 17,352,000 | | | 7,709,000 | | | 1966 | | Jul 1992 | | 75,000 | | | | | 50 years |
| 1220 19th Street | | Washington, D.C. | | 7,803,000 | | | 11,366,000 | | | 18,609,000 | | | 7,803,000 | | | 29,975,000 | | | 37,778,000 | | | 20,087,000 | | | 1976 | | Nov 1995 | | 103,000 | | | | | 30 years |
| 1600 Wilson Boulevard | | Virginia | | 6,661,000 | | | 16,742,000 | | | 31,803,000 | | | 6,661,000 | | | 48,545,000 | | | 55,206,000 | | | 31,854,000 | | | 1973 | | Oct 1997 | | 171,000 | | | | | 30 years |
| Silverline Center (e) | | Virginia | | 12,049,000 | | | 71,825,000 | | | 104,041,000 | | | 12,049,000 | | | 175,866,000 | | | 187,915,000 | | | 112,929,000 | | | 1972 | | Nov 1997 | | 552,000 | | | | | 30 years |
| Courthouse Square | | Virginia | | — | | | 17,096,000 | | | 10,248,000 | | | — | | | 27,344,000 | | | 27,344,000 | | | 18,712,000 | | | 1979 | | Oct 2000 | | 121,000 | | | | | 30 years |
| 2000 M Street | | Washington, D.C. | | — | | | 61,101,000 | | | 42,983,000 | | | — | | | 104,084,000 | | | 104,084,000 | | | 44,470,000 | | | 1971 | | Dec 2007 | | 233,000 | | | | | 30 years |
| 1140 Connecticut Avenue | | Washington, D.C. | | 25,226,000 | | | 50,495,000 | | | 19,800,000 | | | 25,226,000 | | | 70,295,000 | | | 95,521,000 | | | 27,200,000 | | | 1966 | | Jan 2011 | | 184,000 | | | | | 30 years |
| Fairgate at Ballston | | Virginia | | 17,750,000 | | | 29,885,000 | | | 8,289,000 | | | 17,750,000 | | | 38,174,000 | | | 55,924,000 | | | 14,375,000 | | | 1988 | | Jun 2012 | | 144,000 | | | | | 30 years |
| Army Navy Building | | Washington, D.C. | | 30,796,000 | | | 39,315,000 | | | 13,116,000 | | | 30,796,000 | | | 52,431,000 | | | 83,227,000 | | | 15,831,000 | | | 1912 | | Mar 2014 | | 108,000 | | | | | 30 years |
| 1775 Eye Street, NW | | Washington, D.C. | | 48,086,000 | | | 51,074,000 | | | 20,742,000 | | | 48,086,000 | | | 71,816,000 | | | 119,902,000 | | | 20,606,000 | | | 1964 | | May 2014 | | 189,000 | | | | | 30 years |
| Watergate 600 | | Washington, D.C. | | 45,981,000 | | | 78,325,000 | | | 43,902,000 | | | 45,751,000 | | | 122,457,000 | | | 168,208,000 | | | 19,068,000 | | | 1972 | | Apr 2017 | | 294,000 | | | | | 30 years |
| Arlington Tower | | Virginia | | 63,970,000 | | | 156,525,000 | | | 16,028,000 | | | 63,970,000 | | | 172,553,000 | | | 236,523,000 | | | 22,178,000 | | | 1980 | | Jan 2018 | | 390,000 | | | | | 30 years |
| | | | $ | 263,316,000 | | | $ | 591,161,000 | | | $ | 360,482,000 | | | $ | 263,086,000 | | | $ | 951,873,000 | | | $ | 1,214,959,000 | | | $ | 374,540,000 | | | | | | | 2,665,000 | | | | | |
| | | | | | | | | | | | | | | | | | | | | | | | | | | | | | | | | | | | | | | | | | | | | | | | | | | | | | | | | | | | | | | | | | | | | | | | | | | | | | | | |
| | | | | Initial Cost (a) | | Net Improvements (Retirement) since Acquisition | | Gross Amounts at Which Carried at December 31, 2020 | | Accumulated Depreciation at December 31, 2020 | | | | | | | | | | |
| Properties | | Location | | Land | | Buildings
and
Improvements | | | Land | | Buildings
and
Improvements | | Total (b) | | | Year of
Construction | | Date of Acquisition | | Net
Rentable
Square
Feet | | Units | | Depreciation
Life (c) |
| Retail Centers | | | | | | | | | | | | | | | | | | | | | | | | | | |
| Westminster | | Maryland | | $ | 519,000 | | | $ | 1,775,000 | | | $ | 10,022,000 | | | $ | 519,000 | | | $ | 11,797,000 | | | $ | 12,316,000 | | | $ | 8,938,000 | | | 1969 | | Sep 1972 | | 150,000 | | | | | 37 years |
| Concord Centre | | Virginia | | 413,000 | | | 850,000 | | | 7,628,000 | | | 413,000 | | | 8,478,000 | | | 8,891,000 | | | 4,353,000 | | | 1960 | | Dec 1973 | | 75,000 | | | | | 33 years |
| Takoma Park (e) | | Maryland | | 415,000 | | | 1,084,000 | | | 302,000 | | | 366,000 | | | 1,435,000 | | | 1,801,000 | | | 1,210,000 | | | 1962 | | Jul 1963 | | 51,000 | | | | | 50 years |
| Chevy Chase Metro Plaza | | Washington, D.C. | | 1,549,000 | | | 4,304,000 | | | 8,438,000 | | | 1,549,000 | | | 12,742,000 | | | 14,291,000 | | | 8,743,000 | | | 1975 | | Sep 1985 | | 49,000 | | | | | 50 years |
| 800 S. Washington Street | | Virginia | | 2,904,000 | | | 5,489,000 | | | 6,154,000 | | | 2,904,000 | | | 11,643,000 | | | 14,547,000 | | | 6,562,000 | | | 1955 | | Jun 1998 | | 46,000 | | | | | 30 years |
| Randolph Shopping Center | | Maryland | | 4,928,000 | | | 13,025,000 | | | 1,436,000 | | | 4,928,000 | | | 14,461,000 | | | 19,389,000 | | | 7,369,000 | | | 1972 | | May 2006 | | 83,000 | | | | | 30 years |
| Montrose Shopping Center (e) | | Maryland | | 11,612,000 | | | 22,410,000 | | | 2,604,000 | | | 11,020,000 | | | 25,606,000 | | | 36,626,000 | | | 12,723,000 | | | 1970 | | May 2006 | | 151,000 | | | | | 30 years |
| Spring Valley Village | | Washington, D.C. | | 10,836,000 | | | 32,238,000 | | | 12,760,000 | | | 10,836,000 | | | 44,998,000 | | | 55,834,000 | | | 8,851,000 | | | 1941 | | Oct 2014 | | 94,000 | | | | | 30 years |
| | | | $ | 33,176,000 | | | $ | 81,175,000 | | | $ | 49,344,000 | | | $ | 32,535,000 | | | $ | 131,160,000 | | | $ | 163,695,000 | | | $ | 58,749,000 | | | | | | | 699,000 | | | | | |
| | | | | | | | | | | | | | | | | | | | | | | | | | | | | | | | | | | | | | | | | | | | | | | | | | | | | | | | | | | | | | | | | | | | | | | | | | | | | | | | |
| Total | | | | $ | 566,013,000 | | | $ | 1,569,915,000 | | | $ | 885,304,000 | | | $ | 551,578,000 | | | $ | 2,469,654,000 | | | $ | 3,021,232,000 | | | $ | 749,014,000 | | | | | | | 9,461,000 | | | 7,059 | | | |
______________________________
a) The purchase cost of real estate investments has been divided between land and buildings and improvements on the basis of management’s determination of the fair values.
b) At December 31, 2020, total land, buildings and improvements are carried at $1,920.0 million for federal income tax purposes.
c) The useful life shown is for the main structure. Buildings and improvements are depreciated over various useful lives ranging from 3 to 50 years.
d) As of December 31, 2020, WashREIT had under development multifamily properties, Trove and Riverside Apartments land parcel. The value not yet placed into service at December 31, 2020 was $7.1 million and $28.6 million, respectively.
e) As of December 31, 2020, WashREIT had investments in various development, redevelopment and renovation projects, including The Ashby at McLean, Montrose Shopping Center, Silverline Center, Takoma Park and The Paramount. The total value of these projects, which has not yet been placed in service, is $1.9 million at December 31, 2020.
WASHINGTON REAL ESTATE INVESTMENT TRUST AND SUBSIDIARIES
SUMMARY OF REAL ESTATE INVESTMENTS AND ACCUMULATED DEPRECIATION
(IN THOUSANDS)
The following is a reconciliation of real estate assets and accumulated depreciation for the three years ended December 31, 2020 (in thousands):
| | | | | | | | | | | | | | | | | |
| Year Ended December 31, |
| 2020 | | 2019 | | 2018 |
| Real estate assets | | | | | |
| Balance, beginning of period | $ | 3,159,463 | | | $ | 2,973,816 | | | $ | 2,831,683 | |
| Additions: | | | | | |
Property acquisitions (1) | — | | | 516,054 | | | 220,495 | |
Improvements (1) | 81,119 | | | 140,109 | | | 103,404 | |
| Deductions: | | | | | |
| Impairment write-down | — | | | (24,432) | | | (2,177) | |
| Write-off of disposed assets | (1,694) | | | (7,430) | | | (2,132) | |
| Property sales | (217,656) | | | (438,654) | | | (177,457) | |
| Balance, end of period | $ | 3,021,232 | | | $ | 3,159,463 | | | $ | 2,973,816 | |
| Accumulated depreciation | | | | | |
| Balance, beginning of period | $ | 712,630 | | | $ | 770,535 | | | $ | 690,417 | |
| Additions: | | | | | |
| Depreciation | 106,920 | | | 107,938 | | | 98,141 | |
| Deductions: | | | | | |
| Impairment write-down | — | | | (16,058) | | | (291) | |
| Write-off of disposed assets | (730) | | | (2,173) | | | (1,859) | |
| Property sales | (69,806) | | | (147,612) | | | (15,873) | |
| Balance, end of period | $ | 749,014 | | | $ | 712,630 | | | $ | 770,535 | |
______________________________
(1) Includes non-cash accruals for capital items.