| FOR IMMEDIATE RELEASE | ||||||||
| CONTACT: | 1775 Eye Street, NW, Suite 1000 | |||||||
| Amy Hopkins | Washington, DC 20006 | |||||||
| Vice President, Investor Relations | Tel 202-774-3198 | |||||||
| E-Mail: ahopkins@washreit.com | Fax 301-984-9610 | |||||||
| www.washreit.com | ||||||||
| October 28, 2021 | ||||||||
| WashREIT Announces Third Quarter 2021 Results and Updates Progress on Transformation | ||||||||
| Full Year 2021 | |||||
| Same-Store NOI | |||||
| Multifamily | $90.0 million - $90.5 million | ||||
| Other | ~$12.75 million | ||||
Non-Same-Store NOI (a) | $3.75 million - $4.25 million | ||||
Non-residential NOI (b) | ~$0.8 million | ||||
| Other income | ~$3 million | ||||
| Expenses | |||||
| Property Management Expenses | ~$6.0 million | ||||
| G&A | $26.75 million - $27.25 million | ||||
| Interest Expense | ~$34.0 million | ||||
| Low | High | |||||||
Net income per diluted share | $ | 0.20 | $ | 0.23 | ||||
| Real estate depreciation and amortization | 0.85 | 0.85 | ||||||
| Gain on sale of depreciable real estate | (0.55) | (0.55) | ||||||
| Discontinued real estate depreciation | 0.27 | 0.27 | ||||||
| NAREIT FFO per diluted share | 0.77 | 0.80 | ||||||
| Core adjustments | 0.28 | 0.28 | ||||||
| Core FFO per diluted share | $ | 1.05 | $ | 1.08 | ||||
| WASHINGTON REAL ESTATE INVESTMENT TRUST AND SUBSIDIARIES | |||||||||||||||||||||||
| FINANCIAL HIGHLIGHTS | |||||||||||||||||||||||
| (In thousands, except per share data) | |||||||||||||||||||||||
| (Unaudited) | |||||||||||||||||||||||
| Three Months Ended September 30, | Nine Months Ended September 30, | ||||||||||||||||||||||
| OPERATING RESULTS | 2021 | 2020 | 2021 | 2020 | |||||||||||||||||||
| Revenue | |||||||||||||||||||||||
| Real estate rental revenue | $ | 42,499 | $ | 43,716 | $ | 124,403 | $ | 133,216 | |||||||||||||||
| Expenses | |||||||||||||||||||||||
| Property operating and maintenance | 9,901 | 10,372 | 28,655 | 29,598 | |||||||||||||||||||
| Real estate taxes and insurance | 5,544 | 5,741 | 16,525 | 17,420 | |||||||||||||||||||
| Property management | 1,499 | 1,541 | 4,448 | 4,682 | |||||||||||||||||||
| General and administrative | 7,909 | 6,330 | 19,838 | 17,963 | |||||||||||||||||||
| Transformation costs | 1,016 | — | 4,796 | — | |||||||||||||||||||
| Depreciation and amortization | 18,252 | 18,064 | 52,542 | 52,683 | |||||||||||||||||||
| 44,121 | 42,048 | 126,804 | 122,346 | ||||||||||||||||||||
| Loss on sale of real estate | — | — | — | (7,539) | |||||||||||||||||||
| Real estate operating (loss) income | (1,622) | 1,668 | (2,401) | 3,331 | |||||||||||||||||||
| Other income (expense) | |||||||||||||||||||||||
| Interest expense | (8,106) | (8,711) | (28,387) | (28,307) | |||||||||||||||||||
| Loss on interest rate derivatives | (106) | — | (5,866) | — | |||||||||||||||||||
| (Loss) gain on extinguishment of debt | (12,727) | — | (12,727) | 262 | |||||||||||||||||||
| Other income | 231 | — | 3,037 | — | |||||||||||||||||||
| (20,708) | (8,711) | (43,943) | (28,045) | ||||||||||||||||||||
| Loss from continuing operations | (22,330) | (7,043) | (46,344) | (24,714) | |||||||||||||||||||
| Discontinued operations: | |||||||||||||||||||||||
| Income from operations of properties sold or held for sale | 7,208 | 6,087 | 23,083 | 20,071 | |||||||||||||||||||
| Gain on sale of real estate, net | 46,441 | — | 46,441 | — | |||||||||||||||||||
| Income from discontinued operations | 53,649 | 6,087 | 69,524 | 20,071 | |||||||||||||||||||
| Net income (loss) | $ | 31,319 | $ | (956) | $ | 23,180 | $ | (4,643) | |||||||||||||||
| Loss from continuing operations | $ | (22,330) | $ | (7,043) | $ | (46,344) | $ | (24,714) | |||||||||||||||
| Depreciation and amortization | 18,252 | 18,064 | 52,542 | 52,683 | |||||||||||||||||||
| Loss on sale of depreciable real estate | — | — | — | 7,539 | |||||||||||||||||||
| Funds from continuing operations | (4,078) | 11,021 | 6,198 | 35,508 | |||||||||||||||||||
| Income from discontinued operations | 53,649 | 6,087 | 69,524 | 20,071 | |||||||||||||||||||
| Discontinued operations real estate depreciation and amortization | — | 12,406 | 22,904 | 37,106 | |||||||||||||||||||
| Gain on sale of real estate, net | (46,441) | — | (46,441) | — | |||||||||||||||||||
| Funds from discontinued operations | 7,208 | 18,493 | 45,987 | 57,177 | |||||||||||||||||||
| NAREIT funds from operations | $ | 3,130 | $ | 29,514 | $ | 52,185 | $ | 92,685 | |||||||||||||||
| Non-cash loss (gain) on extinguishment of debt | $ | 833 | $ | — | $ | 833 | $ | (1,177) | |||||||||||||||
| Tenant improvements and incentives, net of reimbursements | (331) | (4,013) | (904) | (6,962) | |||||||||||||||||||
| External and internal leasing commissions capitalized | (378) | (1,081) | (2,784) | (2,407) | |||||||||||||||||||
| Recurring capital improvements | (1,485) | (1,068) | (3,508) | (2,880) | |||||||||||||||||||
| Straight-line rents, net | (347) | (522) | (1,520) | (1,840) | |||||||||||||||||||
| Non-cash fair value interest expense | — | — | — | (59) | |||||||||||||||||||
| Non-real estate depreciation & amortization of debt costs | 1,330 | 956 | 4,024 | 2,808 | |||||||||||||||||||
| Amortization of lease intangibles, net | (32) | 464 | 540 | 1,465 | |||||||||||||||||||
| Amortization and expensing of restricted share and unit compensation | 2,651 | 2,479 | 6,478 | 5,901 | |||||||||||||||||||
| Adjusted funds from operations | $ | 5,371 | $ | 26,729 | $ | 55,344 | $ | 87,534 | |||||||||||||||
| Three Months Ended September 30, | Nine Months Ended September 30, | |||||||||||||||||||||||||
| Per share data: | 2021 | 2020 | 2021 | 2020 | ||||||||||||||||||||||
| Loss from continuing operations | (Basic) | $ | (0.26) | $ | (0.09) | $ | (0.55) | $ | (0.31) | |||||||||||||||||
| (Diluted) | $ | (0.26) | $ | (0.09) | $ | (0.55) | $ | (0.31) | ||||||||||||||||||
| Net income (loss) | (Basic) | $ | 0.37 | $ | (0.01) | $ | 0.27 | $ | (0.06) | |||||||||||||||||
| (Diluted) | $ | 0.37 | $ | (0.01) | $ | 0.27 | $ | (0.06) | ||||||||||||||||||
| NAREIT FFO | (Basic) | $ | 0.04 | $ | 0.36 | $ | 0.61 | $ | 1.12 | |||||||||||||||||
| (Diluted) | $ | 0.04 | $ | 0.36 | $ | 0.61 | $ | 1.12 | ||||||||||||||||||
| Dividends paid | $ | 0.17 | $ | 0.30 | $ | 0.77 | $ | 0.90 | ||||||||||||||||||
| Weighted average shares outstanding - basic | 84,496 | 82,186 | 84,457 | 82,142 | ||||||||||||||||||||||
| Weighted average shares outstanding - diluted | 84,496 | 82,186 | 84,457 | 82,142 | ||||||||||||||||||||||
| Weighted average shares outstanding - diluted (for NAREIT FFO) | 84,586 | 82,357 | 84,534 | 82,322 | ||||||||||||||||||||||
| WASHINGTON REAL ESTATE INVESTMENT TRUST AND SUBSIDIARIES | |||||||||||
| CONSOLIDATED BALANCE SHEETS | |||||||||||
| (In thousands, except per share data) | |||||||||||
| (Unaudited) | |||||||||||
| September 30, 2021 | December 31, 2020 | ||||||||||
| Assets | |||||||||||
| Land | $ | 306,507 | $ | 301,709 | |||||||
| Income producing property | 1,544,217 | 1,473,335 | |||||||||
| 1,850,724 | 1,775,044 | ||||||||||
| Accumulated depreciation and amortization | (384,392) | (335,006) | |||||||||
| Net income producing property | 1,466,332 | 1,440,038 | |||||||||
| Properties under development or held for future development | 30,254 | 36,494 | |||||||||
| Total real estate held for investment, net | 1,496,586 | 1,476,532 | |||||||||
| Investment in real estate held for sale, net | — | 795,687 | |||||||||
| Cash and cash equivalents | 307,797 | 7,697 | |||||||||
| Restricted cash | 605 | 593 | |||||||||
| Rents and other receivables | 14,713 | 9,725 | |||||||||
| Prepaid expenses and other assets | 33,109 | 29,587 | |||||||||
| Other assets related to properties sold or held for sale | — | 89,997 | |||||||||
| Total assets | $ | 1,852,810 | $ | 2,409,818 | |||||||
| Liabilities | |||||||||||
| Notes payable, net | $ | 496,823 | $ | 945,370 | |||||||
| Line of credit | — | 42,000 | |||||||||
| Accounts payable and other liabilities | 38,864 | 44,067 | |||||||||
| Dividend payable | 14,440 | 25,361 | |||||||||
| Advance rents | 1,747 | 2,461 | |||||||||
| Tenant security deposits | 4,480 | 4,221 | |||||||||
| Other liabilities related to properties sold or held for sale | — | 25,229 | |||||||||
| Total liabilities | 556,354 | 1,088,709 | |||||||||
| Equity | |||||||||||
| Shareholders' equity | |||||||||||
| Preferred shares; $0.01 par value; 10,000 shares authorized; no shares issued or outstanding | — | — | |||||||||
Shares of beneficial interest, $0.01 par value; 150,000 and 100,000 shares authorized; 84,628 and 84,409 shares issued and outstanding, as of September 30, 2021 and December 31, 2020, respectively | 846 | 844 | |||||||||
| Additional paid in capital | 1,656,821 | 1,649,366 | |||||||||
| Distributions in excess of net income | (341,052) | (298,860) | |||||||||
| Accumulated other comprehensive loss | (20,468) | (30,563) | |||||||||
| Total shareholders' equity | 1,296,147 | 1,320,787 | |||||||||
| Noncontrolling interests in subsidiaries | 309 | 322 | |||||||||
| Total equity | 1,296,456 | 1,321,109 | |||||||||
| Total liabilities and equity | $ | 1,852,810 | $ | 2,409,818 | |||||||
| The following tables contain reconciliations of net loss for the periods presented (in thousands): | |||||||||||||||||||||||
| Three Months Ended September 30, | Nine Months Ended September 30, | ||||||||||||||||||||||
| 2021 | 2020 | 2021 | 2020 | ||||||||||||||||||||
| Net income (loss) | $ | 31,319 | $ | (956) | $ | 23,180 | $ | (4,643) | |||||||||||||||
| Adjustments: | |||||||||||||||||||||||
| Property management | 1,499 | 1,541 | 4,448 | 4,682 | |||||||||||||||||||
| General and administrative | 7,909 | 6,330 | 19,838 | 17,963 | |||||||||||||||||||
| Transformation costs | 1,016 | — | 4,796 | — | |||||||||||||||||||
| Real estate depreciation and amortization | 18,252 | 18,064 | 52,542 | 52,683 | |||||||||||||||||||
| Loss on sale of real estate | — | — | — | 7,539 | |||||||||||||||||||
| Interest expense | 8,106 | 8,711 | 28,387 | 28,307 | |||||||||||||||||||
| Loss on interest rate derivatives | 106 | — | 5,866 | — | |||||||||||||||||||
| Loss (gain) on extinguishment of debt | 12,727 | — | 12,727 | (262) | |||||||||||||||||||
| Other income | (231) | — | (3,037) | — | |||||||||||||||||||
| Discontinued operations: | |||||||||||||||||||||||
| Income from operations of properties sold or held for sale | (7,208) | (6,087) | (23,083) | (20,071) | |||||||||||||||||||
| Gain on sale of real estate, net | (46,441) | — | (46,441) | — | |||||||||||||||||||
| Total Net Operating Income (NOI) | $ | 27,054 | $ | 27,603 | $ | 79,223 | $ | 86,198 | |||||||||||||||
| Multifamily NOI: | |||||||||||||||||||||||
| Same-store portfolio | $ | 22,405 | $ | 22,494 | $ | 67,052 | $ | 69,654 | |||||||||||||||
| Acquisitions | 276 | — | 276 | — | |||||||||||||||||||
| Development | 1,000 | 34 | 1,732 | (199) | |||||||||||||||||||
| Non-residential | 219 | 104 | $ | 575 | $ | 387 | |||||||||||||||||
| Total | 23,900 | 22,632 | 69,635 | 69,842 | |||||||||||||||||||
| Watergate 600 NOI | 3,154 | 3,316 | 9,588 | 9,748 | |||||||||||||||||||
Other NOI (1) | — | 1,655 | — | 6,608 | |||||||||||||||||||
| Total NOI | $ | 27,054 | $ | 27,603 | $ | 79,223 | $ | 86,198 | |||||||||||||||
| The following table contains a reconciliation of net income (loss) to core funds from operations for the periods presented (in thousands, except per share data): | ||||||||||||||||||||||||||
| Three Months Ended September 30, | Nine Months Ended September 30, | |||||||||||||||||||||||||
| 2021 | 2020 | 2021 | 2020 | |||||||||||||||||||||||
| Net income (loss) | $ | 31,319 | $ | (956) | $ | 23,180 | $ | (4,643) | ||||||||||||||||||
| Add: | ||||||||||||||||||||||||||
| Real estate depreciation and amortization | 18,252 | 18,064 | 52,542 | 52,683 | ||||||||||||||||||||||
| Loss on sale of depreciable real estate | — | — | — | 7,539 | ||||||||||||||||||||||
| Discontinued operations: | ||||||||||||||||||||||||||
| Gain on sale of real estate, net | (46,441) | — | (46,441) | — | ||||||||||||||||||||||
| Real estate depreciation and amortization | — | 12,406 | 22,904 | 37,106 | ||||||||||||||||||||||
| NAREIT funds from operations | 3,130 | 29,514 | 52,185 | 92,685 | ||||||||||||||||||||||
| Add: | ||||||||||||||||||||||||||
| Loss (gain) on extinguishment of debt | 12,727 | — | 12,727 | (262) | ||||||||||||||||||||||
| Loss on interest rate derivatives | 106 | — | 5,866 | — | ||||||||||||||||||||||
| Severance expense | — | — | 173 | — | ||||||||||||||||||||||
| Transformation costs | 1,016 | — | 4,796 | — | ||||||||||||||||||||||
| Core funds from operations | $ | 16,979 | $ | 29,514 | $ | 75,747 | $ | 92,423 | ||||||||||||||||||
| Three Months Ended September 30, | Nine Months Ended September 30, | |||||||||||||||||||||||||
| Per share data: | 2021 | 2020 | 2021 | 2020 | ||||||||||||||||||||||
| NAREIT FFO | (Basic) | $ | 0.04 | $ | 0.36 | $ | 0.61 | $ | 1.12 | |||||||||||||||||
| (Diluted) | $ | 0.04 | $ | 0.36 | $ | 0.61 | $ | 1.12 | ||||||||||||||||||
| Core FFO | (Basic) | $ | 0.20 | $ | 0.36 | $ | 0.89 | $ | 1.12 | |||||||||||||||||
| (Diluted) | $ | 0.20 | $ | 0.36 | $ | 0.89 | $ | 1.12 | ||||||||||||||||||
| Weighted average shares outstanding - basic | 84,496 | 82,186 | 84,457 | 82,142 | ||||||||||||||||||||||
| Weighted average shares outstanding - diluted (for NAREIT and Core FFO) | 84,586 | 82,357 | 84,534 | 82,322 | ||||||||||||||||||||||
| Non-GAAP Financial Measures | ||||||||||||||
| Other Definitions | ||||||||||||||
| Table of Contents |  | ||||
September 30, 2021 | |||||
| Schedule | Page | |||||||
| Key Financial Data | ||||||||
| Portfolio Analysis | ||||||||
Net Operating Income (NOI) - Multifamily | ||||||||
Same-Store Operating Results - Multifamily | ||||||||
Same-Store Operating Expenses - Multifamily | ||||||||
| Growth and Strategy | ||||||||
Acquisition and Disposition Summary | ||||||||
| Schedule of Properties | ||||||||
| Capital Analysis | ||||||||
| Summary of Changes to our Supplemental Financial Information | ||||||||||||||
| Nine Months Ended | Three Months Ended | ||||||||||||||||||||||||||||||||||||||||
| 9/30/2021 | 9/30/2020 | 9/30/2021 | 6/30/2021 | 03/31/2021 | 12/31/2020 | 09/30/2020 | |||||||||||||||||||||||||||||||||||
| Real estate rental revenue | $ | 111,075 | $ | 108,942 | $ | 38,046 | $ | 36,862 | 36,167 | 36,196 | 36,292 | ||||||||||||||||||||||||||||||
| Real estate expenses | (45,531) | (43,083) | (15,527) | (14,832) | (15,172) | (15,032) | (14,988) | ||||||||||||||||||||||||||||||||||
| NOI (including property management expenses) | 65,544 | 65,859 | 22,519 | 22,030 | 20,995 | 21,164 | 21,304 | ||||||||||||||||||||||||||||||||||
| Deduct: property management expenses | 4,091 | 3,983 | 1,381 | 1,364 | 1,346 | 1,280 | 1,328 | ||||||||||||||||||||||||||||||||||
| NOI (excluding property management expenses) | $ | 69,635 | $ | 69,842 | $ | 23,900 | $ | 23,394 | $ | 22,341 | $ | 22,444 | $ | 22,632 | |||||||||||||||||||||||||||
| Operating margin (including property management expenses) | 59 | % | 60 | % | 59 | % | 60 | % | 58 | % | 58 | % | 59 | % | |||||||||||||||||||||||||||
| Operating margin (excluding property management expenses) | 63 | % | 64 | % | 63 | % | 63 | % | 62 | % | 62 | % | 62 | % | |||||||||||||||||||||||||||
Consolidated Statements of Operations (In thousands, except per share data) (Unaudited) | | ||||
| Nine Months Ended | Three Months Ended | ||||||||||||||||||||||||||||||||||||||||
| OPERATING RESULTS | 9/30/2021 | 9/30/2020 | 9/30/2021 | 6/30/2021 | 3/31/2021 | 12/31/2020 | 9/30/2020 | ||||||||||||||||||||||||||||||||||
| Revenues | |||||||||||||||||||||||||||||||||||||||||
| Real estate rental revenue | $ | 124,403 | $ | 133,216 | $ | 42,499 | $ | 41,297 | $ | 40,607 | $ | 42,788 | $ | 43,716 | |||||||||||||||||||||||||||
| Expenses | |||||||||||||||||||||||||||||||||||||||||
| Property operating and maintenance | (28,655) | (29,598) | (9,901) | (9,359) | (9,395) | (10,027) | (10,372) | ||||||||||||||||||||||||||||||||||
| Real estate taxes and insurance | (16,525) | (17,420) | (5,544) | (5,385) | (5,596) | (5,937) | (5,741) | ||||||||||||||||||||||||||||||||||
| Property management | (4,448) | (4,682) | (1,499) | (1,486) | (1,463) | (1,463) | (1,541) | ||||||||||||||||||||||||||||||||||
| General and administrative | (19,838) | (17,963) | (7,909) | (6,325) | (5,604) | (5,988) | (6,330) | ||||||||||||||||||||||||||||||||||
| Transformation costs | (4,796) | — | (1,016) | (3,780) | — | — | — | ||||||||||||||||||||||||||||||||||
| Depreciation and amortization | (52,542) | (52,683) | (18,252) | (17,303) | (16,987) | (17,653) | (18,064) | ||||||||||||||||||||||||||||||||||
| (126,804) | (122,346) | (44,121) | (43,638) | (39,045) | (41,068) | (42,048) | |||||||||||||||||||||||||||||||||||
| Loss on sale of real estate | — | (7,539) | — | — | — | (7,470) | — | ||||||||||||||||||||||||||||||||||
| Real estate operating (loss) income | (2,401) | 3,331 | (1,622) | (2,341) | 1,562 | (5,750) | 1,668 | ||||||||||||||||||||||||||||||||||
| Other income (expense) | |||||||||||||||||||||||||||||||||||||||||
| Interest expense | (28,387) | (28,307) | (8,106) | (10,158) | (10,123) | (8,998) | (8,711) | ||||||||||||||||||||||||||||||||||
| Loss on interest rate derivatives | (5,866) | — | (106) | (5,760) | — | (560) | — | ||||||||||||||||||||||||||||||||||
| (Loss) gain on extinguishment of debt | (12,727) | 262 | (12,727) | — | — | (296) | — | ||||||||||||||||||||||||||||||||||
| Other income | 3,037 | — | 231 | 1,522 | 1,284 | — | — | ||||||||||||||||||||||||||||||||||
| Loss from continuing operations | (46,344) | (24,714) | (22,330) | (16,737) | (7,277) | (15,604) | (7,043) | ||||||||||||||||||||||||||||||||||
| Discontinued operations: | |||||||||||||||||||||||||||||||||||||||||
| Income from operations of properties sold or held for sale | 23,083 | 20,071 | 7,208 | 9,745 | 6,130 | 4,567 | 6,087 | ||||||||||||||||||||||||||||||||||
| Gain on sale of real estate, net | 46,441 | — | 46,441 | — | — | — | — | ||||||||||||||||||||||||||||||||||
| Income from discontinued operations | 69,524 | 20,071 | 53,649 | 9,745 | 6,130 | 4,567 | 6,087 | ||||||||||||||||||||||||||||||||||
| Net income (loss) | $ | 23,180 | $ | (4,643) | $ | 31,319 | $ | (6,992) | $ | (1,147) | $ | (11,037) | $ | (956) | |||||||||||||||||||||||||||
| Per Share Data: | |||||||||||||||||||||||||||||||||||||||||
| Net income (loss) | $ | 0.27 | $ | (0.06) | $ | 0.37 | $ | (0.08) | $ | (0.02) | $ | (0.13) | $ | (0.01) | |||||||||||||||||||||||||||
| Fully diluted weighted average shares outstanding | 84,457 | 82,142 | 84,496 | 84,461 | 84,413 | 82,962 | 82,186 | ||||||||||||||||||||||||||||||||||
| Percentage of Revenues: | |||||||||||||||||||||||||||||||||||||||||
| General and administrative expenses | 15.9 | % | 13.5 | % | 18.6 | % | 15.3 | % | 13.8 | % | 14.0 | % | 14.5 | % | |||||||||||||||||||||||||||
| Ratios: | |||||||||||||||||||||||||||||||||||||||||
| Adjusted EBITDA / Interest expense | 3.7 | x | 4.3 | x | 3.1 | x | 4.0 | x | 3.9 | x | 4.1 | x | 4.4 | x | |||||||||||||||||||||||||||
| Net income (loss) / Real estate rental revenue | 18.6 | % | (3.5) | % | 73.7 | % | (16.9) | % | (2.8) | % | (25.8) | % | (2.2) | % | |||||||||||||||||||||||||||
Consolidated Balance Sheets (In thousands, except per share data) (Unaudited) | | ||||
| 9/30/2021 | 6/30/2021 | 3/31/2021 | 12/31/2020 | 9/30/2020 | |||||||||||||||||||||||||
| Assets | |||||||||||||||||||||||||||||
| Land | $ | 306,507 | $ | 301,709 | $ | 301,709 | $ | 301,709 | $ | 324,155 | |||||||||||||||||||
| Income producing property | 1,544,217 | 1,490,975 | 1,483,774 | 1,473,335 | 1,542,440 | ||||||||||||||||||||||||
| 1,850,724 | 1,792,684 | 1,785,483 | 1,775,044 | 1,866,595 | |||||||||||||||||||||||||
| Accumulated depreciation and amortization | (384,392) | (367,519) | (351,133) | (335,006) | (369,116) | ||||||||||||||||||||||||
| Net income producing property | 1,466,332 | 1,425,165 | 1,434,350 | 1,440,038 | 1,497,479 | ||||||||||||||||||||||||
| Properties under development or held for future development | 30,254 | 30,065 | 29,718 | 36,494 | 76,359 | ||||||||||||||||||||||||
| Total real estate held for investment, net | 1,496,586 | 1,455,230 | 1,464,068 | 1,476,532 | 1,573,838 | ||||||||||||||||||||||||
| Investment in real estate held for sale, net | — | 779,121 | 785,763 | 795,687 | 802,203 | ||||||||||||||||||||||||
| Cash and cash equivalents | 307,797 | 5,435 | 3,015 | 7,697 | 3,810 | ||||||||||||||||||||||||
| Restricted cash | 605 | 595 | 566 | 593 | 606 | ||||||||||||||||||||||||
| Rents and other receivables | 14,713 | 12,916 | 11,329 | 9,725 | 18,132 | ||||||||||||||||||||||||
| Prepaid expenses and other assets | 33,109 | 28,297 | 28,126 | 29,587 | 39,540 | ||||||||||||||||||||||||
| Other assets related to properties sold or held for sale | — | 86,811 | 87,169 | 89,997 | 94,143 | ||||||||||||||||||||||||
| Total assets | $ | 1,852,810 | $ | 2,368,405 | $ | 2,380,036 | $ | 2,409,818 | $ | 2,532,272 | |||||||||||||||||||
| Liabilities | |||||||||||||||||||||||||||||
| Notes payable, net | $ | 496,823 | $ | 945,905 | $ | 945,634 | $ | 945,370 | $ | 897,443 | |||||||||||||||||||
| Line of credit | — | 43,000 | 33,000 | 42,000 | 186,000 | ||||||||||||||||||||||||
| Accounts payable and other liabilities | 38,864 | 47,897 | 44,241 | 44,067 | 81,579 | ||||||||||||||||||||||||
| Dividend payable | 14,440 | 25,474 | 25,424 | 25,361 | 24,767 | ||||||||||||||||||||||||
| Advance rents | 1,747 | 1,572 | 1,667 | 2,461 | 2,104 | ||||||||||||||||||||||||
| Tenant security deposits | 4,480 | 4,374 | 4,256 | 4,221 | 4,731 | ||||||||||||||||||||||||
| Other liabilities related to properties sold or held for sale | — | 23,748 | 26,912 | 25,229 | 28,533 | ||||||||||||||||||||||||
| Total liabilities | 556,354 | 1,091,970 | 1,081,134 | 1,088,709 | 1,225,157 | ||||||||||||||||||||||||
| Equity | |||||||||||||||||||||||||||||
| Preferred shares; $0.01 par value; 10,000 shares authorized | — | — | — | — | — | ||||||||||||||||||||||||
| Shares of beneficial interest, $0.01 par value; 150,000 shares authorized | 846 | 846 | 846 | 844 | 824 | ||||||||||||||||||||||||
| Additional paid-in capital | 1,656,821 | 1,654,409 | 1,651,680 | 1,649,366 | 1,601,160 | ||||||||||||||||||||||||
| Distributions in excess of net income | (341,052) | (357,934) | (325,469) | (298,860) | (262,435) | ||||||||||||||||||||||||
| Accumulated other comprehensive loss | (20,468) | (21,200) | (28,473) | (30,563) | (32,759) | ||||||||||||||||||||||||
| Total shareholders' equity | 1,296,147 | 1,276,121 | 1,298,584 | 1,320,787 | 1,306,790 | ||||||||||||||||||||||||
| Noncontrolling interests in subsidiaries | 309 | 314 | 318 | 322 | 325 | ||||||||||||||||||||||||
| Total equity | 1,296,456 | 1,276,435 | 1,298,902 | 1,321,109 | 1,307,115 | ||||||||||||||||||||||||
| Total liabilities and equity | $ | 1,852,810 | $ | 2,368,405 | $ | 2,380,036 | $ | 2,409,818 | $ | 2,532,272 | |||||||||||||||||||
Funds from Operations (In thousands, except per share data) (Unaudited) | | ||||
| Nine Months Ended | Three Months Ended | ||||||||||||||||||||||||||||||||||||||||
| 9/30/2021 | 9/30/2020 | 9/30/2021 | 6/30/2021 | 3/31/2021 | 12/31/2020 | 9/30/2020 | |||||||||||||||||||||||||||||||||||
Funds from operations (FFO) (1) | |||||||||||||||||||||||||||||||||||||||||
| Net income (loss) | $ | 23,180 | $ | (4,643) | $ | 31,319 | $ | (6,992) | $ | (1,147) | $ | (11,037) | $ | (956) | |||||||||||||||||||||||||||
| Real estate depreciation and amortization | 52,542 | 52,683 | 18,252 | 17,303 | 16,987 | 17,653 | 18,064 | ||||||||||||||||||||||||||||||||||
| Loss on sale of depreciable real estate | — | 7,539 | — | — | — | 7,470 | — | ||||||||||||||||||||||||||||||||||
| Discontinued operations: | |||||||||||||||||||||||||||||||||||||||||
| Gain on sale of depreciable real estate, net | (46,441) | — | (46,441) | — | — | — | — | ||||||||||||||||||||||||||||||||||
| Real estate depreciation and amortization | 22,904 | 37,106 | — | 10,248 | 12,656 | 12,588 | 12,406 | ||||||||||||||||||||||||||||||||||
| NAREIT funds from operations (FFO) | 52,185 | 92,685 | 3,130 | 20,559 | 28,496 | 26,674 | 29,514 | ||||||||||||||||||||||||||||||||||
| Loss (gain) on extinguishment of debt | 12,727 | (262) | 12,727 | — | — | 296 | — | ||||||||||||||||||||||||||||||||||
| Loss on interest rate derivatives | 5,866 | — | 106 | 5,760 | — | 560 | — | ||||||||||||||||||||||||||||||||||
| Severance expense | 173 | — | — | — | 173 | — | — | ||||||||||||||||||||||||||||||||||
| Transformation costs | 4,796 | — | 1,016 | 3,780 | — | — | — | ||||||||||||||||||||||||||||||||||
Core FFO (1) | $ | 75,747 | $ | 92,423 | $ | 16,979 | $ | 30,099 | $ | 28,669 | $ | 27,530 | $ | 29,514 | |||||||||||||||||||||||||||
Allocation to participating securities (2) | (349) | (453) | (73) | (137) | (139) | (92) | (151) | ||||||||||||||||||||||||||||||||||
| NAREIT FFO per share - basic | $ | 0.61 | $ | 1.12 | $ | 0.04 | $ | 0.24 | $ | 0.34 | $ | 0.32 | $ | 0.36 | |||||||||||||||||||||||||||
| NAREIT FFO per share - fully diluted | $ | 0.61 | $ | 1.12 | $ | 0.04 | $ | 0.24 | $ | 0.34 | $ | 0.32 | $ | 0.36 | |||||||||||||||||||||||||||
| Core FFO per share - fully diluted | $ | 0.89 | $ | 1.12 | $ | 0.20 | $ | 0.35 | $ | 0.34 | $ | 0.33 | $ | 0.36 | |||||||||||||||||||||||||||
| Common dividend per share | $ | 0.77 | $ | 0.90 | $ | 0.17 | $ | 0.30 | $ | 0.30 | $ | 0.30 | $ | 0.30 | |||||||||||||||||||||||||||
| Average shares - basic | 84,457 | 82,142 | 84,496 | 84,461 | 84,413 | 82,962 | 82,186 | ||||||||||||||||||||||||||||||||||
| Average shares - fully diluted (for NAREIT FFO and Core FFO) | 84,534 | 82,322 | 84,586 | 84,519 | 84,495 | 83,093 | 82,357 | ||||||||||||||||||||||||||||||||||
______________________________ | |||||||||||||||||||||||||||||||||||||||||
(1) See "Definitions" on page 11 for the definitions of NAREIT FFO and Core FFO. | |||||||||||||||||||||||||||||||||||||||||
(2) Adjustment to the numerators for FFO and Core FFO per share calculations when applying the two-class method for calculating EPS. | |||||||||||||||||||||||||||||||||||||||||
Adjusted Funds from Operations (In thousands, except per share data) (Unaudited) | | ||||
| Nine Months Ended | Three Months Ended | ||||||||||||||||||||||||||||||||||||||||
| 9/30/2021 | 9/30/2020 | 9/30/2021 | 6/30/2021 | 3/31/2021 | 12/31/2020 | 9/30/2020 | |||||||||||||||||||||||||||||||||||
Adjusted funds from operations (AFFO) (1) | |||||||||||||||||||||||||||||||||||||||||
| NAREIT FFO | $ | 52,185 | $ | 92,685 | $ | 3,130 | $ | 20,559 | $ | 28,496 | $ | 26,674 | $ | 29,514 | |||||||||||||||||||||||||||
| Non-cash loss (gain) on extinguishment of debt | 833 | (1,177) | 833 | — | — | 296 | — | ||||||||||||||||||||||||||||||||||
| Tenant improvements and incentives, net of reimbursements | (904) | (6,962) | (331) | (1,112) | 539 | (6,250) | (4,013) | ||||||||||||||||||||||||||||||||||
| External leasing commissions capitalized | (2,784) | (2,407) | (378) | (1,868) | (538) | (1,445) | (1,081) | ||||||||||||||||||||||||||||||||||
| Recurring capital improvements | (3,508) | (2,880) | (1,485) | (1,156) | (867) | (2,164) | (1,068) | ||||||||||||||||||||||||||||||||||
| Straight-line rent, net | (1,520) | (1,840) | (347) | (625) | (548) | 82 | (522) | ||||||||||||||||||||||||||||||||||
| Non-cash fair value interest expense | — | (59) | — | — | — | — | — | ||||||||||||||||||||||||||||||||||
| Non-real estate depreciation and amortization of debt costs | 4,024 | 2,808 | 1,330 | 1,350 | 1,344 | 987 | 956 | ||||||||||||||||||||||||||||||||||
| Amortization of lease intangibles, net | 540 | 1,465 | (32) | 195 | 377 | 477 | 464 | ||||||||||||||||||||||||||||||||||
Amortization and expensing of restricted share and unit compensation (2) | 6,478 | 5,901 | 2,651 | 2,163 | 1,664 | 1,972 | 2,479 | ||||||||||||||||||||||||||||||||||
| AFFO | 55,344 | 87,534 | 5,371 | 19,506 | 30,467 | 20,629 | 26,729 | ||||||||||||||||||||||||||||||||||
| Cash loss on extinguishment of debt | 11,894 | 915 | 11,894 | — | — | — | — | ||||||||||||||||||||||||||||||||||
| Loss on interest rate derivatives | 5,866 | — | 106 | 5,760 | — | 560 | — | ||||||||||||||||||||||||||||||||||
| Non-share-based severance expense | 103 | — | — | — | 103 | — | — | ||||||||||||||||||||||||||||||||||
Transformation costs (3) | 4,376 | — | 674 | 3,703 | — | — | — | ||||||||||||||||||||||||||||||||||
Core AFFO (1) | $ | 77,583 | $ | 88,449 | $ | 18,045 | $ | 28,969 | $ | 30,570 | $ | 21,189 | $ | 26,729 | |||||||||||||||||||||||||||
______________________________ | |||||||||||||||||||||||||||||||||||||||||
(1) See "Definitions" on page 11 for the definitions of AFFO and Core AFFO. This measure was previously called Funds Available for Distribution ("FAD"). There were no material changes made to the definition. | |||||||||||||||||||||||||||||||||||||||||
(2) Includes share award modifications related to transformation costs | |||||||||||||||||||||||||||||||||||||||||
(3) Excludes share award modifications related to transformation costs | |||||||||||||||||||||||||||||||||||||||||
Net Operating Income (NOI) - Multifamily (Dollars In thousands) | | ||||
| Apartment Homes as of 9/30/2021 | Nine Months Ended | Three Months Ended | |||||||||||||||||||||||||||||||||||||||||||||
| 9/30/2021 | 9/30/2020 | 9/30/2021 | 6/30/2021 | 3/31/2021 | 12/31/2020 | 9/30/2020 | |||||||||||||||||||||||||||||||||||||||||
| Rental and other property revenues | |||||||||||||||||||||||||||||||||||||||||||||||
Same-store (1) | 6,658 | $ | 105,641 | $ | 107,651 | $ | 35,408 | $ | 35,321 | $ | 34,912 | $ | 35,205 | $ | 35,674 | ||||||||||||||||||||||||||||||||
Acquisitions (2) | 240 | 488 | — | 488 | — | — | — | — | |||||||||||||||||||||||||||||||||||||||
Development (3) | 401 | 4,152 | 696 | 1,846 | 1,330 | 976 | 698 | 445 | |||||||||||||||||||||||||||||||||||||||
Non-residential (4) | N/A | 794 | 595 | 304 | 211 | 279 | 293 | 173 | |||||||||||||||||||||||||||||||||||||||
| Total rental and other property revenues | 7,299 | 111,075 | 108,942 | 38,046 | 36,862 | 36,167 | 36,196 | 36,292 | |||||||||||||||||||||||||||||||||||||||
| Property operating expenses | |||||||||||||||||||||||||||||||||||||||||||||||
| Same-store | 38,589 | 37,997 | 13,003 | 12,550 | 13,036 | 12,996 | 13,180 | ||||||||||||||||||||||||||||||||||||||||
| Acquisitions | 212 | — | 212 | — | — | — | — | ||||||||||||||||||||||||||||||||||||||||
| Development | 2,420 | 895 | 846 | 853 | 721 | 684 | 411 | ||||||||||||||||||||||||||||||||||||||||
| Non-residential | 219 | 208 | 85 | 65 | 69 | 72 | 69 | ||||||||||||||||||||||||||||||||||||||||
| Total property operating expenses | 41,440 | 39,100 | 14,146 | 13,468 | 13,826 | 13,752 | 13,660 | ||||||||||||||||||||||||||||||||||||||||
| Net Operating Income (NOI) | |||||||||||||||||||||||||||||||||||||||||||||||
| Same-store | 67,052 | 69,654 | 22,405 | 22,771 | 21,876 | 22,209 | 22,494 | ||||||||||||||||||||||||||||||||||||||||
| Acquisitions | 276 | — | 276 | — | — | — | — | ||||||||||||||||||||||||||||||||||||||||
| Development | 1,732 | (199) | 1,000 | 477 | 255 | 14 | 34 | ||||||||||||||||||||||||||||||||||||||||
| Non-residential | 575 | 387 | 219 | 146 | 210 | 221 | 104 | ||||||||||||||||||||||||||||||||||||||||
| Total NOI | $ | 69,635 | $ | 69,842 | $ | 23,900 | $ | 23,394 | $ | 22,341 | $ | 22,444 | $ | 22,632 | |||||||||||||||||||||||||||||||||
| Same-store metrics | |||||||||||||||||||||||||||||||||||||||||||||||
| Operating margin | 63 | % | 65 | % | 63 | % | 64 | % | 63 | % | 63 | % | 63 | % | |||||||||||||||||||||||||||||||||
| Retention | 56 | % | 59 | % | 60 | % | 57 | % | 51 | % | 51 | % | 58 | % | |||||||||||||||||||||||||||||||||
| Effective lease rate growth | |||||||||||||||||||||||||||||||||||||||||||||||
| New | (5.5) | % | (5.2) | % | 3.2 | % | (8.1) | % | (15.0) | % | (15.1) | % | (8.7) | % | |||||||||||||||||||||||||||||||||
| Renewal | 3.8 | % | 2.2 | % | 5.1 | % | 3.5 | % | 1.9 | % | 2.6 | % | 1.4 | % | |||||||||||||||||||||||||||||||||
| Blended | (0.6) | % | (0.9) | % | 4.3 | % | (2.1) | % | (6.8) | % | (6.4) | % | (3.1) | % | |||||||||||||||||||||||||||||||||
Same-Store Operating Results - Multifamily (Dollars in thousands, except Average Effective Monthly Rent per Home) | | ||||
| Rental and Other Property Revenue | Property Operating Expenses | Net Operating Income | Average Occupancy | Average Effective Monthly Rent per Home | ||||||||||||||||||||||||||||||||||||||||||||||||||||||||||||||||||||||||||||||||||||||||||||||
| Quarter-to-Date Comparison | Apt Homes | Q3 2021 | Q3 2020 | % Chg | Q3 2021 | Q3 2020 | % Chg | Q3 2021 | Q3 2020 | % Chg | Q3 2021 | Q3 2020 | % Chg | Q3 2021 | Q3 2020 | % Chg | ||||||||||||||||||||||||||||||||||||||||||||||||||||||||||||||||||||||||||||||||||
| Virginia | 5,138 | $ | 27,650 | $ | 27,810 | (0.6) | % | $ | 10,072 | $ | 10,259 | (1.8) | % | $ | 17,578 | $ | 17,551 | 0.2 | % | 95.8 | % | 94.6 | % | 1.3 | % | $ | 1,665 | $ | 1,711 | (2.7) | % | |||||||||||||||||||||||||||||||||||||||||||||||||||||||||||||||||||
| DC / Maryland | 1,520 | 7,758 | 7,864 | (1.3) | % | 2,931 | 2,921 | 0.3 | % | 4,827 | 4,943 | (2.3) | % | 95.8 | % | 93.4 | % | 2.6 | % | 1,672 | 1,740 | (3.9) | % | |||||||||||||||||||||||||||||||||||||||||||||||||||||||||||||||||||||||||||
| DC Metro Total | 6,658 | $ | 35,408 | $ | 35,674 | (0.7) | % | $ | 13,003 | $ | 13,180 | (1.3) | % | $ | 22,405 | $ | 22,494 | (0.4) | % | 95.8 | % | 94.3 | % | 1.6 | % | $ | 1,666 | $ | 1,717 | (3.0) | % | |||||||||||||||||||||||||||||||||||||||||||||||||||||||||||||||||||
| Sequential Comparison | Apt Homes | Q3 2021 | Q2 2021 | % Chg | Q3 2021 | Q2 2021 | % Chg | Q3 2021 | Q2 2021 | % Chg | Q3 2021 | Q2 2021 | % Chg | Q3 2021 | Q2 2021 | % Chg | ||||||||||||||||||||||||||||||||||||||||||||||||||||||||||||||||||||||||||||||||||
| Virginia | 5,138 | $ | 27,650 | $ | 27,507 | 0.5 | % | $ | 10,072 | $ | 9,568 | 5.3 | % | $ | 17,578 | $ | 17,939 | (2.0) | % | 95.8 | % | 95.3 | % | 0.5 | % | $ | 1,665 | $ | 1,657 | 0.5 | % | |||||||||||||||||||||||||||||||||||||||||||||||||||||||||||||||||||
| DC / Maryland | 1,520 | 7,758 | 7,814 | (0.7) | % | 2,931 | 2,982 | (1.7) | % | 4,827 | 4,832 | (0.1) | % | 95.8 | % | 94.3 | % | 1.6 | % | 1,672 | 1,685 | (0.8) | % | |||||||||||||||||||||||||||||||||||||||||||||||||||||||||||||||||||||||||||
| DC Metro Total | 6,658 | $ | 35,408 | $ | 35,321 | 0.2 | % | $ | 13,003 | $ | 12,550 | 3.6 | % | $ | 22,405 | $ | 22,771 | (1.6) | % | 95.8 | % | 95.1 | % | 0.7 | % | $ | 1,666 | $ | 1,664 | 0.1 | % | |||||||||||||||||||||||||||||||||||||||||||||||||||||||||||||||||||
| Year-to-Date Comparison | Apt Homes | YTD 2021 | YTD 2020 | % Chg | YTD 2021 | YTD 2020 | % Chg | YTD 2021 | YTD 2020 | % Chg | YTD 2021 | YTD 2020 | % Chg | YTD 2021 | YTD 2020 | % Chg | ||||||||||||||||||||||||||||||||||||||||||||||||||||||||||||||||||||||||||||||||||
| Virginia | 5,138 | $ | 82,466 | $ | 83,523 | (1.3) | % | $ | 29,737 | $ | 29,625 | 0.4 | % | $ | 52,729 | $ | 53,898 | (2.2) | % | 95.4 | % | 94.9 | % | 0.5 | % | $ | 1,665 | $ | 1,719 | (3.1) | % | |||||||||||||||||||||||||||||||||||||||||||||||||||||||||||||||||||
| DC / Maryland | 1,520 | 23,175 | 24,128 | (3.9) | % | 8,852 | 8,372 | 5.7 | % | 14,323 | 15,756 | (9.1) | % | 94.0 | % | 94.2 | % | (0.2) | % | 1,690 | 1,767 | (4.4) | % | |||||||||||||||||||||||||||||||||||||||||||||||||||||||||||||||||||||||||||
| DC Metro Total | 6,658 | $ | 105,641 | $ | 107,651 | (1.9) | % | $ | 38,589 | $ | 37,997 | 1.6 | % | $ | 67,052 | $ | 69,654 | (3.7) | % | 95.1 | % | 94.7 | % | 0.4 | % | $ | 1,671 | $ | 1,730 | (3.4) | % | |||||||||||||||||||||||||||||||||||||||||||||||||||||||||||||||||||
Same-Store Operating Expenses - Multifamily (In thousands) | | ||||
| Quarter-to-Date Comparison | Q3 2021 | Q3 2020 | $ Change | % Change | % of Q3 2021 Total | ||||||||||||||||||||||||
Controllable (1) | $ | 6,591 | $ | 6,827 | $ | (236) | (3.5) | % | 50.7 | % | |||||||||||||||||||
Non-Controllable (2) | 6,412 | 6,353 | 59 | 0.9 | % | 49.3 | % | ||||||||||||||||||||||
| Total same-store operating expenses | $ | 13,003 | $ | 13,180 | $ | (177) | (1.3) | % | 100.0 | % | |||||||||||||||||||
| Sequential Comparison | Q3 2021 | Q2 2021 | $ Change | % Change | % of Q3 2021 Total | ||||||||||||||||||||||||
| Controllable | $ | 6,591 | $ | 6,586 | $ | 5 | 0.1 | % | 50.7 | % | |||||||||||||||||||
| Non-Controllable | 6,412 | 5,964 | 448 | 7.5 | % | 49.3 | % | ||||||||||||||||||||||
| Total same-store operating expenses | $ | 13,003 | $ | 12,550 | $ | 453 | 3.6 | % | 100.0 | % | |||||||||||||||||||
| Year-to-Date Comparison | YTD 2021 | YTD 2020 | $ Change | % Change | % of YTD 2021 Total | ||||||||||||||||||||||||
| Controllable | $ | 19,600 | $ | 19,285 | $ | 315 | 1.6 | % | 50.8 | % | |||||||||||||||||||
| Non-Controllable | 18,989 | 18,712 | 277 | 1.5 | % | 49.2 | % | ||||||||||||||||||||||
| Total same-store operating expenses | $ | 38,589 | $ | 37,997 | $ | 592 | 1.6 | % | 100.0 | % | |||||||||||||||||||
______________________________ | ||
(1) Controllable operating expenses consist of: | ||
| Payroll, Repairs & Maintenance, Marketing, Administrative and other | ||
(2) Non-Controllable operating expenses consist of: | ||
| Utilities, Insurance and Real Estate Taxes | ||
Acquisition and Disposition Summary (Dollars in thousands) | | ||||
Acquisitions (1) | |||||||||||||||||||||||||||||
| Location | Acquisition Date | Number of Homes | September 30, 2021 Average Occupancy (YTD) | Contract Purchase Price (in thousands) | |||||||||||||||||||||||||
| The Oxford | Conyers, GA | August 10, 2021 | 240 | 93.5% | $ | 48,000 | |||||||||||||||||||||||
| Dispositions | |||||||||||||||||||||||||||||
| Location | Disposition Date | Square Feet | Contract Sales Price (in thousands) | GAAP (Loss) gain on Sale (in thousands) | |||||||||||||||||||||||||
Office Portfolio (2) | VA, DC | July 26, 2021 | 2,370,000 | $ | 766,000 | $ | (11,220) | ||||||||||||||||||||||
Retail Portfolio (3) | VA, DC, MD | September 22, 2021 | 693,000 | 168,314 | 57,661 | ||||||||||||||||||||||||
| 3,063,000 | $ | 934,314 | $ | 46,441 | |||||||||||||||||||||||||
______________________________ | |||||||||||||||||||||||||||||
(1) Subsequent to the end of the third quarter of 2021, we executed a purchase and sale agreement to acquire additional residential communities in the Southeast region for a contract sales price of $106.0 million. | |||||||||||||||||||||||||||||
(2) Office Portfolio consists of twelve office properties: 1901 Pennsylvania Avenue, 515 King Street, 1220 19th Street, 1600 Wilson Boulevard, Silverline Center, Courthouse Square, 2000 M Street, 1140 Connecticut Avenue, Army Navy Club, 1775 Eye Street, Fairgate at Ballston and Arlington Tower. | |||||||||||||||||||||||||||||
(3) Retail Portfolio consists of eight retail properties: Takoma Park, Westminster, Concord Centre, Chevy Chase Metro Plaza, 800 S. Washington Street, Randolph Shopping Center, Montrose Shopping Center and Spring Valley Village. | |||||||||||||||||||||||||||||
| Multifamily Communities | | ||||
| September 30, 2021 | |||||
| Property | Location | Apartment Homes | Current Strategy | Year Acquired | Year Built | Average Occupancy (1) | Ending Occupancy | % of Total Portfolio NOI (1) | |||||||||||||||||||||
| Virginia | |||||||||||||||||||||||||||||
| Assembly Alexandria | Alexandria, VA | 532 | B Value-Add | 2019 | 1990 | 95.5% | 97.0% | 7% | |||||||||||||||||||||
| Cascade at Landmark | Alexandria, VA | 277 | B Value-Add | 2019 | 1988 | 95.0% | 94.6% | 4% | |||||||||||||||||||||
| Clayborne | Alexandria, VA | 74 | A- | N/A | 2008 | 96.2% | 97.3% | 1% | |||||||||||||||||||||
| Riverside Apartments | Alexandria, VA | 1,222 | B Value-Add | 2016 | 1971 | 94.7% | 95.5% | 14% | |||||||||||||||||||||
| Bennett Park | Arlington, VA | 224 | A- | N/A | 2007 | 96.5% | 96.4% | 5% | |||||||||||||||||||||
| Park Adams | Arlington, VA | 200 | B | 1969 | 1959 | 95.3% | 96.5% | 3% | |||||||||||||||||||||
| The Maxwell | Arlington, VA | 163 | A- | N/A | 2014 | 95.9% | 95.7% | 2% | |||||||||||||||||||||
| The Paramount | Arlington, VA | 135 | B | 2013 | 1984 | 95.9% | 97.8% | 2% | |||||||||||||||||||||
| The Wellington | Arlington, VA | 711 | B Value Add | 2015 | 1960 | 94.8% | 95.5% | 8% | |||||||||||||||||||||
| Trove | Arlington, VA | 401 | A | N/A | 2020 | 52.9% | 82.8% | 2% | |||||||||||||||||||||
| Roosevelt Towers | Falls Church, VA | 191 | B | 1965 | 1964 | 95.8% | 97.4% | 2% | |||||||||||||||||||||
| Assembly Dulles | Herndon, VA | 328 | B Value-Add | 2019 | 2000 | 95.9% | 97.6% | 4% | |||||||||||||||||||||
| Assembly Herndon | Herndon, VA | 283 | B Value-Add | 2019 | 1991 | 95.0% | 97.5% | 3% | |||||||||||||||||||||
| Assembly Leesburg | Leesburg, VA | 134 | B | 2019 | 1986 | 96.5% | 96.3% | 2% | |||||||||||||||||||||
| Assembly Manassas | Manassas, VA | 408 | B Value-Add | 2019 | 1986 | 95.7% | 95.1% | 5% | |||||||||||||||||||||
| The Ashby at McLean | McLean, VA | 256 | B | 1996 | 1982 | 96.6% | 96.9% | 5% | |||||||||||||||||||||
| Washington, DC | |||||||||||||||||||||||||||||
| 3801 Connecticut Avenue | Washington, DC | 307 | B Value-Add | 1963 | 1951 | 92.6% | 96.4% | 3% | |||||||||||||||||||||
| Kenmore Apartments | Washington, DC | 374 | B Value-Add | 2008 | 1948 | 91.3% | 94.4% | 4% | |||||||||||||||||||||
| Yale West | Washington, DC | 216 | A- | 2014 | 2011 | 95.4% | 95.4% | 4% | |||||||||||||||||||||
| Maryland | |||||||||||||||||||||||||||||
| Bethesda Hill Apartments | Bethesda, MD | 195 | B | 1997 | 1986 | 95.8% | 95.9% | 3% | |||||||||||||||||||||
| Assembly Germantown | Germantown, MD | 218 | B Value-Add | 2019 | 1990 | 95.4% | 97.7% | 2% | |||||||||||||||||||||
| Assembly Watkins Mill | Gaithersburg, MD | 210 | B | 2019 | 1975 | 96.7% | 96.7% | 2% | |||||||||||||||||||||
Georgia | |||||||||||||||||||||||||||||
| The Oxford | Conyers, GA | 240 | B | 2021 | 1999 | 93.5% | 95.4% | <1% | |||||||||||||||||||||
| Office Properties | | ||||
| September 30, 2021 | |||||
| Property | Location | Year Acquired | Year Built | Net Rentable Square Feet | Leased % (1) | Ending Occupancy (1) | % of Total Portfolio NOI (2) | |||||||||||||||||||||||||||||||||||||
| Washington, DC | ||||||||||||||||||||||||||||||||||||||||||||
| Watergate 600 | Washington, DC | 2017 | 1972/1997 | 295,000 | 91.2% | 88.4% | 12 | % | ||||||||||||||||||||||||||||||||||||
Adjusted Earnings Before Interest, Taxes, Depreciation and Amortization (EBITDA) (In thousands) (Unaudited) | | ||||
| Nine Months Ended | Three Months Ended | ||||||||||||||||||||||||||||||||||||||||
| 9/30/2021 | 9/30/2020 | 9/30/2021 | 6/30/2021 | 3/31/2021 | 12/31/2020 | 9/30/2020 | |||||||||||||||||||||||||||||||||||
Adjusted EBITDA (1) | |||||||||||||||||||||||||||||||||||||||||
| Net income (loss) | $ | 23,180 | $ | (4,643) | $ | 31,319 | $ | (6,992) | $ | (1,147) | $ | (11,037) | $ | (956) | |||||||||||||||||||||||||||
| Add/(deduct): | |||||||||||||||||||||||||||||||||||||||||
| Interest expense | 28,387 | 28,307 | 8,106 | 10,158 | 10,123 | 8,998 | 8,711 | ||||||||||||||||||||||||||||||||||
| Real estate depreciation and amortization | 75,446 | 89,789 | 18,252 | 27,551 | 29,643 | 30,241 | 30,470 | ||||||||||||||||||||||||||||||||||
| Non-real estate depreciation | 701 | 713 | 234 | 234 | 233 | 229 | 234 | ||||||||||||||||||||||||||||||||||
| Severance expense | 173 | — | — | — | 173 | — | — | ||||||||||||||||||||||||||||||||||
| Transformation costs | 4,796 | — | 1,016 | 3,780 | — | — | — | ||||||||||||||||||||||||||||||||||
| (Gain) loss on sale of depreciable real estate, net | (46,441) | 7,539 | (46,441) | — | — | 7,470 | — | ||||||||||||||||||||||||||||||||||
| Loss (gain) on extinguishment of debt | 12,727 | (262) | 12,727 | — | — | 296 | — | ||||||||||||||||||||||||||||||||||
| Loss on interest rate derivatives | 5,866 | — | 106 | 5,760 | — | 560 | — | ||||||||||||||||||||||||||||||||||
| Adjusted EBITDA | $ | 104,835 | $ | 121,443 | $ | 25,319 | $ | 40,491 | $ | 39,025 | $ | 36,757 | $ | 38,459 | |||||||||||||||||||||||||||
______________________________ | |||||||||||||||||||||||||||||||||||||||||
(1) Adjusted EBITDA is earnings before interest expense, taxes, depreciation, amortization, gain/loss on sale of real estate, casualty gain/loss, real estate impairment, gain/loss on extinguishment of debt, gain/loss on interest rate derivatives, severance expense, acquisition expenses, gain from non-disposal activities and transformation costs. We consider Adjusted EBITDA to be an appropriate supplemental performance measure because it permits investors to view income from operations without the effect of depreciation, and the cost of debt or non-operating gains and losses. Adjusted EBITDA is a non-GAAP measure. | |||||||||||||||||||||||||||||||||||||||||
Long Term Debt Analysis ($'s in thousands) | | ||||
| 9/30/2021 | 6/30/2021 | 3/31/2021 | 12/31/2020 | 9/30/2020 | |||||||||||||||||||||||||
| Balances Outstanding | |||||||||||||||||||||||||||||
| Unsecured | |||||||||||||||||||||||||||||
| Fixed rate bonds | $ | 396,993 | $ | 696,387 | $ | 696,174 | $ | 695,968 | $ | 348,522 | |||||||||||||||||||
| Term loan | 99,830 | 249,518 | 249,460 | 249,402 | 548,921 | ||||||||||||||||||||||||
| Credit facility | — | 43,000 | 33,000 | 42,000 | 186,000 | ||||||||||||||||||||||||
| Total | $ | 496,823 | $ | 988,905 | $ | 978,634 | $ | 987,370 | $ | 1,083,443 | |||||||||||||||||||
| Weighted Average Interest Rates | |||||||||||||||||||||||||||||
| Unsecured | |||||||||||||||||||||||||||||
| Fixed rate bonds | 4.5 | % | 4.3 | % | 4.3 | % | 4.3 | % | 4.5 | % | |||||||||||||||||||
Term loan (1) | 2.3 | % | 2.9 | % | 2.9 | % | 2.9 | % | 2.6 | % | |||||||||||||||||||
| Credit facility | — | % | 1.1 | % | 1.1 | % | 1.1 | % | 1.1 | % | |||||||||||||||||||
| Weighted Average | 4.1 | % | 3.8 | % | 3.8 | % | 3.8 | % | 3.0 | % | |||||||||||||||||||
______________________________ | |||||||||||||||||||||||||||||
(1) WashREIT has entered into an interest rate swap to effectively fix the floating interest rate on its total $100.0 million aggregate principal of its term loan outstanding as of September 30, 2021 (see page 27). | |||||||||||||||||||||||||||||
Note: The current debt balances outstanding are shown net of discounts, premiums and unamortized debt costs (see page 27). | |||||||||||||||||||||||||||||
Long Term Debt Maturities (in thousands, except average interest rates) | | ||||
| September 30, 2021 | |||||
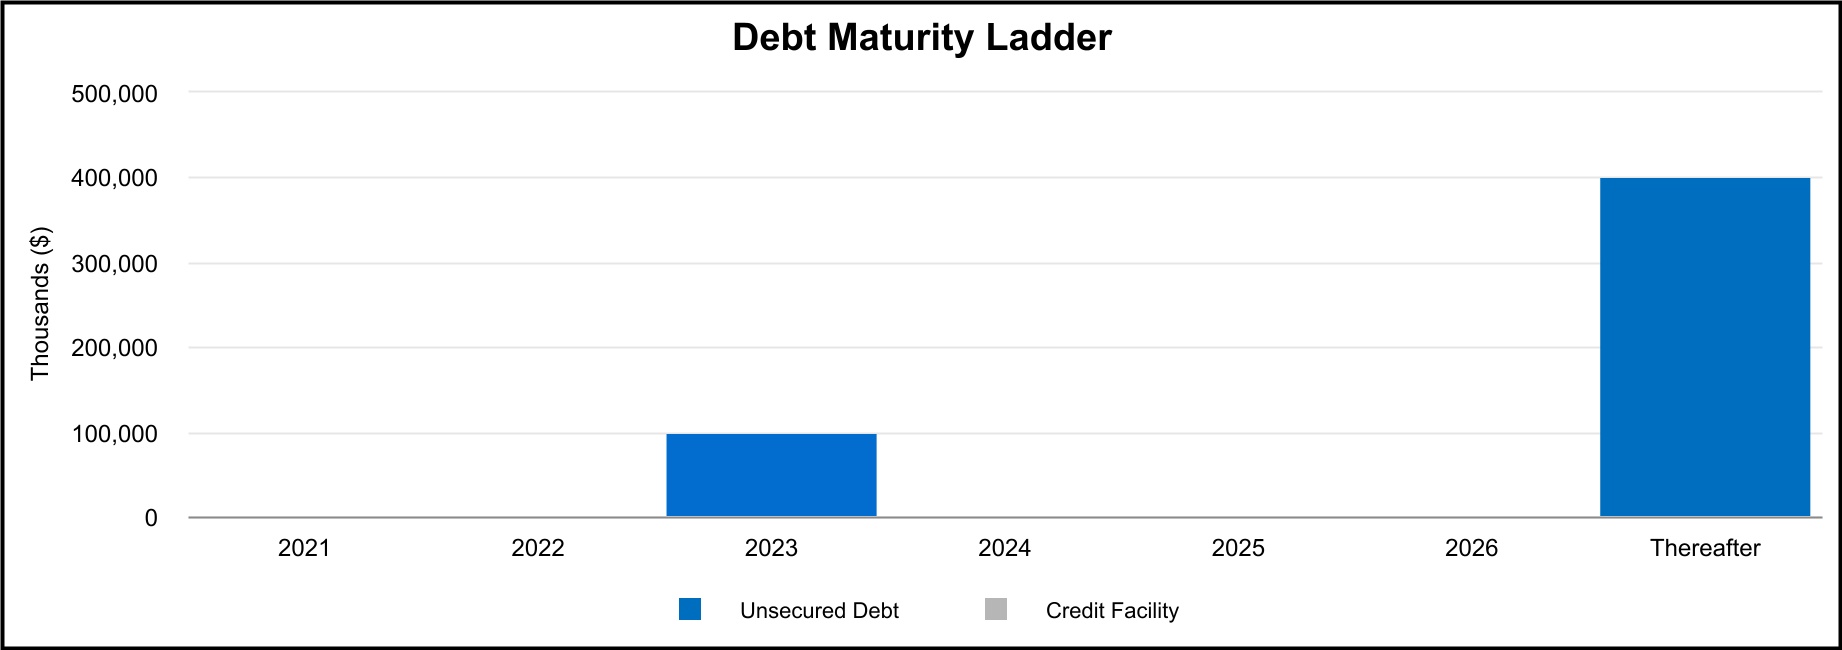
| Future Maturities of Debt | ||||||||||||||||||||||||||
| Year | Unsecured Debt | Credit Facility | Total Debt | Avg Interest Rate | ||||||||||||||||||||||
| 2021 | $ | — | $ | — | $ | — | —% | |||||||||||||||||||
| 2022 | — | — | — | —% | ||||||||||||||||||||||
| 2023 | 100,000 | (1) | — | 100,000 | 2.3% | |||||||||||||||||||||
| 2024 | — | — | — | —% | ||||||||||||||||||||||
| 2025 | — | — | — | —% | ||||||||||||||||||||||
| 2026 | — | — | — | —% | ||||||||||||||||||||||
| Thereafter | 400,000 | — | 400,000 | 4.5% | ||||||||||||||||||||||
| Scheduled principal payments | $ | 500,000 | $ | — | $ | 500,000 | 4.1% | |||||||||||||||||||
| Net discounts/premiums | (144) | — | (144) | |||||||||||||||||||||||
| Loan costs, net of amortization | (3,033) | — | (3,033) | |||||||||||||||||||||||
| Total maturities | $ | 496,823 | $ | — | $ | 496,823 | 4.1% | |||||||||||||||||||
Debt Covenant Compliance | | ||||
| Unsecured Public Debt Covenants | Unsecured Private Debt Covenants | ||||||||||||||||||||||||||||||||||
| Notes Payable | Line of Credit and Term Loans | Notes Payable | |||||||||||||||||||||||||||||||||
| Quarter Ended September 30, 2021 | Covenant | Quarter Ended September 30, 2021 | Covenant | Quarter Ended September 30, 2021 | Covenant | ||||||||||||||||||||||||||||||
% of Total Indebtedness to Total Assets(1) | 28.1 | % | ≤ 65.0% | N/A | N/A | N/A | N/A | ||||||||||||||||||||||||||||
| Ratio of Income Available for Debt Service to Annual Debt Service | 3.5 | ≥ 1.5 | N/A | N/A | N/A | N/A | |||||||||||||||||||||||||||||
% of Secured Indebtedness to Total Assets(1) | — | % | ≤ 40.0% | N/A | N/A | N/A | N/A | ||||||||||||||||||||||||||||
Ratio of Total Unencumbered Assets(2) to Total Unsecured Indebtedness | 3.6 | ≥ 1.5 | N/A | N/A | N/A | N/A | |||||||||||||||||||||||||||||
% of Net Consolidated Total Indebtedness to Consolidated Total Asset Value(3) | N/A | N/A | 10.1 | % | ≤ 60.0% | 10.1 | % | ≤ 60.0% | |||||||||||||||||||||||||||
Ratio of Consolidated Adjusted EBITDA(4) to Consolidated Fixed Charges(5) | N/A | N/A | 3.46 | ≥ 1.50 | 3.46 | ≥ 1.50 | |||||||||||||||||||||||||||||
% of Consolidated Secured Indebtedness to Consolidated Total Asset Value(3) | N/A | N/A | — | % | ≤ 40.0% | — | % | ≤ 40.0% | |||||||||||||||||||||||||||
% of Consolidated Unsecured Indebtedness to Unencumbered Pool Value(6) | N/A | N/A | 10.1 | % | ≤ 60.0% | 10.1 | % | ≤ 60.0% | |||||||||||||||||||||||||||
______________________________ | |||||||||||||||||||||||||||||||||||
(1) Total Assets is calculated by applying a capitalization rate of 7.50% to the EBITDA(4) from the last four consecutive quarters, excluding EBITDA from acquired, disposed, and non-stabilized development properties. | |||||||||||||||||||||||||||||||||||
(2) Total Unencumbered Assets is calculated by applying a capitalization rate of 7.50% to the EBITDA(4) from unencumbered properties from the last four consecutive quarters, excluding EBITDA from acquired, disposed, and non-stabilized development properties. | |||||||||||||||||||||||||||||||||||
(3) Consolidated Total Asset Value is the sum of unrestricted cash plus the quotient of applying a capitalization rate to the annualized NOI from the most recently ended quarter for each asset class, excluding NOI from disposed properties, acquisitions during the past 6 quarters, development, major redevelopment and low occupancy properties. To this amount, we add the purchase price of acquisitions during the past 6 quarters plus values for development, major redevelopment and low occupancy properties. | |||||||||||||||||||||||||||||||||||
(4) Consolidated Adjusted EBITDA is defined as earnings before noncontrolling interests, depreciation, amortization, interest expense, income tax expense, acquisition costs, extraordinary, unusual or nonrecurring transactions including sale of assets, impairment, gains and losses on extinguishment of debt and other non-cash charges. | |||||||||||||||||||||||||||||||||||
(5) Consolidated Fixed Charges consist of interest expense excluding capitalized interest and amortization of deferred financing costs, principal payments and preferred dividends, if any. | |||||||||||||||||||||||||||||||||||
(6) Unencumbered Pool Value is the sum of unrestricted cash plus the quotient of applying a capitalization rate to the annualized NOI from unencumbered properties from the most recently ended quarter for each asset class excluding NOI from disposed properties, acquisitions during the past 6 quarters, development, major redevelopment and low occupancy properties. To this we add the purchase price of unencumbered acquisitions during the past 6 quarters and values for unencumbered development, major redevelopment and low occupancy properties. | |||||||||||||||||||||||||||||||||||
Capital Analysis (In thousands, except per share amounts) | | ||||
| Three Months Ended | |||||||||||||||||||||||||||||||||||||||||
| 9/30/2021 | 6/30/2021 | 3/31/2021 | 12/31/2020 | 9/30/2020 | |||||||||||||||||||||||||||||||||||||
| Market Data | |||||||||||||||||||||||||||||||||||||||||
| Shares Outstanding | 84,628 | 84,590 | 84,564 | 84,409 | 82,351 | ||||||||||||||||||||||||||||||||||||
| Market Price per Share | $ | 24.75 | $ | 23.00 | $ | 22.10 | $ | 21.63 | $ | 20.13 | |||||||||||||||||||||||||||||||
| Equity Market Capitalization | $ | 2,094,543 | $ | 1,945,570 | $ | 1,868,864 | $ | 1,825,767 | $ | 1,657,726 | |||||||||||||||||||||||||||||||
| Total Debt | $ | 496,823 | $ | 988,905 | $ | 978,634 | $ | 987,370 | $ | 1,083,443 | |||||||||||||||||||||||||||||||
| Total Market Capitalization | $ | 2,591,366 | $ | 2,934,475 | $ | 2,847,498 | $ | 2,813,137 | $ | 2,741,169 | |||||||||||||||||||||||||||||||
| Total Debt to Market Capitalization | 0.19 | :1 | 0.34 | :1 | 0.34 | :1 | 0.35 | :1 | 0.40 | :1 | |||||||||||||||||||||||||||||||
Earnings to Fixed Charges(1) | -1.7x | -0.6x | 0.3x | -0.7x | 0.2x | ||||||||||||||||||||||||||||||||||||
Debt Service Coverage Ratio(2) | 3.1x | 4.0x | 3.9x | 4.1x | 4.4x | ||||||||||||||||||||||||||||||||||||
| Dividend Data | Nine Months Ended | Three Months Ended | |||||||||||||||||||||||||||||||||||||||
| 9/30/2021 | 9/30/2020 | 9/30/2021 | 6/30/2021 | 3/31/2021 | 12/31/2020 | 9/30/2020 | |||||||||||||||||||||||||||||||||||
| Total Dividends Declared | $ | 65,372 | $ | 74,387 | $ | 14,437 | $ | 25,473 | $ | 25,462 | $ | 25,388 | $ | 24,806 | |||||||||||||||||||||||||||
| Common Dividend Declared per Share | $ | 0.77 | $ | 0.90 | $ | 0.17 | $ | 0.30 | $ | 0.30 | $ | 0.30 | $ | 0.30 | |||||||||||||||||||||||||||
| Payout Ratio (Core FFO basis) | 86.5 | % | 80.4 | % | 85.0 | % | 85.7 | % | 88.2 | % | 90.9 | % | 83.3 | % | |||||||||||||||||||||||||||
| Payout Ratio (Core AFFO basis) | 84.6 | % | 84.1 | % | |||||||||||||||||||||||||||||||||||||
______________________________ | |||||||||||||||||||||||||||||||||||||||||
(1) The ratio of earnings to fixed charges is computed by dividing earnings by fixed charges. For this purpose, earnings consist of income from continuing operations attributable to the controlling interests plus fixed charges, less capitalized interest. Fixed charges consist of interest expense, including amortized costs of debt issuance, plus interest costs capitalized. The earnings to fixed charges ratio includes loss on extinguishment of debt of $12.7 million for the three months ended September 30, 2021, loss on interest rate derivatives of $5.8 million for the three months ended June 30, 2021 and loss on sale of real estate of $7.5 million for the three months ended December 31, 2020. | |||||||||||||||||||||||||||||||||||||||||
(2) Debt service coverage ratio is computed by dividing Adjusted EBITDA (see page 25) by interest expense and principal amortization. | |||||||||||||||||||||||||||||||||||||||||