| | | | | | | | |
| |
| CONTACT: | | 1775 Eye Street, NW, Suite 1000 |
| Amy Hopkins | Washington, DC 20006 |
| Vice President, Investor Relations | Tel 202-774-3198 |
| E-Mail: ahopkins@washreit.com | Fax 301-984-9610 |
| www.washreit.com |
| |
| | April 27, 2022 |
| | |
| WashREIT Announces First Quarter 2022 Results and Updates Progress on Southeast Expansion |
Washington Real Estate Investment Trust (“WashREIT” or the “Company”) (NYSE: WRE), a multifamily REIT with properties in the Washington metro area and the Southeast, reported financial and operating results today for the quarter ended March 31, 2022:
Financial Results
•Net loss was $7.7 million, or $0.09 per diluted share
•NAREIT FFO was $14.5 million, or $0.17 per diluted share
•Core FFO was $0.20 per diluted share
Operational Highlights
•Net Operating Income (NOI) was $30.7 million
•Same-store multifamily NOI increased by 7.9% compared to the prior year period and is building for the second half of 2022
•Effective new Lease Rate Growth was 10.0%, effective renewal Lease Rate Growth was 9.2%, and effective blended Lease Rate Growth was 9.5% during the quarter for our same-store portfolio
•Effective new Lease Rate Growth was 16.0%, effective renewal Lease Rate Growth was 12.5%, and effective blended Lease Rate Growth was 13.8% during the quarter for our Atlanta portfolio
•For leases signed thus far in April, we achieved blended effective lease rate growth of 20.5% for our Atlanta portfolio and 11.5% for our same-store portfolio
•Same-store retention increased to 71% compared to 51% in the first quarter of 2021
•Same-store multifamily Average Occupancy increased 150 basis points from the first quarter of 2021 to 95.8%
•Same-store multifamily Ending Occupancy increased 80 basis points from the first quarter of 2021 to 95.7% as of March 31, 2022 and 96.0% as of April 18, 2022
Transformation Update
•Expect to close on the acquisition of two multifamily communities in Cobb County, Georgia for a combined purchase price of approximately $178 million in early May, subject to the satisfaction of customary closing conditions. Following the expected acquisition of these two communities, we will have deployed all of the net proceeds from our 2021 commercial portfolio sales in line with our strategy and targeted price range
•Targeting approximately $100 million of additional multifamily acquisitions in the Southeast by mid-year
Liquidity Position
•Available liquidity was approximately $840 million as of March 31st, consisting of the entire capacity under the Company's $700 million revolving credit facility and cash on hand
•The Company has no secured debt and no scheduled debt maturities until July 2023
Washington Real Estate Investment Trust
"Our first quarter results reflect the beginning of the earnings momentum that we expect to generate over the coming years as we continue to expand our footprint in high growth Southeast markets," said Paul T. McDermott, President and CEO. "We expect to complete the full deployment of the net proceeds of our commercial assets sales within a matter of weeks, and beyond that, we have a robust pipeline of opportunities that align with our strategies and yield target. We plan to continue to execute on opportunities that fit our portfolio strategies and to create increasing long-term value for our shareholders.”
First Quarter Operating Results
▪Same-store Multifamily NOI - Same-store NOI increased 7.9% compared to the corresponding prior year period driven by higher base rent, occupancy, and move-in fee income compared to the prior year period. Average occupancy for the quarter increased 1.5% from the prior year period to 95.8%.
▪Same-store Other NOI - Our Other same-store portfolio is comprised of one asset, Watergate 600. Same-store NOI decreased by 1.7% compared to the corresponding prior year period due to the impact of annual expense recoveries. Watergate 600 was 91.4% occupied and 92.5% leased at quarter end.
"The year is off to a very strong start and our portfolio is positioned with what we believe are our best growth prospects in recent history," said Stephen E. Riffee, Executive Vice President and CFO. "Occupancy and retention remain very strong, and lease rate growth continues to trend upward. As leasing activity picks up into the spring and we capture the balance of post inflection rate increases while also capturing additional market rent growth during the year, we expect same-store multifamily NOI to grow at a higher rate during the second half of the year and for the momentum to carry over into 2023."
2022 Guidance
Core FFO for 2022 is expected to range from $0.87 to $0.93 per fully diluted share. The following assumptions are included in the Core FFO guidance for 2022 as set forth below:
Full Year Outlook on Key Assumptions and Metrics
•Same-store multifamily NOI growth is expected to range between 7.75% to 9.75%
•Same-store multifamily and Trove NOI, which was fully delivered and invested by the start of 2021, is expected to grow between 11.5% and 13.5%
•Non same-store multifamily NOI is expected to range from $22.5 million to $23.5 million in 2022, of which Trove, is expected to contribute approximately $7.0 million of NOI
•Other same-store NOI, which consists solely of Watergate 600, is expected to range from $13.0 million to $13.75 million, which represents year-over-year growth of 3.4% at the midpoint
•Carlyle of Sandy Springs was acquired on February 1, 2022 for $106 million
•Assumes the acquisition of the two Cobb County, GA acquisitions, which are expected to close in May 2022, for $178 million
•Assumes approximately $100 million of additional multifamily acquisitions that are expected to be completed in the Southeast
•Core AFFO payout ratio is expected to be in the mid-70% range
Washington Real Estate Investment Trust
| | | | | |
| Full Year 2022 |
| Core FFO per diluted share | $0.87 - $0.93 |
| Net Operating Income | |
| Same-store multifamily NOI growth | 7.75% - 9.75% |
| Same-store multifamily and Trove NOI growth | 11.5% - 13.5% |
Non-same-store multifamily NOI (a) | $22.5 million - $23.5 million |
Non-residential NOI (b) | ~$0.75 million |
Other same-store NOI (c) | $13.0 million - $13.75 million |
| Transactions | |
Acquisitions (d) | $100 million |
| Expenses | |
| Property Management Expenses | $7.5 million - $8.0 million |
| G&A, net of core adjustments | $25.5 million - $26.5 million |
| Interest expense | $25.0 million - $26.0 million |
| Transformation costs | $11.0 million - $13.0 million |
(a) Includes Trove, The Oxford, Assembly Eagles Landing, Carlyle of Sandy Springs, and two Cobb County, GA acquisitions
that are expected to close in May
(b) Includes revenues and expenses from retail operations at multifamily properties
(c) Other same-store NOI consists of Watergate 600
(d) Anticipated completion in first half of 2022. Amount is in addition to acquisition completed in the first quarter of 2022 and the two Cobb County, GA acquisitions, which are expected to be completed in early May.
WashREIT's Core FFO guidance and outlook are based on a number of factors, many of which are outside the Company's control and all of which are subject to change. WashREIT may change the guidance provided during the year as actual and anticipated results vary from these assumptions, but WashREIT undertakes no obligation to do so.
2022 Guidance Reconciliation Table
A reconciliation of projected net loss per diluted share to projected Core FFO per diluted share for the full year ending December 31, 2022 is as follows:
| | | | | | | | |
| Low | High |
Net loss per diluted share | $(0.30) | $(0.26) |
| Real estate depreciation and amortization | 1.04 | 1.04 |
| NAREIT FFO per diluted share | 0.74 | 0.78 |
| Core adjustments | 0.13 | 0.15 |
| Core FFO per diluted share | $0.87 | $0.93 |
Dividends
On April 5, 2022, WashREIT paid a quarterly dividend of $0.17 per share.
WashREIT announced today that its Board of Trustees has declared a quarterly dividend of $0.17 per share to be paid on July 6, 2022 to shareholders of record on June 22, 2022.
Washington Real Estate Investment Trust
Conference Call Information
The First Quarter 2022 Earnings Call is scheduled for Thursday, April 28, 2022 at 11:00 A.M. Eastern Time. Conference Call access information is as follows:
USA Toll Free Number: 1-888-506-0062
International Toll Number: 1-973-528-0011
Conference ID: 698146
The instant replay of the Earnings Call will be available until Thursday, May 12, 2022. Instant replay access information is as follows:
USA Toll Free Number: 1-877-481-4010
International Toll Number: 1-919-882-2331
Conference ID: 44920
The live on-demand webcast of the Conference Call will be available on the Investor section of WashREIT's website at www.washreit.com. Online playback of the webcast will be available following the Conference Call.
Washington Real Estate Investment Trust
About WashREIT
WashREIT owns approximately 8,200 residential apartment homes in the Washington, DC metro and the Southeast. WashREIT also owns and operates approximately 300,000 square feet of commercial space in the Washington, DC metro region. We are focused on providing quality housing to under-served, middle-income renters in submarkets poised for strong, sustained demand. With a proven track record in residential repositioning, we are utilizing the experience and research from the Washington, DC metro region to continue to grow as we geographically diversify into Southeastern markets. We are targeting the deepest demand segments in submarkets with the greatest probability of rent growth outperformance, and tailoring our specific investment strategy to best create value.
Note: WashREIT's press releases and supplemental financial information are available on the Company website at www.washreit.com or by contacting Investor Relations at (202) 774-3200.
Forward Looking Statements
Certain statements in our earnings release and on our conference call are "forward-looking statements" within the meaning of the Private Securities Litigation Reform Act of 1995 and involve risks and uncertainties. Forward-looking statements relate to expectations, beliefs, projections, future plans and strategies, anticipated events or trends and similar expressions concerning matters that are not historical facts. In some cases, you can identify forward looking statements by the use of forward-looking terminology such as “may,” “will,” “should,” “expects,” “intends,” “plans,” “anticipates,” “believes,” “estimates,” “predicts,” or “potential” or the negative of these words and phrases or similar words or phrases which are predictions of or indicate future events or trends and which do not relate solely to historical matters. Such statements involve known and unknown risks, uncertainties, and other factors which may cause the actual results, performance, or achievements of WashREIT to be materially different from future results, performance or achievements expressed or implied by such forward-looking statements. Additional factors which may cause the actual results, performance, or achievements of WashREIT to be materially different from future results, performance or achievements expressed or implied by such forward-looking statements include, but are not limited to: risks associated with our ability to execute on our strategies, including new strategies with respect to our operations and our portfolio, including the acquisition of residential properties in the Southeastern markets, on the terms anticipated, or at all, and to realize any anticipated benefits, including the performance of any acquired residential properties at the levels anticipated; whether actual NOI for Trove and our recently acquired properties, as well as from properties we expect to acquire during the first six months of 2022, will be consistent with our expected NOI for such properties; the risks associated with ownership of real estate in general and our real estate assets in particular; the economic health of the areas in which our properties are located, particularly with respect to greater Washington, DC metro region and the larger Southeastern region; the risk of failure to enter into and/or complete contemplated acquisitions and dispositions, at all, within the price ranges anticipated and on the terms and timing anticipated; changes in the composition of our portfolio; fluctuations in interest rates and other risks related to changes in interest rates; reductions in or actual or threatened changes to the timing of federal government spending; the risks related to use of third-party providers; the economic health of our residents; the ultimate duration of the COVID-19 global pandemic, including any mutations thereof, the actions taken to contain the pandemic or mitigate its impact, and the direct and indirect economic effects of the pandemic and containment measures, the effectiveness and willingness of people to take COVID-19 vaccines, and the duration of associated immunity and efficacy of the vaccines against emerging variants of COVID-19; compliance with applicable laws and corporate social responsibility goals, including those concerning the environment and access by persons with disabilities; the risks related to not having adequate insurance to cover potential losses; changes in the market value of securities; terrorist attacks or actions and/or cyber-attacks; whether we will succeed in the day-to-day property management and leasing activities that we have previously outsourced; the availability and terms of financing and capital and the general volatility of securities markets; the risks related to our organizational structure and limitations of stock ownership; failure to qualify and maintain our qualification as a REIT and the risks of changes in laws affecting REITs; whether our estimated transformation costs for 2022 will be correct; whether we will realize significant operation benefits from our operating model redesign on the timing contemplated or at all; and other risks and uncertainties detailed from time to time in our filings with the SEC, including our 2021 Form 10-K filed on February 18, 2022. While forward-looking statements reflect our good faith beliefs, they are not guarantees of future performance. We undertake no obligation to update our forward-looking statements or risk factors to reflect new information, future events, or otherwise.
This Earnings Release also includes certain forward-looking non-GAAP information. Due to the high variability and difficulty in making accurate forecasts and projections of some of the information excluded from these estimates, together with some of the excluded information not being ascertainable or accessible, the Company is unable to quantify certain amounts that would be required to be included in the most directly comparable GAAP financial measures without unreasonable efforts.
Washington Real Estate Investment Trust
| | | | | | | | | | | | | | | |
| WASHINGTON REAL ESTATE INVESTMENT TRUST AND SUBSIDIARIES |
| FINANCIAL HIGHLIGHTS |
| (In thousands, except per share data) |
| (Unaudited) |
| | | | | | | |
| Three Months Ended March 31, | | |
| OPERATING RESULTS | 2022 | | 2021 | | | | |
| Revenue | | | | | | | |
| Real estate rental revenue | $ | 47,804 | | | $ | 40,607 | | | | | |
| Expenses | | | | | | | |
| Property operating and maintenance | 10,565 | | | 9,395 | | | | | |
| Real estate taxes and insurance | 6,587 | | | 5,596 | | | | | |
| Property management | 1,750 | | | 1,463 | | | | | |
| General and administrative | 6,939 | | | 5,604 | | | | | |
| Transformation costs | 2,223 | | | — | | | | | |
| Depreciation and amortization | 22,200 | | | 16,987 | | | | | |
| | | | | | | |
| 50,264 | | | 39,045 | | | | | |
| | | | | | | |
| Real estate operating (loss) income | (2,460) | | | 1,562 | | | | | |
| Other income (expense) | | | | | | | |
| Interest expense | (5,650) | | | (10,123) | | | | | |
| | | | | | | |
| | | | | | | |
| Other income | 386 | | | 1,284 | | | | | |
| | | | | | | |
| (5,264) | | | (8,839) | | | | | |
| Loss from continuing operations | (7,724) | | | (7,277) | | | | | |
| Discontinued operations: | | | | | | | |
| Income from operations of properties sold or held for sale | — | | | 6,130 | | | | | |
| | | | | | | |
| | | | | | | |
| | | | | | | |
| Income from discontinued operations | — | | | 6,130 | | | | | |
| Net loss | $ | (7,724) | | | $ | (1,147) | | | | | |
| | | | | | | |
| | | | | | | |
| | | | | | | |
| Loss from continuing operations | $ | (7,724) | | | $ | (7,277) | | | | | |
| Depreciation and amortization | 22,200 | | | 16,987 | | | | | |
| | | | | | | |
| | | | | | | |
| Funds from continuing operations | 14,476 | | | 9,710 | | | | | |
| | | | | | | |
| Income from discontinued operations | — | | | 6,130 | | | | | |
| Discontinued operations real estate depreciation and amortization | — | | | 12,656 | | | | | |
| | | | | | | |
| Funds from discontinued operations | — | | | 18,786 | | | | | |
| | | | | | | |
| NAREIT funds from operations | $ | 14,476 | | | $ | 28,496 | | | | | |
| | | | | | | |
| | | | | | | |
| Tenant improvements and incentives, net of reimbursements | (549) | | | 539 | | | | | |
| Leasing commissions capitalized | — | | | (538) | | | | | |
| Recurring capital improvements | (1,238) | | | (867) | | | | | |
| Straight-line rents, net | (190) | | | (548) | | | | | |
| | | | | | | |
| Non-real estate depreciation & amortization of debt costs | 1,208 | | | 1,344 | | | | | |
| Amortization of lease intangibles, net | (172) | | | 377 | | | | | |
| Amortization and expensing of restricted share and unit compensation | 2,081 | | | 1,664 | | | | | |
| | | | | | | |
| Adjusted funds from operations | $ | 15,616 | | | $ | 30,467 | | | | | |
Washington Real Estate Investment Trust
| | | | | | | | | | | | | | | | | | |
| | Three Months Ended March 31, | | |
| Per share data: | | 2022 | | 2021 | | | | |
| Loss from continuing operations | (Basic) | $ | (0.09) | | | $ | (0.09) | | | | | |
| (Diluted) | $ | (0.09) | | | $ | (0.09) | | | | | |
| Net loss | (Basic) | $ | (0.09) | | | $ | (0.02) | | | | | |
| (Diluted) | $ | (0.09) | | | $ | (0.02) | | | | | |
| | | | | | | | |
| | | | | | | | |
| NAREIT FFO | (Basic) | $ | 0.17 | | | $ | 0.34 | | | | | |
| (Diluted) | $ | 0.17 | | | $ | 0.34 | | | | | |
| | | | | | | | |
| Dividends paid | | $ | 0.17 | | | $ | 0.30 | | | | | |
| | | | | | | | |
| Weighted average shares outstanding - basic | | 87,214 | | | 84,413 | | | | | |
| Weighted average shares outstanding - diluted | | 87,214 | | | 84,413 | | | | | |
| Weighted average shares outstanding - diluted (for NAREIT FFO) | 87,253 | | | 84,495 | | | | | |
Washington Real Estate Investment Trust
| | | | | | | | | | | |
| WASHINGTON REAL ESTATE INVESTMENT TRUST AND SUBSIDIARIES |
| CONSOLIDATED BALANCE SHEETS |
| (In thousands, except per share data) |
| (Unaudited) |
| | | |
| March 31, 2022 | | December 31, 2021 |
| Assets | | | |
| Land | $ | 340,046 | | | $ | 322,623 | |
| Income producing property | 1,733,326 | | | 1,642,147 | |
| 2,073,372 | | | 1,964,770 | |
| Accumulated depreciation and amortization | (421,663) | | | (402,560) | |
| Net income producing property | 1,651,709 | | | 1,562,210 | |
| Properties under development or held for future development | 31,157 | | | 30,631 | |
| Total real estate held for investment, net | 1,682,866 | | | 1,592,841 | |
| | | |
| Cash and cash equivalents | 139,711 | | | 233,600 | |
| Restricted cash | 636 | | | 620 | |
| Rents and other receivables | 16,120 | | | 15,067 | |
| Prepaid expenses and other assets | 37,391 | | | 33,866 | |
| | | |
| Total assets | $ | 1,876,724 | | | $ | 1,875,994 | |
| | | |
| Liabilities | | | |
| Notes payable, net | $ | 497,093 | | | $ | 496,946 | |
| | | |
| | | |
| Accounts payable and other liabilities | 33,184 | | | 40,585 | |
| Dividend payable | 14,924 | | | 14,650 | |
| Advance rents | 1,463 | | | 2,082 | |
| Tenant security deposits | 4,817 | | | 4,669 | |
| | | |
| Total liabilities | 551,481 | | | 558,932 | |
| | | |
| Equity | | | |
| Shareholders' equity | | | |
| Preferred shares; $0.01 par value; 10,000 shares authorized; no shares issued or outstanding | — | | | — | |
Shares of beneficial interest, $0.01 par value; 150,000 and 100,000 shares authorized; 87,414 and 86,261 shares issued and outstanding, as of March 31, 2022 and December 31, 2021, respectively | 874 | | | 863 | |
| Additional paid in capital | 1,725,828 | | | 1,697,477 | |
| Distributions in excess of net income | (385,108) | | | (362,494) | |
| Accumulated other comprehensive loss | (16,656) | | | (19,091) | |
| Total shareholders' equity | 1,324,938 | | | 1,316,755 | |
| | | |
| Noncontrolling interests in subsidiaries | 305 | | | 307 | |
| Total equity | 1,325,243 | | | 1,317,062 | |
| | | |
| Total liabilities and equity | $ | 1,876,724 | | | $ | 1,875,994 | |
Washington Real Estate Investment Trust
| | | | | | | | | | | | | | | |
| The following tables contain reconciliations of net loss (income) to NOI for the periods presented (in thousands): |
| | | | | | | |
| Three Months Ended March 31, | | |
| 2022 | | 2021 | | | | |
| Net loss | $ | (7,724) | | | $ | (1,147) | | | | | |
| Adjustments: | | | | | | | |
| Property management | 1,750 | | | 1,463 | | | | | |
| General and administrative | 6,939 | | | 5,604 | | | | | |
| Transformation costs | 2,223 | | | — | | | | | |
| Real estate depreciation and amortization | 22,200 | | | 16,987 | | | | | |
| | | | | | | |
| | | | | | | |
| Interest expense | 5,650 | | | 10,123 | | | | | |
| | | | | | | |
| | | | | | | |
| Other income | (386) | | | (1,284) | | | | | |
| Discontinued operations: | | | | | | | |
| Income from operations of properties sold or held for sale | — | | | (6,130) | | | | | |
| | | | | | | |
| | | | | | | |
| Total Net Operating Income (NOI) | $ | 30,652 | | | $ | 25,616 | | | | | |
| | | | | | | |
| Multifamily NOI: | | | | | | | |
| Same-store portfolio | $ | 23,595 | | | $ | 21,876 | | | | | |
| Acquisitions | 2,082 | | — | | | | | |
| Development | 1,586 | | 255 | | | | | |
| Non-residential | 170 | | 210 | | | | | |
| Total | 27,433 | | | 22,341 | | | | | |
| | | | | | | |
| Other NOI (Watergate 600) | 3,219 | | | 3,275 | | | | | |
| Total NOI | $ | 30,652 | | | $ | 25,616 | | | | | |
| | | | | | | |
Washington Real Estate Investment Trust
| | | | | | | | | | | | | | | | | | | |
| The following table contains a reconciliation of net (loss) income to core funds from operations for the periods presented (in thousands, except per share data): | |
| | Three Months Ended March 31, | | | |
| | 2022 | | 2021 | | | | | |
| Net loss | | $ | (7,724) | | | $ | (1,147) | | | | | | |
| Add: | | | | | | | | | |
| Real estate depreciation and amortization | | 22,200 | | | 16,987 | | | | | | |
| | | | | | | | | |
| | | | | | | | | |
| Discontinued operations: | | | | | | | | | |
| | | | | | | | | |
| | | | | | | | | |
| | | | | | | | | |
| Real estate depreciation and amortization | | — | | | 12,656 | | | | | | |
| NAREIT funds from operations | | 14,476 | | | 28,496 | | | | | | |
| Add: | | | | | | | | | |
| | | | | | | | | |
| | | | | | | | | |
| | | | | | | | | |
| | | | | | | | | |
| | | | | | | | | |
| Severance expense | | 474 | | | 173 | | | | | | |
| Transformation costs | | 2,223 | | | — | | | | | | |
| | | | | | | | | |
| | | | | | | | | |
| Core funds from operations | | $ | 17,173 | | | $ | 28,669 | | | | | | |
| | | | | | | | | |
| | Three Months Ended March 31, | | | |
| Per share data: | | 2022 | | 2021 | | | | | |
| NAREIT FFO | (Basic) | $ | 0.17 | | | $ | 0.34 | | | | | | |
| (Diluted) | $ | 0.17 | | | $ | 0.34 | | | | | | |
| Core FFO | (Basic) | $ | 0.20 | | | $ | 0.34 | | | | | | |
| (Diluted) | $ | 0.20 | | | $ | 0.34 | | | | | | |
| | | | | | | | | |
| Weighted average shares outstanding - basic | | 87,214 | | | 84,413 | | | | | | |
Weighted average shares outstanding - diluted
(for NAREIT and Core FFO) | | 87,253 | | | 84,495 | | | | | | |
Washington Real Estate Investment Trust
| | | | | | | | | | | | | | |
| Non-GAAP Financial Measures |
Adjusted EBITDA is earnings before interest expense, taxes, depreciation, amortization, gain/loss on sale of real estate, casualty gain/loss, real estate impairment, gain/loss on extinguishment of debt, gain/loss on interest rate derivatives, severance expense, acquisition expenses and gain from non-disposal activities and transformation costs. Adjusted EBITDA is included herein because we believe it helps investors and lenders understand our ability to incur and service debt and to make capital expenditures. Adjusted EBITDA is a non-GAAP and non-standardized measure and may be calculated differently by other REITs.
Adjusted Funds From Operations (“AFFO”) is a non-GAAP measure. It is calculated by subtracting from FFO (1) recurring expenditures, tenant improvements and leasing costs, that are capitalized and amortized and are necessary to maintain our properties and revenue stream (excluding items contemplated prior to acquisition or associated with development / redevelopment of a property) and (2) straight line rents, then adding (3) non-real estate depreciation and amortization, (4) non-cash fair value interest expense and (5) amortization of restricted share compensation, then adding or subtracting the (6) amortization of lease intangibles, (7) real estate impairment and (8) non-cash gain/loss on extinguishment of debt, as appropriate. AFFO is included herein, because we consider it to be a performance measure of a REIT’s ability to incur and service debt and to distribute dividends to its shareholders. AFFO is a non-GAAP and non-standardized measure, and may be calculated differently by other REITs.
Core Adjusted Funds From Operations ("Core AFFO") is calculated by adjusting AFFO for the following items (which we believe are not indicative of the performance of Washington REIT’s operating portfolio and affect the comparative measurement of Washington REIT’s operating performance over time): (1) gains or losses on extinguishment of debt and gains or losses on interest rate derivatives, (2) costs related to the acquisition of properties, (3) non-share-based executive transition costs, severance expenses and other expenses related to corporate restructuring and executive retirements or resignations, (4) property impairments, casualty gains and losses, and gains or losses on sale not already excluded from FAD, as appropriate, (5) relocation expense and (6) transformation costs. These items can vary greatly from period to period, depending upon the volume of our acquisition activity and debt retirements, among other factors. We believe that by excluding these items, Core AFFO serves as a useful, supplementary performance measure of Washington REIT’s ability to incur and service debt, and distribute dividends to its shareholders. Core AFFO is a non-GAAP and non-standardized measure, and may be calculated differently by other REITs.
Core Funds From Operations (“Core FFO”) is calculated by adjusting NAREIT FFO for the following items (which we believe are not indicative of the performance of Washington REIT’s operating portfolio and affect the comparative measurement of Washington REIT’s operating performance over time): (1) gains or losses on extinguishment of debt and gains or losses on interest rate derivatives, (2) expenses related to acquisition and structuring activities, (3) executive transition costs, severance expenses and other expenses related to corporate restructuring and executive retirements or resignations, (4) property impairments, casualty gains and losses, and gains or losses on sale not already excluded from NAREIT FFO, as appropriate, (5) relocation expense and (6) transformation costs. These items can vary greatly from period to period, depending upon the volume of our acquisition activity and debt retirements, among other factors. We believe that by excluding these items, Core FFO serves as a useful, supplementary measure of Washington REIT’s ability to incur and service debt, and distribute dividends to its shareholders. Core FFO is a non-GAAP and non-standardized measure, and may be calculated differently by other REITs.
NAREIT Funds From Operations (“FFO”) is defined by 2018 National Association of Real Estate Investment Trusts, Inc. (“NAREIT”) FFO White Paper Restatement, as net income (computed in accordance with generally accepted accounting principles (“GAAP”)) excluding gains (or losses) associated with sales of properties, impairments of depreciable real estate and real estate depreciation and amortization. We consider NAREIT FFO to be a standard supplemental measure for equity real estate investment trusts (“REITs”) because it facilitates an understanding of the operating performance of our properties without giving effect to real estate depreciation and amortization, which historically assumes that the value of real estate assets diminishes predictably over time. Since real estate values have instead historically risen or fallen with market conditions, we believe that NAREIT FFO more accurately provides investors an indication of our ability to incur and service debt, make capital expenditures and fund other needs. Our FFO may not be comparable to FFO reported by other real estate investment trusts. These other REITs may not define the term in accordance with the current NAREIT definition or may interpret the current NAREIT definition differently. NAREIT FFO is a non-GAAP measure.
Net Operating Income (“NOI”), defined as real estate rental revenue less direct real estate operating expenses, is a non-GAAP measure. NOI is calculated as net income, less non-real estate revenue and the results of discontinued operations (including the gain or loss on sale, if any), plus interest expense, depreciation and amortization, lease origination expenses, general and administrative expenses, acquisition costs, real estate impairment, casualty gain and losses and gain or loss on extinguishment of debt. NOI does not include management expenses, which consist of corporate property management costs and property management fees paid to third parties. They are the primary performance measures we use to assess the results of our operations at the property level. We also present NOI on a cash basis ("Cash NOI") which is calculated as NOI less the impact of straight-lining apartment rent concessions. We believe that each of NOI and Cash NOI is a useful performance measure because, when compared across periods, they reflect the impact on operations of trends in occupancy rates, rental rates and operating costs on an unleveraged basis, providing perspective not immediately apparent from net income. NOI and Cash NOI exclude certain components from net income in order to provide results more closely related to a property’s results of operations. For example, interest expense is not necessarily linked to the operating performance of a real estate asset. In addition, depreciation and amortization, because of historical
Washington Real Estate Investment Trust
cost accounting and useful life estimates, may distort operating performance at the property level. As a result of the foregoing, we provide each NOI and Cash NOI as a supplement to net income, calculated in accordance with GAAP. NOI and Cash NOI do not represent net income or income from continuing operations calculated in accordance with GAAP. As such, neither should be considered an alternative to these measures as an indication of our operating performance.
Average Effective Monthly Rent Per Home represents the average of effective rent (net of concessions) for in-place leases and the market rent for vacant homes.
Average Occupancy is based on average daily occupied apartment homes as a percentage of total apartment homes.
Current Strategy represents the class of each community in our portfolio based on a set of criteria. Our strategies consist of the following subcategories: Class A, Class A-, Class B Value-Add and Class B. A community's class is dependent on a variety of factors, including its vintage, site location, amenities and services, rent growth drivers and rent relative to the market.
•Class A communities are recently-developed, well-located, have competitive amenities and services and command average rental rates well above market median rents.
•Class A- communities have been developed within the past 20 years and feature operational improvements and unit upgrades and command rents at or above median market rents.
•Class B Value-Add communities are over 20 years old but feature operational improvements and strong potential for unit renovations. These communities command average rental rates below median market rents for units that have not been renovated.
•Class B communities are over 20 years old, feature operational improvements and command average rental rates below median market rents.
Debt Service Coverage Ratio is computed by dividing earnings attributable to the controlling interest before interest expense, taxes, depreciation, amortization, real estate impairment, gain on sale of real estate, gain/loss on extinguishment of debt, severance expense, relocation expense, acquisition and structuring expenses and gain/loss from non-disposal activities by interest expense (including interest expense from discontinued operations) and principal amortization.
Debt to Total Market Capitalization is total debt divided by the sum of total debt plus the market value of shares outstanding at the end of the period.
Earnings to Fixed Charges Ratio is computed by dividing earnings attributable to the controlling interest by fixed charges. For this purpose, earnings consist of income from continuing operations (or net income if there are no discontinued operations) plus fixed charges, less capitalized interest. Fixed charges consist of interest expense (excluding interest expense from discontinued operations), including amortized costs of debt issuance, plus interest costs capitalized.
Ending Occupancy is calculated as occupied homes as a percentage of total homes as of the last day of that period.
Lease Rate Growth is defined as the average percentage change in either gross (excluding the impact of concessions) or effective rent (net of concessions) for a new or renewed multifamily lease compared to the prior lease based on the move-in date. The blended rate represents the weighted average of new and renewal lease rate growth achieved.
Recurring Capital Expenditures represent non-accretive building improvements required to maintain current revenues. Recurring capital expenditures do not include acquisition capital that was taken into consideration when underwriting the purchase of a building or which are incurred to bring a building up to "operating standard".
Retention represents the percentage of multifamily leases renewed that were set to expire in the period presented.
Same-store Portfolio Properties include properties that were owned for the entirety of the years being compared, and exclude properties under redevelopment or development and properties acquired, sold or classified as held for sale during the years being compared. We categorize our properties as "same-store" or "non-same-store" for purposes of evaluating comparative operating performance. We define development properties as those for which we have planned or ongoing major construction activities on existing or acquired land pursuant to an authorized development plan. Development properties are categorized as same-store when they have reached stabilized occupancy (90%) before the start of the prior year. We define redevelopment properties as those for which have planned or ongoing significant development and construction activities on existing or acquired buildings pursuant to an authorized plan, which has an impact on current operating results, occupancy and the ability to lease space with the intended result of a higher economic return on the property. We categorize a redevelopment property as same-store when redevelopment activities have been complete for the majority of each year being compared. We currently have two same-store portfolios: "Same-store multifamily" which is comprised of our same-store apartment communities and "Other same-store" which is comprised of our Watergate 600 commercial property.
Transformation Costs include costs related to the strategic shift away from the commercial sector to the residential sector, including the allocation of internal costs, consulting, advisory and termination benefits.related to the strategic transformation including the allocation of internal costs, consulting, advisory and termination benefits.
| | | | | |
| Table of Contents | |
March 31, 2022 |
| | | | | | | | |
| Schedule | Page |
| | |
| Key Financial Data | |
| | |
| | |
| | |
| | |
| | |
| Portfolio Analysis | |
| Net Operating Income (NOI) - Multifamily | |
| Same-Store Operating Results - Multifamily | |
| Same-Store Operating Expenses - Multifamily | |
| | |
| Growth and Strategy | |
| Acquisition and Disposition Summary | |
| | |
| Schedule of Properties | |
| | |
| Capital Analysis | |
| | |
| | |
| | |
| | |
| | |
| | | | | |
Consolidated Statements of Operations (In thousands, except per share data) (Unaudited) | |
| | | | | | | | | | | | | | | | | | | | | | | | | | | | | | | | | |
| | | Three Months Ended |
| OPERATING RESULTS | | | | | 3/31/2022 | | 12/31/2021 | | 9/30/2021 | | 6/30/2021 | | 3/31/2021 |
| Revenues | | | | | | | | | | | | | |
| Real estate rental revenue | | | | | $ | 47,804 | | | $ | 44,748 | | | $ | 42,499 | | | $ | 41,297 | | | $ | 40,607 | |
| Expenses | | | | | | | | | | | | | |
| Property operating and maintenance | | | | | (10,565) | | | (10,086) | | | (9,901) | | | (9,359) | | | (9,395) | |
| Real estate taxes and insurance | | | | | (6,587) | | | (5,516) | | | (5,544) | | | (5,385) | | | (5,596) | |
| Property management | | | | | (1,750) | | | (1,685) | | | (1,499) | | | (1,486) | | | (1,463) | |
| General and administrative | | | | | (6,939) | | | (7,700) | | | (7,909) | | | (6,325) | | | (5,604) | |
| Transformation costs | | | | | (2,223) | | | (1,839) | | | (1,016) | | | (3,780) | | | — | |
| Depreciation and amortization | | | | | (22,200) | | | (20,114) | | | (18,252) | | | (17,303) | | | (16,987) | |
| | | | | | | | | | | | | |
| | | | | (50,264) | | | (46,940) | | | (44,121) | | | (43,638) | | | (39,045) | |
| | | | | | | | | | | | | |
| Real estate operating (loss) income | | | | | (2,460) | | | (2,192) | | | (1,622) | | | (2,341) | | | 1,562 | |
| Other income (expense) | | | | | | | | | | | | | |
| Interest expense | | | | | (5,650) | | | (5,676) | | | (8,106) | | | (10,158) | | | (10,123) | |
| Loss on interest rate derivatives | | | | | — | | | — | | | (106) | | | (5,760) | | | — | |
| | | | | | | | | | | | | |
| Loss on extinguishment of debt | | | | | — | | | — | | | (12,727) | | | — | | | — | |
| Other income | | | | | 386 | | | 1,072 | | | 231 | | | 1,522 | | | 1,284 | |
| | | | | | | | | | | | | |
| Loss from continuing operations | | | | | (7,724) | | | (6,796) | | | (22,330) | | | (16,737) | | | (7,277) | |
| Discontinued operations: | | | | | | | | | | | | | |
| Income from operations of properties sold or held for sale | | | | | — | | | — | | | 7,208 | | | 9,745 | | | 6,130 | |
| Gain on sale of real estate, net | | | | | — | | | — | | | 46,441 | | | — | | | — | |
| | | | | | | | | | | | | |
| | | | | | | | | | | | | |
| Income from discontinued operations | | | | | — | | | — | | | 53,649 | | | 9,745 | | | 6,130 | |
| Net (loss) income | | | | | $ | (7,724) | | | $ | (6,796) | | | $ | 31,319 | | | $ | (6,992) | | | $ | (1,147) | |
| Per Share Data: | | | | | | | | | | | | | |
| Net (loss) income | | | | | $ | (0.09) | | | $ | (0.08) | | | $ | 0.37 | | | $ | (0.08) | | | $ | (0.02) | |
| Fully diluted weighted average shares outstanding | | | | | 87,214 | | | 84,804 | | | 84,496 | | | 84,461 | | | 84,413 | |
| Percentage of Revenues: | | | | | | | | | | | | | |
| | | | | | | | | | | | | |
| General and administrative expenses | | | | | 14.5 | % | | 17.2 | % | | 18.6 | % | | 15.3 | % | | 13.8 | % |
| Ratios: | | | | | | | | | | | | | |
| Adjusted EBITDA / Interest expense | | | | | 4.1 | x | | 3.6 | x | | 3.1 | x | | 4.0 | x | | 3.9 | x |
| Net (loss) income / Real estate rental revenue | | | | | (16.2) | % | | (15.2) | % | | 73.7 | % | | (16.9) | % | | (2.8) | % |
| | | | | |
Consolidated Balance Sheets (In thousands, except per share data) (Unaudited) | |
| | | | | | | | | | | | | | | | | | | | | | | | | | | | | |
| 3/31/2022 | | 12/31/2021 | | 9/30/2021 | | 6/30/2021 | | 3/31/2021 |
| Assets | | | | | | | | | |
| Land | $ | 340,046 | | | $ | 322,623 | | | $ | 306,507 | | | $ | 301,709 | | | $ | 301,709 | |
| Income producing property | 1,733,326 | | | 1,642,147 | | | 1,544,217 | | | 1,490,975 | | | 1,483,774 | |
| 2,073,372 | | | 1,964,770 | | | 1,850,724 | | | 1,792,684 | | | 1,785,483 | |
| Accumulated depreciation and amortization | (421,663) | | | (402,560) | | | (384,392) | | | (367,519) | | | (351,133) | |
| Net income producing property | 1,651,709 | | | 1,562,210 | | | 1,466,332 | | | 1,425,165 | | | 1,434,350 | |
| Properties under development or held for future development | 31,157 | | | 30,631 | | | 30,254 | | | 30,065 | | | 29,718 | |
| Total real estate held for investment, net | 1,682,866 | | | 1,592,841 | | | 1,496,586 | | | 1,455,230 | | | 1,464,068 | |
| Investment in real estate held for sale, net | — | | | — | | | — | | | 779,121 | | | 785,763 | |
| Cash and cash equivalents | 139,711 | | | 233,600 | | | 307,797 | | | 5,435 | | | 3,015 | |
| Restricted cash | 636 | | | 620 | | | 605 | | | 595 | | | 566 | |
| Rents and other receivables | 16,120 | | | 15,067 | | | 14,713 | | | 15,079 | | | 13,492 | |
| Prepaid expenses and other assets | 37,391 | | | 33,866 | | | 33,109 | | | 28,297 | | | 28,126 | |
| Other assets related to properties sold or held for sale | — | | | — | | | — | | | 84,648 | | | 85,006 | |
| Total assets | $ | 1,876,724 | | | $ | 1,875,994 | | | $ | 1,852,810 | | | $ | 2,368,405 | | | $ | 2,380,036 | |
| Liabilities | | | | | | | | | |
| Notes payable, net | $ | 497,093 | | | $ | 496,946 | | | $ | 496,823 | | | $ | 945,905 | | | $ | 945,634 | |
| | | | | | | | | |
| Line of credit | — | | | — | | | — | | | 43,000 | | | 33,000 | |
| Accounts payable and other liabilities | 33,184 | | | 40,585 | | | 38,864 | | | 47,897 | | | 44,241 | |
| Dividend payable | 14,924 | | | 14,650 | | | 14,440 | | | 25,474 | | | 25,424 | |
| Advance rents | 1,463 | | | 2,082 | | | 1,747 | | | 1,572 | | | 1,667 | |
| Tenant security deposits | 4,817 | | | 4,669 | | | 4,480 | | | 4,374 | | | 4,256 | |
| Other liabilities related to properties sold or held for sale | — | | | — | | | — | | | 23,748 | | | 26,912 | |
| Total liabilities | 551,481 | | | 558,932 | | | 556,354 | | | 1,091,970 | | | 1,081,134 | |
| Equity | | | | | | | | | |
| Preferred shares; $0.01 par value; 10,000 shares authorized | — | | | — | | | — | | | — | | | — | |
| Shares of beneficial interest, $0.01 par value; 150,000 shares authorized | 874 | | | 863 | | | 846 | | | 846 | | | 846 | |
| Additional paid-in capital | 1,725,828 | | | 1,697,477 | | | 1,656,821 | | | 1,654,409 | | | 1,651,680 | |
| Distributions in excess of net income | (385,108) | | | (362,494) | | | (341,052) | | | (357,934) | | | (325,469) | |
| Accumulated other comprehensive loss | (16,656) | | | (19,091) | | | (20,468) | | | (21,200) | | | (28,473) | |
| Total shareholders' equity | 1,324,938 | | | 1,316,755 | | | 1,296,147 | | | 1,276,121 | | | 1,298,584 | |
| Noncontrolling interests in subsidiaries | 305 | | | 307 | | | 309 | | | 314 | | | 318 | |
| Total equity | 1,325,243 | | | 1,317,062 | | | 1,296,456 | | | 1,276,435 | | | 1,298,902 | |
| Total liabilities and equity | $ | 1,876,724 | | | $ | 1,875,994 | | | $ | 1,852,810 | | | $ | 2,368,405 | | | $ | 2,380,036 | |
| | | | | | | | | |
| | | | | | | | | |
| | | | | |
Funds from Operations (In thousands, except per share data) (Unaudited)
| |
| | | | | | | | | | | | | | | | | | | | | | | | | | | | | | | | | |
| | | Three Months Ended |
| | | | | 3/31/2022 | | 12/31/2021 | | 9/30/2021 | | 6/30/2021 | | 3/31/2021 |
Funds from operations (FFO) (1) | | | | | | | | | | | | | |
| Net (loss) income | | | | | $ | (7,724) | | | $ | (6,796) | | | $ | 31,319 | | | $ | (6,992) | | | $ | (1,147) | |
| Real estate depreciation and amortization | | | | | 22,200 | | | 20,114 | | | 18,252 | | | 17,303 | | | 16,987 | |
| | | | | | | | | | | | | |
| | | | | | | | | | | | | |
| | | | | | | | | | | | | |
| Discontinued operations: | | | | | | | | | | | | | |
| Gain on sale of depreciable real estate, net | | | | | — | | | — | | | (46,441) | | | — | | | — | |
| | | | | | | | | | | | | |
| Real estate depreciation and amortization | | | | | — | | | — | | | — | | | 10,248 | | | 12,656 | |
| NAREIT funds from operations (FFO) | | | | | 14,476 | | | 13,318 | | | 3,130 | | | 20,559 | | | 28,496 | |
| Loss on extinguishment of debt | | | | | — | | | — | | | 12,727 | | | — | | | — | |
| | | | | | | | | | | | | |
| Loss on interest rate derivatives | | | | | — | | | — | | | 106 | | | 5,760 | | | — | |
| | | | | | | | | | | | | |
| Severance expense | | | | | 474 | | | — | | | — | | | — | | | 173 | |
| Transformation costs | | | | | 2,223 | | | 1,839 | | | 1,016 | | | 3,780 | | | — | |
| Insurance gain | | | | | — | | | (1,026) | | | — | | | — | | | — | |
| | | | | | | | | | | | | |
| | | | | | | | | | | | | |
| | | | | | | | | | | | | |
Core FFO (1) | | | | | $ | 17,173 | | | $ | 14,131 | | | $ | 16,979 | | | $ | 30,099 | | | $ | 28,669 | |
| | | | | | | | | | | | | |
Allocation to participating securities (2) | | | | | (72) | | | (44) | | | (73) | | | (137) | | | (139) | |
| | | | | | | | | | | | | |
| NAREIT FFO per share - basic | | | | | $ | 0.17 | | | $ | 0.16 | | | $ | 0.04 | | | $ | 0.24 | | | $ | 0.34 | |
| NAREIT FFO per share - fully diluted | | | | | $ | 0.17 | | | $ | 0.16 | | | $ | 0.04 | | | $ | 0.24 | | | $ | 0.34 | |
| | | | | | | | | | | | | |
| Core FFO per share - fully diluted | | | | | $ | 0.20 | | | $ | 0.17 | | | $ | 0.20 | | | $ | 0.35 | | | $ | 0.34 | |
| | | | | | | | | | | | | |
| Common dividend per share | | | | | $ | 0.17 | | | $ | 0.17 | | | $ | 0.17 | | | $ | 0.30 | | | $ | 0.30 | |
| | | | | | | | | | | | | |
| Average shares - basic | | | | | 87,214 | | | 84,804 | | | 84,496 | | | 84,461 | | | 84,413 | |
| Average shares - fully diluted (for NAREIT FFO and Core FFO) | | | | | 87,253 | | | 84,911 | | | 84,586 | | | 84,519 | | | 84,495 | |
______________________________ | | | | | | | | | | | | | |
(1) See "Definitions" on page 11 for the definitions of NAREIT FFO and Core FFO. |
(2) Adjustment to the numerators for FFO and Core FFO per share calculations when applying the two-class method for calculating EPS. |
| | | | | |
Adjusted Funds from Operations (In thousands, except per share data) (Unaudited)
| |
| | | | | | | | | | | | | | | | | | | | | | | | | | | | | | | | | |
| | | Three Months Ended |
| | | | | 3/31/2022 | | 12/31/2021 | | 9/30/2021 | | 6/30/2021 | | 3/31/2021 |
Adjusted funds from operations (AFFO) (1) | | | | | | | | | | | | | |
| NAREIT FFO | | | | | $ | 14,476 | | | $ | 13,318 | | | $ | 3,130 | | | $ | 20,559 | | | $ | 28,496 | |
| Non-cash loss on extinguishment of debt | | | | | — | | | — | | | 833 | | | — | | | — | |
| Tenant improvements and incentives, net of reimbursements | | | | | (549) | | | (642) | | | (331) | | | (1,112) | | | 539 | |
| Leasing commissions capitalized | | | | | — | | | (24) | | | (378) | | | (1,868) | | | (538) | |
| Recurring capital improvements | | | | | (1,238) | | | (1,366) | | | (1,485) | | | (1,156) | | | (867) | |
| Straight-line rent, net | | | | | (190) | | | (218) | | | (347) | | | (625) | | | (548) | |
| | | | | | | | | | | | | |
| Non-real estate depreciation and amortization of debt costs | | | | | 1,208 | | | 1,241 | | | 1,330 | | | 1,350 | | | 1,344 | |
| Amortization of lease intangibles, net | | | | | (172) | | | (172) | | | (32) | | | 195 | | | 377 | |
Amortization and expensing of restricted share and unit compensation (2) | | | | | 2,081 | | | 2,075 | | | 2,651 | | | 2,163 | | | 1,664 | |
| | | | | | | | | | | | | |
| AFFO | | | | | 15,616 | | | 14,212 | | | 5,371 | | | 19,506 | | | 30,467 | |
| Cash loss on extinguishment of debt | | | | | — | | | — | | | 11,894 | | | — | | | — | |
| Loss on interest rate derivatives | | | | | — | | | — | | | 106 | | | 5,760 | | | — | |
| | | | | | | | | | | | | |
| Non-share-based severance expense | | | | | 202 | | | — | | | — | | | — | | | 103 | |
| | | | | | | | | | | | | |
| | | | | | | | | | | | | |
Transformation costs (3) | | | | | 2,162 | | | 1,802 | | | 674 | | | 3,703 | | | — | |
| Insurance gain | | | | | — | | | (1,026) | | | — | | | — | | | — | |
Core AFFO (1) | | | | | $ | 17,980 | | | $ | 14,988 | | | $ | 18,045 | | | $ | 28,969 | | | $ | 30,570 | |
______________________________ | | | | | | | | | | | | | |
(1) See "Definitions" on page 11 for the definitions of AFFO and Core AFFO |
(2) Includes share award modifications related to transformation costs |
(3) Excludes share award modifications related to transformation costs |
| | | | | |
Net Operating Income (NOI) - Multifamily (Dollars In thousands)
| |
| | | | | | | | | | | | | | | | | | | | | | | | | | | | | | | | | | | | | | | |
| Apartment Homes as of 3/31/2022 | | | | Three Months Ended |
| | | | | | 3/31/2022 | | 12/31/2021 | | 9/30/2021 | | 6/30/2021 | | 3/31/2021 |
| Rental and other property revenues | | | | | | | | | | | | | | | |
Same-store (1) | 6,658 | | | | | | $ | 36,733 | | | $ | 35,660 | | | $ | 35,408 | | | $ | 35,321 | | | $ | 34,912 | |
Acquisitions (2) | 1,119 | | | | | | 3,925 | | | 1,774 | | | 488 | | | — | | | — | |
Development (3) | 401 | | | | | | 2,431 | | | 2,223 | | | 1,846 | | | 1,330 | | | 976 | |
Non-residential (4) | N/A | | | | | | 245 | | | 233 | | | 304 | | | 211 | | | 279 | |
| Total rental and other property revenues | 8,178 | | | | | | 43,334 | | | 39,890 | | | 38,046 | | | 36,862 | | | 36,167 | |
| | | | | | | | | | | | | | | |
| Property operating expenses | | | | | | | | | | | | | | | |
| Same-store | | | | | | | 13,138 | | | 12,523 | | | 13,003 | | | 12,550 | | | 13,036 | |
| Acquisitions | | | | | | | 1,843 | | | 653 | | | 212 | | | — | | | — | |
| Development | | | | | | | 845 | | | 838 | | | 846 | | | 853 | | | 721 | |
| Non-residential | | | | | | | 75 | | | 73 | | | 85 | | | 65 | | | 69 | |
| Total property operating expenses | | | | | | | 15,901 | | | 14,087 | | | 14,146 | | | 13,468 | | | 13,826 | |
| | | | | | | | | | | | | | | |
| Net Operating Income (NOI) | | | | | | | | | | | | | | | |
| Same-store | | | | | | | 23,595 | | | 23,137 | | | 22,405 | | | 22,771 | | | 21,876 | |
| Acquisitions | | | | | | | 2,082 | | | 1,121 | | | 276 | | | — | | | — | |
| Development | | | | | | | 1,586 | | | 1,385 | | | 1,000 | | | 477 | | | 255 | |
| Non-residential | | | | | | | 170 | | | 160 | | | 219 | | | 146 | | | 210 | |
| Total NOI | | | | | | | $ | 27,433 | | | $ | 25,803 | | | $ | 23,900 | | | $ | 23,394 | | | $ | 22,341 | |
| | | | | | | | | | | | | | | |
| Same-store metrics | | | | | | | | | | | | | | | |
| Operating margin | | | | | | | 64 | % | | 65 | % | | 63 | % | | 64 | % | | 63 | % |
| Retention | | | | | | | 71 | % | | 72 | % | | 60 | % | | 57 | % | | 51 | % |
| | | | | | | | | | | | | | | |
| Effective lease rate growth | | | | | | | | | | | | | | | |
| New | | | | | | | 10.0 | % | | 8.7 | % | | 3.2 | % | | (8.1) | % | | (15.0) | % |
| Renewal | | | | | | | 9.2 | % | | 8.2 | % | | 5.1 | % | | 3.5 | % | | 1.9 | % |
| Blended | | | | | | | 9.5 | % | | 8.4 | % | | 4.3 | % | | (2.1) | % | | (6.8) | % |
______________________________
(1) Includes properties that were owned for the entirety of the years being compared, and excludes properties under redevelopment or development and properties acquired, sold or classified as held for sale during the years being compared.
(2) Includes properties that were acquired during one of the years presented. An acquired property is categorized as same-store when it has been owned for the entirety of the years being compared.
(3) Includes properties for which we have planned or ongoing major construction activities on existing or acquired land pursuant to an authorized development plan. We consider a property's development activities to be complete when the property is ready for its intended use. The property is categorized as same-store when it has been ready for its intended use for the entirety of the years being compared.
(4) Includes revenues and expenses from retail operations at multifamily properties.
| | | | | |
Same-Store Operating Results - Multifamily (Dollars in thousands, except Average Effective Monthly Rent per Home) | |
| | | | | | | | | | | | | | | | | | | | | | | | | | | | | | | | | | | | | | | | | | | | | | | | | | | | | | | | | | | | | | | | | | | | | | | | | | | | | | | | | | | | | | | | | | | | | | | | | | | |
| | | | Rental and Other Property Revenue | | Property Operating Expenses | | Net Operating Income | | Average Occupancy | | Average Effective Monthly Rent per Home | |
| Quarter-to-Date Comparison | | Apt Homes | | Q1 2022 | | Q1 2021 | | % Chg | | Q1 2022 | | Q1 2021 | | % Chg | | Q1 2022 | | Q1 2021 | | % Chg | | Q1 2022 | | Q1 2021 | | % Chg | | Q1 2022 | | Q1 2021 | | % Chg | |
| Virginia | | 5,138 | | $ | 28,678 | | | $ | 27,309 | | | 5.0 | % | | $ | 10,184 | | | $ | 10,097 | | | 0.9 | % | | $ | 18,494 | | | $ | 17,212 | | | 7.4 | % | | 95.7 | % | | 95.0 | % | | 0.7 | % | | $ | 1,738 | | | $ | 1,672 | | | 3.9 | % | |
| | | | | | | | | | | | | | | | | | | | | | | | | | | | | | | | | |
| | | | | | | | | | | | | | | | | | | | | | | | | | | | | | | | | |
| DC / Maryland | | 1,520 | | 8,055 | | | 7,603 | | | 5.9 | % | | 2,954 | | | 2,939 | | | 0.5 | % | | 5,101 | | | 4,664 | | | 9.4 | % | | 96.1 | % | | 92.1 | % | | 4.0 | % | | 1,719 | | | 1,713 | | | 0.4 | % | |
| DC Metro Total | | 6,658 | | $ | 36,733 | | | $ | 34,912 | | | 5.2 | % | | $ | 13,138 | | | $ | 13,036 | | | 0.8 | % | | $ | 23,595 | | | $ | 21,876 | | | 7.9 | % | | 95.8 | % | | 94.3 | % | | 1.5 | % | | $ | 1,734 | | | $ | 1,682 | | | 3.1 | % | |
| | | | | | | | | | | | | | | | | | | | | | | | | | | | | | | | | |
| | | | | | | | | | | | | | | | | | | | | | | | | | | | | | | | | |
| Sequential Comparison | | Apt Homes | | Q1 2022 | | Q4 2021 | | % Chg | | Q1 2022 | | Q4 2021 | | % Chg | | Q1 2022 | | Q4 2021 | | % Chg | | Q1 2022 | | Q4 2021 | | % Chg | | Q1 2022 | | Q4 2021 | | % Chg | |
| Virginia | | 5,138 | | $ | 28,678 | | | $ | 27,875 | | | 2.9 | % | | $ | 10,184 | | | $ | 9,574 | | | 6.4 | % | | $ | 18,494 | | | $ | 18,301 | | | 1.1 | % | | 95.7 | % | | 95.8 | % | | (0.1) | % | | $ | 1,738 | | | $ | 1,710 | | | 1.6 | % | |
| | | | | | | | | | | | | | | | | | | | | | | | | | | | | | | | | |
| | | | | | | | | | | | | | | | | | | | | | | | | | | | | | | | | |
| DC / Maryland | | 1,520 | | 8,055 | | | 7,785 | | | 3.5 | % | | 2,954 | | | 2,949 | | | 0.2 | % | | 5,101 | | | 4,836 | | | 5.5 | % | | 96.1 | % | | 96.0 | % | | 0.1 | % | | 1,719 | | | 1,703 | | | 0.9 | % | |
| DC Metro Total | | 6,658 | | $ | 36,733 | | | $ | 35,660 | | | 3.0 | % | | $ | 13,138 | | | $ | 12,523 | | | 4.9 | % | | $ | 23,595 | | | $ | 23,137 | | | 2.0 | % | | 95.8 | % | | 95.9 | % | | (0.1) | % | | $ | 1,734 | | | $ | 1,708 | | | 1.5 | % | |
| | | | | | | | | | | | | | | | | | | | | | | | | | | | | | | | | |
| | | | | | | | | | | | | | | | | | | | | | | | | | | | | | | | | |
| | | | | | | | | | | | | | | | | | | | | | | | | | | | | | | | | |
| | | | | | | | | | | | | | | | | | | | | | | | | | | | | | | | | |
| | | | | | | | | | | | | | | | | | | | | | | | | | | | | | | | | |
| | | | | | | | | | | | | | | | | | | | | | | | | | | | | | | | | |
| | | | | | | | | | | | | | | | | | | | | | | | | | | | | | | | | |
| | | | | | | | | | | | | | | | | | | | | | | | | | | | | | | | | |
| | | | | | | | | | | | | | | | | | | | | | | | | | | | | | | | | |
| | | | | |
Same-Store Operating Expenses - Multifamily (In thousands) | |
| | | | | | | | | | | | | | | | | | | | | | | | | | | | | | | |
| Quarter-to-Date Comparison | Q1 2022 | | Q1 2021 | | $ Change | | % Change | | | % of Q1 2022 Total | |
Controllable (1) | $ | 6,336 | | | $ | 6,423 | | | $ | (87) | | | (1.4) | % | | | 48.2 | % | |
Non-Controllable (2) | 6,802 | | | 6,613 | | | 189 | | | 2.9 | % | | | 51.8 | % | |
| Total same-store operating expenses | $ | 13,138 | | | $ | 13,036 | | | $ | 102 | | | 0.8 | % | | | 100.0 | % | |
| | | | | | | | | | | |
| | | | | | | | | | | | | | | | | | | | | | | | | | | | | | | |
| Sequential Comparison | Q1 2022 | | Q4 2021 | | $ Change | | % Change | | | % of Q1 2022 Total | |
| Controllable | $ | 6,336 | | | $ | 6,489 | | | $ | (153) | | | (2.4) | % | | | 48.2 | % | |
| Non-Controllable | 6,802 | | | 6,034 | | | 768 | | | 12.7 | % | | | 51.8 | % | |
| Total same-store operating expenses | $ | 13,138 | | | $ | 12,523 | | | $ | 615 | | | 4.9 | % | | | 100.0 | % | |
| | | | | | | | | | | |
| | |
______________________________ |
(1) Controllable operating expenses consist of: |
| Payroll, Repairs & Maintenance, Marketing, Administrative and other |
(2) Non-Controllable operating expenses consist of: |
| Utilities, Insurance and Real Estate Taxes |
| | | | | |
Acquisition and Disposition Summary (Dollars in thousands) | |
| | | | | | | | | | | | | | | | | | | | | | | | | | | | | | | |
Acquisitions (1) | | | | | | | | | | | |
| Location | | Acquisition Date | | | | Number of Homes | | March 31, 2022 Average Occupancy | | Contract Purchase Price |
| | | | | | | | | | | |
| Carlyle of Sandy Springs | Sandy Springs, GA | | February 1, 2022 | | | | 389 | | 94.4% | | $ | 105,586 | |
| | | | | | | | | | | |
| | | | | | | | | | | |
| | | | | | | | | | | |
| | | | | | | | | | | |
| The Oxford | Conyers, GA | | August 10, 2021 | | | | 240 | | 95.3% | | $ | 48,000 | |
Assembly Eagles Landing (2) | Stockbridge, GA | | November 19, 2021 | | | | 490 | | 94.5% | | 106,000 | |
| | | Total 2021 | | | | 730 | | | | $ | 154,000 | |
| | | | | | | | | | | |
| Dispositions | | | | | | | | | | | |
| Location | | Disposition Date | | | | Square Feet | | Contract Sales Price
(in thousands) | | GAAP (Loss) Gain on Sale |
| | | | | | | | | | | |
Office Portfolio (3) | VA, DC | | July 26, 2021 | | | | 2,370,000 | | | $ | 766,000 | | | $ | (11,220) | |
Retail Portfolio (4) | VA, DC, MD | | September 22, 2021 | | | | 693,000 | | | 168,314 | | | 57,661 | |
| | | Total 2021 | | | | 3,063,000 | | | $ | 934,314 | | | $ | 46,441 | |
______________________________
(1) During the first quarter of 2022, we executed a purchase and sale agreement to acquire additional residential communities in the Southeast region for a contract sales price of $177.7 million.
(2) Reflects the acquisitions of 860 South and 900 Dwell in Henry County, Georgia.
(3) Office Portfolio consists of twelve office properties: 1901 Pennsylvania Avenue, 515 King Street, 1220 19th Street, 1600 Wilson Boulevard, Silverline Center, Courthouse Square, 2000 M Street, 1140 Connecticut Avenue, Army Navy Club, 1775 Eye Street, Fairgate at Ballston and Arlington Tower.
(4) Retail Portfolio consists of eight retail properties: Takoma Park, Westminster, Concord Centre, Chevy Chase Metro Plaza, 800 S. Washington Street, Randolph Shopping Center, Montrose Shopping Center and Spring Valley Village.
| | | | | |
| Multifamily Communities | |
| March 31, 2022 |
| | | | | | | | | | | | | | | | | | | | | | | | | | | | | | | |
| Property | | Location | Apartment Homes | Current Strategy | Year Acquired | Year Built | Average Occupancy (1) | | Ending Occupancy | | % of Total Portfolio NOI (1) |
| Virginia | | | | | | | | | | | |
| Assembly Alexandria | | Alexandria, VA | 532 | B Value-Add | 2019 | 1990 | 96.0% | | 96.4% | | 6% |
| Cascade at Landmark | | Alexandria, VA | 277 | B Value-Add | 2019 | 1988 | 95.7% | | 94.9% | | 4% |
| Clayborne | | Alexandria, VA | 74 | A- | N/A | 2008 | 95.8% | | 95.9% | | 1% |
| Riverside Apartments | | Alexandria, VA | 1,222 | B Value-Add | 2016 | 1971 | 95.4% | | 94.8% | | 13% |
| Bennett Park | | Arlington, VA | 224 | A- | N/A | 2007 | 96.7% | | 96.4% | | 4% |
| Park Adams | | Arlington, VA | 200 | B | 1969 | 1959 | 96.0% | | 95.5% | | 2% |
| The Maxwell | | Arlington, VA | 163 | A- | N/A | 2014 | 96.0% | | 95.7% | | 2% |
| The Paramount | | Arlington, VA | 135 | B | 2013 | 1984 | 95.5% | | 96.3% | | 2% |
| The Wellington | | Arlington, VA | 711 | B Value-Add | 2015 | 1960 | 95.3% | | 95.1% | | 8% |
| Trove | | Arlington, VA | 401 | A | N/A | 2020 | 94.5% | | 95.3% | | 5% |
| Roosevelt Towers | | Falls Church, VA | 191 | B | 1965 | 1964 | 95.1% | | 96.3% | | 2% |
| Assembly Dulles | | Herndon, VA | 328 | B Value-Add | 2019 | 2000 | 95.8% | | 95.4% | | 4% |
| Assembly Herndon | | Herndon, VA | 283 | B Value-Add | 2019 | 1991 | 96.0% | | 96.8% | | 3% |
| Assembly Leesburg | | Leesburg, VA | 134 | B | 2019 | 1986 | 97.1% | | 97.0% | | 2% |
| Assembly Manassas | | Manassas, VA | 408 | B Value-Add | 2019 | 1986 | 95.5% | | 96.1% | | 4% |
| The Ashby at McLean | | McLean, VA | 256 | B | 1996 | 1982 | 95.1% | | 96.1% | | 4% |
| Washington, DC | | | | | | | | | | | |
| 3801 Connecticut Avenue | | Washington, DC | 307 | B Value-Add | 1963 | 1951 | 96.5% | | 95.4% | | 3% |
| Kenmore Apartments | | Washington, DC | 374 | B Value-Add | 2008 | 1948 | 95.7% | | 96.5% | | 3% |
| Yale West | | Washington, DC | 216 | A- | 2014 | 2011 | 95.6% | | 96.8% | | 3% |
| Maryland | | | | | | | | | | | |
| Bethesda Hill Apartments | | Bethesda, MD | 195 | B | 1997 | 1986 | 95.4% | | 94.9% | | 3% |
| Assembly Watkins Mill | | Gaithersburg, MD | 210 | B | 2019 | 1975 | 97.7% | | 96.7% | | 2% |
| Assembly Germantown | | Germantown, MD | 218 | B Value-Add | 2019 | 1990 | 95.8% | | 95.9% | | 2% |
| | | | | | | | | | | |
______________________________
(1) For the three months ended March 31, 2022.
| | | | | |
| Multifamily Communities (Continued) | |
| March 31, 2022 |
| | | | | | | | | | | | | | | | | | | | | | | | | | | | | | | |
| Property | | Location | Apartment Homes | Current Strategy | Year Acquired | Year Built | Average Occupancy (1) | | Ending Occupancy | | % of Total Portfolio NOI (1) |
Georgia | | | | | | | | | | | |
| The Oxford | | Conyers, GA | 240 | B | 2021 | 1999 | 95.3% | | 92.9% | | 2% |
| Carlyle of Sandy Springs | | Sandy Springs, GA | 389 | B Value-Add | 2022 | 1972 | 94.4% | | 94.3% | | 2% |
| Assembly Eagles Landing | | Stockbridge, GA | 490 | B | 2021 | 2000 | 94.5% | | 94.9% | | 3% |
______________________________
(1) For the three months ended March 31, 2022.
| | | | | |
| Office Property | |
| March 31, 2022 |
| | | | | | | | | | | | | | | | | | | | | | | | | | | | | | | | | | | | | | | | | | | | | | |
| Property | | Location | | Year Acquired | | Year Built | | Net Rentable Square Feet | | Leased % (1) | | Ending Occupancy (1) | | | | % of Total Portfolio NOI (2) |
| Washington, DC |
| Watergate 600 | | Washington, DC | | 2017 | | 1972/1997 | | 295,000 | | 92.5% | | 91.4% | | | | 11 | % |
| | | | | | | | | | | | | | | | |
______________________________(1) The leased and occupied square footage includes short-term lease agreements.
(2) For the three months ended March 31, 2022.
| | | | | |
Adjusted Earnings Before Interest, Taxes, Depreciation and Amortization (EBITDA) (In thousands) (Unaudited) | |
| | | | | | | | | | | | | | | | | | | | | | | | | | | | | | | | | | | |
| | | Three Months Ended |
| | | | | 3/31/2022 | | 12/31/2021 | | 9/30/2021 | | 6/30/2021 | | 3/31/2021 |
Adjusted EBITDA (1) | | | | | | | | | | | | | |
| | | | | | | | | | | | | |
| Net (loss) income | | | | | $ | (7,724) | | | $ | (6,796) | | | $ | 31,319 | | | $ | (6,992) | | | $ | (1,147) | |
| Add/(deduct): | | | | | | | | | | | | | |
| Interest expense | | | | | 5,650 | | | 5,676 | | | 8,106 | | | 10,158 | | | 10,123 | |
| Real estate depreciation and amortization | | | | | 22,200 | | | 20,114 | | | 18,252 | | | 27,551 | | | 29,643 | |
| Income tax expense | | | | | — | | | 526 | | | — | | | — | | | — | |
| | | | | | | | | | | | | |
| Non-real estate depreciation | | | | | 207 | | | 239 | | | 234 | | | 234 | | | 233 | |
| Severance expense | | | | | 474 | | | — | | | — | | | — | | | 173 | |
| Transformation costs | | | | | 2,223 | | | 1,839 | | | 1,016 | | | 3,780 | | | — | |
| | | | | | | | | | | | | |
| | | | | | | | | | | | | |
| Gain on sale of depreciable real estate, net | | | | | — | | | — | | | (46,441) | | | — | | | — | |
| Loss on extinguishment of debt | | | | | — | | | — | | | 12,727 | | | — | | | — | |
| Loss on interest rate derivatives | | | | | — | | | — | | | 106 | | | 5,760 | | | — | |
| Insurance gain | | | | | — | | | (1,026) | | | — | | | — | | | — | |
| | | | | | | | | | | | | |
| Adjusted EBITDA | | | | | $ | 23,030 | | | $ | 20,572 | | | $ | 25,319 | | | $ | 40,491 | | | $ | 39,025 | |
______________________________ | | | | | | | | | | | | | |
(1) Adjusted EBITDA is earnings before interest expense, taxes, depreciation, amortization, gain/loss on sale of real estate, casualty gain/loss, real estate impairment, gain/loss on extinguishment of debt, gain/loss on interest rate derivatives, severance expense, acquisition expenses, gain from non-disposal activities and transformation costs. We consider Adjusted EBITDA to be an appropriate supplemental performance measure because it permits investors to view income from operations without the effect of depreciation, and the cost of debt or non-operating gains and losses. Adjusted EBITDA is a non-GAAP measure. |
| | | | | |
Long Term Debt Analysis (Dollars in thousands) | |
| | | | | | | | | | | | | | | | | | | | | | | | | | | | | |
| 3/31/2022 | | 12/31/2021 | | 9/30/2021 | | 6/30/2021 | | 3/31/2021 |
| Balances Outstanding | | | | | | | | | |
| | | | | | | | | |
| | | | | | | | | |
| | | | | | | | | |
| Unsecured | | | | | | | | | |
| Fixed rate bonds | $ | 397,147 | | | $ | 397,058 | | | $ | 396,993 | | | $ | 696,387 | | | $ | 696,174 | |
| Term loan | 99,946 | | | 99,888 | | | 99,830 | | | 249,518 | | | 249,460 | |
| Credit facility | — | | | — | | | — | | | 43,000 | | | 33,000 | |
| | | | | | | | | |
| Total | $ | 497,093 | | | $ | 496,946 | | | $ | 496,823 | | | $ | 988,905 | | | $ | 978,634 | |
| | | | | | | | | |
| Weighted Average Interest Rates | | | | | | | | | |
| | | | | | | | | |
| | | | | | | | | |
| | | | | | | | | |
| Unsecured | | | | | | | | | |
| Fixed rate bonds | 4.5 | % | | 4.5 | % | | 4.5 | % | | 4.3 | % | | 4.3 | % |
Term loan (1) | 2.3 | % | | 2.3 | % | | 2.3 | % | | 2.9 | % | | 2.9 | % |
| Credit facility | — | % | | — | % | | — | % | | 1.1 | % | | 1.1 | % |
| | | | | | | | | |
| Weighted Average | 4.1 | % | | 4.1 | % | | 4.1 | % | | 3.8 | % | | 3.8 | % |
______________________________ | | | | | | | | | |
|
(1) WashREIT has entered into an interest rate swap to effectively fix the floating interest rate on its total $100.0 million aggregate principal of its term loan outstanding as of March 31, 2022 (see page 27). |
Note: The current debt balances outstanding are shown net of discounts, premiums and unamortized debt costs (see page 27). |
| | | | | |
Long Term Debt Maturities (in thousands, except average interest rates) | |
| March 31, 2022 |
| | | | | | | | | | | | | | | | | | | | | | | | | | | | |
| | | Future Maturities of Debt | |
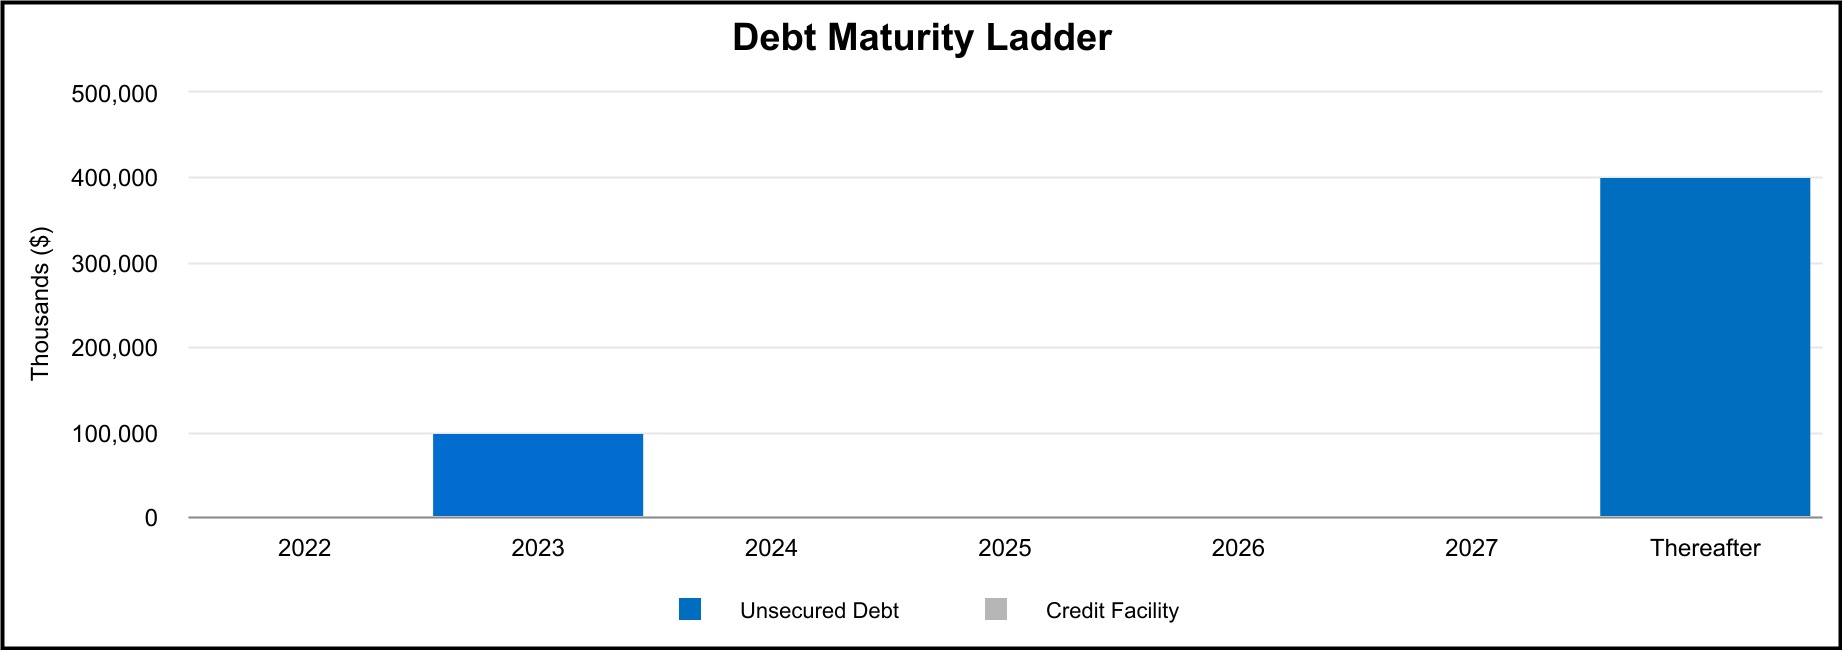
| Year | | | Unsecured Debt | | Credit Facility | | Total Debt | | Avg Interest Rate | |
| 2022 | | | $ | — | | | $ | — | | | $ | — | | | —% | |
| 2023 | | | 100,000 | | (1) | — | | | 100,000 | | | 2.3% | |
| 2024 | | | — | | | — | | | — | | | —% | |
| 2025 | | | — | | | — | | | — | | | —% | |
| 2026 | | | — | | | — | | | — | | | —% | |
| | | | | | | | | | |
| Thereafter | | | 400,000 | | | — | | | 400,000 | | | 4.5% | |
| Scheduled principal payments | | | $ | 500,000 | | | $ | — | | | $ | 500,000 | | | 4.1% | |
| | | | | | | | | | |
| Net discounts/premiums | | | (132) | | | — | | | (132) | | | | |
| Loan costs, net of amortization | | | (2,775) | | | — | | | (2,775) | | | | |
| Total maturities | | | $ | 497,093 | | | $ | — | | | $ | 497,093 | | | 4.1% | |
Weighted average maturity = 7.0 years
______________________________
(1) WashREIT entered into an interest rate swap to effectively fix a LIBOR plus 110 basis points floating interest rate to a 2.31% all-in fixed rate for the remaining $100.0 million portion of the 2018 Term Loan. The interest rates are fixed through the term loan maturity of July 2023.
| | | | | | | | | | | | | | | | | | | | | | | | | | | | | | | | | | | |
| Unsecured Public Debt Covenants | | Unsecured Private Debt Covenants |
| Notes Payable | | Line of Credit
and Term Loans | | Notes Payable |
| Quarter Ended March 31, 2022 | | Covenant | | Quarter Ended March 31, 2022 | | Covenant | | Quarter Ended March 31, 2022 | | Covenant |
% of Total Indebtedness to Total Assets(1) | 25.5 | % | | ≤ 65.0% | | N/A | | N/A | | N/A | | N/A |
| Ratio of Income Available for Debt Service to Annual Debt Service | 3.3 | | | ≥ 1.5 | | N/A | | N/A | | N/A | | N/A |
% of Secured Indebtedness to Total Assets(1) | — | % | | ≤ 40.0% | | N/A | | N/A | | N/A | | N/A |
Ratio of Total Unencumbered Assets(2) to Total Unsecured Indebtedness | 3.9 | | | ≥ 1.5 | | N/A | | N/A | | N/A | | N/A |
% of Net Consolidated Total Indebtedness to Consolidated Total Asset Value(3) | N/A | | N/A | | 16.4 | % | | ≤ 60.0% | | 16.4 | % | | ≤ 60.0% |
Ratio of Consolidated Adjusted EBITDA(4) to Consolidated Fixed Charges(5) | N/A | | N/A | | 4.65 | | | ≥ 1.50 | | 4.65 | | | ≥ 1.50 |
% of Consolidated Secured Indebtedness to Consolidated Total Asset Value(3) | N/A | | N/A | | — | % | | ≤ 40.0% | | — | % | | ≤ 40.0% |
% of Consolidated Unsecured Indebtedness to Unencumbered Pool Value(6) | N/A | | N/A | | 16.4 | % | | ≤ 60.0% | | 16.4 | % | | ≤ 60.0% |
| | | | | | | | | | | |
______________________________ | | | | | | | | | | | |
(1) Total Assets is calculated by applying a capitalization rate of 7.50% to the EBITDA(4) from the last four consecutive quarters, excluding EBITDA from acquired, disposed, and non-stabilized development properties.
(2) Total Unencumbered Assets is calculated by applying a capitalization rate of 7.50% to the EBITDA(4) from unencumbered properties from the last four consecutive quarters, excluding EBITDA from acquired, disposed, and non-stabilized development properties.
(3) Consolidated Total Asset Value is the sum of unrestricted cash plus the quotient of applying a capitalization rate to the annualized NOI from the most recently ended quarter for each asset class, excluding NOI from disposed properties, acquisitions during the past 6 quarters, development, major redevelopment and low occupancy properties. To this amount, we add the purchase price of acquisitions during the past 6 quarters plus values for development, major redevelopment and low occupancy properties.
(4) Consolidated Adjusted EBITDA is defined as earnings before noncontrolling interests, depreciation, amortization, interest expense, income tax expense, acquisition costs, extraordinary, unusual or nonrecurring transactions including sale of assets, impairment, gains and losses on extinguishment of debt and other non-cash charges.
(5) Consolidated Fixed Charges consist of interest expense excluding capitalized interest and amortization of deferred financing costs, principal payments and preferred dividends, if any.
(6) Unencumbered Pool Value is the sum of unrestricted cash plus the quotient of applying a capitalization rate to the annualized NOI from unencumbered properties from the most recently ended quarter for each asset class excluding NOI from disposed properties, acquisitions during the past 6 quarters, development, major redevelopment and low occupancy properties. To this we add the purchase price of unencumbered acquisitions during the past 6 quarters and values for unencumbered development, major redevelopment and low occupancy properties.
| | | | | |
Capital Analysis (In thousands, except per share amounts) | |
| | | | | | | | | | | | | | | | | | | | | | | | | | | | | | | | | |
| | | | | Three Months Ended |
| | | | | 3/31/2022 | | 12/31/2021 | | 9/30/2021 | | 6/30/2021 | | 3/31/2021 |
| Market Data | | | | | | | | | | | | | |
| | | | | | | | | | | | | |
| Shares Outstanding | | | | | 87,414 | | | 86,261 | | | 84,628 | | | 84,590 | | | 84,564 | |
| Market Price per Share | | | | | $ | 25.50 | | | $ | 25.85 | | | $ | 24.75 | | | $ | 23.00 | | | $ | 22.10 | |
| Equity Market Capitalization | | | | | $ | 2,229,057 | | | $ | 2,229,847 | | | $ | 2,094,543 | | | $ | 1,945,570 | | | $ | 1,868,864 | |
| | | | | | | | | | | | | |
| Total Debt | | | | | $ | 497,093 | | | $ | 496,946 | | | $ | 496,823 | | | $ | 988,905 | | | $ | 978,634 | |
| Total Market Capitalization | | | | | $ | 2,726,150 | | | $ | 2,726,793 | | | $ | 2,591,366 | | | $ | 2,934,475 | | | $ | 2,847,498 | |
| | | | | | | | | | | | | |
| Total Debt to Market Capitalization | | | | | 0.18 | :1 | | 0.18 | :1 | | 0.19 | :1 | | 0.34 | :1 | | 0.34 | :1 |
| | | | | | | | | | | | | |
Earnings to Fixed Charges(1) | | | | | -0.4x | | -0.2x | | -1.7x | | -0.6x | | 0.3x |
Debt Service Coverage Ratio(2) | | | | | 4.1x | | 3.6x | | 3.1x | | 4.0x | | 3.9x |
| | | | | | | | | | | | | |
| Dividend Data | | | Three Months Ended |
| | | | | 3/31/2022 | | 12/31/2021 | | 9/30/2021 | | 6/30/2021 | | 3/31/2021 |
| Total Dividends Declared | | | | | $ | 14,890 | | | $ | 14,646 | | | $ | 14,437 | | | $ | 25,473 | | | $ | 25,462 | |
| Common Dividend Declared per Share | | | | | $ | 0.17 | | | $ | 0.17 | | | $ | 0.17 | | | $ | 0.30 | | | $ | 0.30 | |
| Payout Ratio (Core FFO basis) | | | | | 85.0 | % | | 100.0 | % | | 85.0 | % | | 85.7 | % | | 88.2 | % |
| Payout Ratio (Core AFFO basis) | | | | | 81.0 | % | | | | | | | | 83.3 | % |
______________________________ | | | | | | | | | | | | | |
(1) The ratio of earnings to fixed charges is computed by dividing earnings by fixed charges. For this purpose, earnings consist of income from continuing operations attributable to the controlling interests plus fixed charges, less capitalized interest. Fixed charges consist of interest expense, including amortized costs of debt issuance, plus interest costs capitalized. The earnings to fixed charges ratio includes loss on extinguishment of debt of $12.7 million for the three months ended September 30, 2021 and loss on interest rate derivatives of $5.8 million for the three months ended June 30, 2021. |
(2) Debt service coverage ratio is computed by dividing Adjusted EBITDA (see page 25) by interest expense and principal amortization. |