| CONTACT: | 1775 Eye Street, NW, Suite 1000 | |||||||
| Amy Hopkins | Washington, DC 20006 | |||||||
| Vice President, Investor Relations | Tel 202-774-3198 | |||||||
| E-Mail: ahopkins@washreit.com | Fax 301-984-9610 | |||||||
| www.washreit.com | ||||||||
| July 28, 2022 | ||||||||
| WashREIT Announces Second Quarter 2022 Results | ||||||||
| Full Year 2022 | |||||
| Core FFO per diluted share | $0.86 - $0.90 | ||||
| Net Operating Income | |||||
| Same-store multifamily NOI growth | 8.5% - 9.5% | ||||
| Same-store multifamily and Trove NOI growth | 12.25% - 13.25% | ||||
Non-same-store multifamily NOI (a) | $22.0 million - $23.0 million | ||||
Non-residential NOI (b) | ~$0.75 million | ||||
Other same-store NOI (c) | $13.25 million - $13.75 million | ||||
| Transactions | |||||
Acquisitions (d) | $125 million | ||||
| Expenses | |||||
| Property management expense | $7.5 million - $8.0 million | ||||
| G&A, net of core adjustments | $25.5 million - $26.5 million | ||||
| Interest expense | $25.5 million - $26.25 million | ||||
Capitalized interest (e) | ~$0.3 million | ||||
| Transformation costs | $10.5 million - $11.5 million | ||||
| Low | High | |||||||
Net loss per diluted share | $(0.34) | $(0.31) | ||||||
| Real estate depreciation and amortization | 1.06 | 1.06 | ||||||
| NAREIT FFO per diluted share | 0.72 | 0.75 | ||||||
| Core adjustments | 0.14 | 0.15 | ||||||
| Core FFO per diluted share | $0.86 | $0.90 | ||||||
| WASHINGTON REAL ESTATE INVESTMENT TRUST AND SUBSIDIARIES | |||||||||||||||||||||||
| FINANCIAL HIGHLIGHTS | |||||||||||||||||||||||
| (In thousands, except per share data) | |||||||||||||||||||||||
| (Unaudited) | |||||||||||||||||||||||
| Three Months Ended June 30, | Six Months Ended June 30, | ||||||||||||||||||||||
| OPERATING RESULTS | 2022 | 2021 | 2022 | 2021 | |||||||||||||||||||
| Revenue | |||||||||||||||||||||||
| Real estate rental revenue | $ | 51,380 | $ | 41,297 | $ | 99,184 | $ | 81,904 | |||||||||||||||
| Expenses | |||||||||||||||||||||||
| Property operating and maintenance | 11,747 | 9,359 | 22,312 | 18,754 | |||||||||||||||||||
| Real estate taxes and insurance | 6,837 | 5,385 | 13,424 | 10,981 | |||||||||||||||||||
| Property management | 1,796 | 1,486 | 3,546 | 2,949 | |||||||||||||||||||
| General and administrative | 7,656 | 6,325 | 14,595 | 11,929 | |||||||||||||||||||
| Transformation costs | 2,023 | 3,780 | 4,246 | 3,780 | |||||||||||||||||||
| Depreciation and amortization | 24,039 | 17,303 | 46,239 | 34,290 | |||||||||||||||||||
| 54,098 | 43,638 | 104,362 | 82,683 | ||||||||||||||||||||
| Real estate operating loss | (2,718) | (2,341) | (5,178) | (779) | |||||||||||||||||||
| Other income (expense) | |||||||||||||||||||||||
| Interest expense | (6,156) | (10,158) | (11,806) | (20,281) | |||||||||||||||||||
| Loss on interest rate derivatives | — | (5,760) | — | (5,760) | |||||||||||||||||||
| Other income | — | 1,522 | 386 | 2,806 | |||||||||||||||||||
| (6,156) | (14,396) | (11,420) | (23,235) | ||||||||||||||||||||
| Loss from continuing operations | (8,874) | (16,737) | (16,598) | (24,014) | |||||||||||||||||||
| Discontinued operations: | |||||||||||||||||||||||
| Income from operations of properties sold or held for sale | — | 9,745 | — | 15,875 | |||||||||||||||||||
| Income from discontinued operations | — | 9,745 | — | 15,875 | |||||||||||||||||||
| Net loss | $ | (8,874) | $ | (6,992) | $ | (16,598) | $ | (8,139) | |||||||||||||||
| Loss from continuing operations | $ | (8,874) | $ | (16,737) | $ | (16,598) | $ | (24,014) | |||||||||||||||
| Depreciation and amortization | 24,039 | 17,303 | 46,239 | 34,290 | |||||||||||||||||||
| Funds from continuing operations | 15,165 | 566 | 29,641 | 10,276 | |||||||||||||||||||
| Income from discontinued operations | — | 9,745 | — | 15,875 | |||||||||||||||||||
| Discontinued operations real estate depreciation and amortization | — | 10,248 | — | 22,904 | |||||||||||||||||||
| Funds from discontinued operations | — | 19,993 | — | 38,779 | |||||||||||||||||||
| NAREIT funds from operations | $ | 15,165 | $ | 20,559 | $ | 29,641 | $ | 49,055 | |||||||||||||||
| Tenant improvements and incentives, net of reimbursements | (476) | (1,112) | (1,025) | (573) | |||||||||||||||||||
| Leasing commissions capitalized | — | (1,868) | — | (2,406) | |||||||||||||||||||
| Recurring capital improvements | (1,384) | (1,156) | (2,622) | (2,023) | |||||||||||||||||||
| Straight-line rents, net | (135) | (625) | (325) | (1,173) | |||||||||||||||||||
| Non-cash fair value interest expense | 105 | — | 105 | — | |||||||||||||||||||
| Non-real estate depreciation & amortization of debt costs | 1,151 | 1,350 | 2,359 | 2,694 | |||||||||||||||||||
| Amortization of lease intangibles, net | (209) | 195 | (381) | 572 | |||||||||||||||||||
| Amortization and expensing of restricted share and unit compensation | 2,159 | 2,163 | 4,240 | 3,827 | |||||||||||||||||||
| Adjusted funds from operations | $ | 16,376 | $ | 19,506 | $ | 31,992 | $ | 49,973 | |||||||||||||||
| Three Months Ended June 30, | Six Months Ended June 30, | |||||||||||||||||||||||||
| Per share data: | 2022 | 2021 | 2022 | 2021 | ||||||||||||||||||||||
| Loss from continuing operations | (Basic) | $ | (0.10) | $ | (0.20) | $ | (0.19) | $ | (0.29) | |||||||||||||||||
| (Diluted) | $ | (0.10) | $ | (0.20) | $ | (0.19) | $ | (0.29) | ||||||||||||||||||
| Net loss | (Basic) | $ | (0.10) | $ | (0.08) | $ | (0.19) | $ | (0.10) | |||||||||||||||||
| (Diluted) | $ | (0.10) | $ | (0.08) | $ | (0.19) | $ | (0.10) | ||||||||||||||||||
| NAREIT FFO | (Basic) | $ | 0.17 | $ | 0.24 | $ | 0.34 | $ | 0.58 | |||||||||||||||||
| (Diluted) | $ | 0.17 | $ | 0.24 | $ | 0.34 | $ | 0.58 | ||||||||||||||||||
| Dividends paid | $ | 0.17 | $ | 0.30 | $ | 0.34 | $ | 0.60 | ||||||||||||||||||
| Weighted average shares outstanding - basic | 87,392 | 84,461 | 87,303 | 84,437 | ||||||||||||||||||||||
| Weighted average shares outstanding - diluted | 87,392 | 84,461 | 87,303 | 84,437 | ||||||||||||||||||||||
| Weighted average shares outstanding - diluted (for NAREIT FFO) | 87,521 | 84,519 | 87,388 | 84,507 | ||||||||||||||||||||||
| WASHINGTON REAL ESTATE INVESTMENT TRUST AND SUBSIDIARIES | |||||||||||
| CONSOLIDATED BALANCE SHEETS | |||||||||||
| (In thousands, except per share data) | |||||||||||
| (Unaudited) | |||||||||||
| June 30, 2022 | December 31, 2021 | ||||||||||
| Assets | |||||||||||
| Land | $ | 373,171 | $ | 322,623 | |||||||
| Income producing property | 1,875,307 | 1,642,147 | |||||||||
| 2,248,478 | 1,964,770 | ||||||||||
| Accumulated depreciation and amortization | (441,105) | (402,560) | |||||||||
| Net income producing property | 1,807,373 | 1,562,210 | |||||||||
| Properties under development or held for future development | 31,220 | 30,631 | |||||||||
| Total real estate held for investment, net | 1,838,593 | 1,592,841 | |||||||||
| Cash and cash equivalents | 44,787 | 233,600 | |||||||||
| Restricted cash | 1,984 | 620 | |||||||||
| Rents and other receivables | 16,644 | 15,067 | |||||||||
| Prepaid expenses and other assets | 32,865 | 33,866 | |||||||||
| Total assets | $ | 1,934,873 | $ | 1,875,994 | |||||||
| Liabilities | |||||||||||
| Notes payable, net | $ | 497,135 | $ | 496,946 | |||||||
| Mortgage notes payable, net | 71,576 | — | |||||||||
| Accounts payable and other liabilities | 39,890 | 40,585 | |||||||||
| Dividend payable | 14,916 | 14,650 | |||||||||
| Advance rents | 1,821 | 2,082 | |||||||||
| Tenant security deposits | 5,439 | 4,669 | |||||||||
| Total liabilities | 630,777 | 558,932 | |||||||||
| Equity | |||||||||||
| Shareholders' equity | |||||||||||
| Preferred shares; $0.01 par value; 10,000 shares authorized; no shares issued or outstanding | — | — | |||||||||
Shares of beneficial interest, $0.01 par value; 150,000 and 100,000 shares authorized; 87,392 and 86,261 shares issued and outstanding, as of June 30, 2022 and December 31, 2021, respectively | 874 | 863 | |||||||||
| Additional paid in capital | 1,727,031 | 1,697,477 | |||||||||
| Distributions in excess of net income | (408,882) | (362,494) | |||||||||
| Accumulated other comprehensive loss | (15,229) | (19,091) | |||||||||
| Total shareholders' equity | 1,303,794 | 1,316,755 | |||||||||
| Noncontrolling interests in subsidiaries | 302 | 307 | |||||||||
| Total equity | 1,304,096 | 1,317,062 | |||||||||
| Total liabilities and equity | $ | 1,934,873 | $ | 1,875,994 | |||||||
| The following tables contain reconciliations of net loss to NOI for the periods presented (in thousands): | |||||||||||||||||||||||
| Three Months Ended June 30, | Six Months Ended June 30, | ||||||||||||||||||||||
| 2022 | 2021 | 2022 | 2020 | ||||||||||||||||||||
| Net loss | $ | (8,874) | $ | (6,992) | $ | (16,598) | $ | (8,139) | |||||||||||||||
| Adjustments: | |||||||||||||||||||||||
| Property management expense | 1,796 | 1,486 | 3,546 | 2,949 | |||||||||||||||||||
| General and administrative expense | 7,656 | 6,325 | 14,595 | 11,929 | |||||||||||||||||||
| Transformation costs | 2,023 | 3,780 | 4,246 | 3,780 | |||||||||||||||||||
| Real estate depreciation and amortization | 24,039 | 17,303 | 46,239 | 34,290 | |||||||||||||||||||
| Interest expense | 6,156 | 10,158 | 11,806 | 20,281 | |||||||||||||||||||
| Loss on interest rate derivatives | — | 5,760 | — | 5,760 | |||||||||||||||||||
| Other income | — | (1,522) | (386) | (2,806) | |||||||||||||||||||
| Discontinued operations: | |||||||||||||||||||||||
| Income from operations of properties sold or held for sale | — | (9,745) | — | (15,875) | |||||||||||||||||||
| Total Net Operating Income (NOI) | $ | 32,796 | $ | 26,553 | $ | 63,448 | $ | 52,169 | |||||||||||||||
| Multifamily NOI: | |||||||||||||||||||||||
| Same-store portfolio | $ | 23,939 | $ | 22,771 | $ | 47,534 | $ | 44,647 | |||||||||||||||
| Acquisitions | 3,594 | — | 5,676 | — | |||||||||||||||||||
| Development | 1,566 | 477 | 3,152 | 732 | |||||||||||||||||||
| Non-residential | 235 | 146 | 405 | 356 | |||||||||||||||||||
| Total | 29,334 | 23,394 | 56,767 | 45,735 | |||||||||||||||||||
| Other NOI (Watergate 600) | 3,462 | 3,159 | 6,681 | 6,434 | |||||||||||||||||||
| Total NOI | $ | 32,796 | $ | 26,553 | $ | 63,448 | $ | 52,169 | |||||||||||||||
| The following table contains a reconciliation of net loss to core funds from operations for the periods presented (in thousands, except per share data): | |||||||||||||||||||||||||||||
| Three Months Ended June 30, | Six Months Ended June 30, | ||||||||||||||||||||||||||||
| 2022 | 2021 | 2022 | 2021 | ||||||||||||||||||||||||||
| Net loss | $ | (8,874) | $ | (6,992) | $ | (16,598) | $ | (8,139) | |||||||||||||||||||||
| Add: | |||||||||||||||||||||||||||||
| Real estate depreciation and amortization | 24,039 | 17,303 | 46,239 | 34,290 | |||||||||||||||||||||||||
| Discontinued operations: | |||||||||||||||||||||||||||||
| Real estate depreciation and amortization | — | 10,248 | — | 22,904 | |||||||||||||||||||||||||
| NAREIT funds from operations | 15,165 | 20,559 | 29,641 | 49,055 | |||||||||||||||||||||||||
| Add: | |||||||||||||||||||||||||||||
| Structuring expenses | 980 | — | 980 | — | |||||||||||||||||||||||||
| Loss on interest rate derivatives | — | 5,760 | — | 5,760 | |||||||||||||||||||||||||
| Severance expense | — | — | 474 | 173 | |||||||||||||||||||||||||
| Transformation costs | 2,023 | 3,780 | 4,246 | 3,780 | |||||||||||||||||||||||||
| Core funds from operations | $ | 18,168 | $ | 30,099 | $ | 35,341 | $ | 58,768 | |||||||||||||||||||||
| Three Months Ended June 30, | Six Months Ended June 30, | ||||||||||||||||||||||||||||
| Per share data: | 2022 | 2021 | 2022 | 2021 | |||||||||||||||||||||||||
| NAREIT FFO | (Basic) | $ | 0.17 | $ | 0.24 | $ | 0.34 | $ | 0.58 | ||||||||||||||||||||
| (Diluted) | $ | 0.17 | $ | 0.24 | $ | 0.34 | $ | 0.58 | |||||||||||||||||||||
| Core FFO | (Basic) | $ | 0.21 | $ | 0.35 | $ | 0.40 | $ | 0.69 | ||||||||||||||||||||
| (Diluted) | $ | 0.21 | $ | 0.35 | $ | 0.40 | $ | 0.69 | |||||||||||||||||||||
| Weighted average shares outstanding - basic | 87,392 | 84,461 | 87,303 | 84,437 | |||||||||||||||||||||||||
| Weighted average shares outstanding - diluted (for NAREIT and Core FFO) | 87,521 | 84,519 | 87,388 | 84,507 | |||||||||||||||||||||||||
| Non-GAAP Financial Measures | ||||||||||||||
| Other Definitions | ||||||||||||||
| Table of Contents |  | ||||
June 30, 2022 | |||||
| Schedule | Page | |||||||
| Key Financial Data | ||||||||
| Portfolio Analysis | ||||||||
Net Operating Income (NOI) - Multifamily | ||||||||
Same-Store Operating Results - Multifamily | ||||||||
Same-Store Operating Expenses - Multifamily | ||||||||
| Growth and Strategy | ||||||||
Acquisition and Disposition Summary | ||||||||
| Schedule of Properties | ||||||||
| Capital Analysis | ||||||||
Consolidated Statements of Operations (In thousands, except per share data) (Unaudited) | | ||||
| Six Months Ended | Three Months Ended | ||||||||||||||||||||||||||||||||||||||||
| OPERATING RESULTS | June 30, 2022 | June 30, 2021 | June 30, 2022 | March 31, 2022 | December 31, 2021 | September 30, 2021 | June 30, 2021 | ||||||||||||||||||||||||||||||||||
| Revenues | |||||||||||||||||||||||||||||||||||||||||
| Real estate rental revenue | $ | 99,184 | $ | 81,904 | $ | 51,380 | $ | 47,804 | $ | 44,748 | $ | 42,499 | $ | 41,297 | |||||||||||||||||||||||||||
| Expenses | |||||||||||||||||||||||||||||||||||||||||
| Property operating and maintenance | (22,312) | (18,754) | (11,747) | (10,565) | (10,086) | (9,901) | (9,359) | ||||||||||||||||||||||||||||||||||
| Real estate taxes and insurance | (13,424) | (10,981) | (6,837) | (6,587) | (5,516) | (5,544) | (5,385) | ||||||||||||||||||||||||||||||||||
| Property management | (3,546) | (2,949) | (1,796) | (1,750) | (1,685) | (1,499) | (1,486) | ||||||||||||||||||||||||||||||||||
| General and administrative | (14,595) | (11,929) | (7,656) | (6,939) | (7,700) | (7,909) | (6,325) | ||||||||||||||||||||||||||||||||||
| Transformation costs | (4,246) | (3,780) | (2,023) | (2,223) | (1,839) | (1,016) | (3,780) | ||||||||||||||||||||||||||||||||||
| Depreciation and amortization | (46,239) | (34,290) | (24,039) | (22,200) | (20,114) | (18,252) | (17,303) | ||||||||||||||||||||||||||||||||||
| (104,362) | (82,683) | (54,098) | (50,264) | (46,940) | (44,121) | (43,638) | |||||||||||||||||||||||||||||||||||
| Real estate operating loss | (5,178) | (779) | (2,718) | (2,460) | (2,192) | (1,622) | (2,341) | ||||||||||||||||||||||||||||||||||
| Other income (expense) | |||||||||||||||||||||||||||||||||||||||||
| Interest expense | (11,806) | (20,281) | (6,156) | (5,650) | (5,676) | (8,106) | (10,158) | ||||||||||||||||||||||||||||||||||
| Loss on interest rate derivatives | — | (5,760) | — | — | — | (106) | (5,760) | ||||||||||||||||||||||||||||||||||
| Loss on extinguishment of debt | — | — | — | — | — | (12,727) | — | ||||||||||||||||||||||||||||||||||
| Other income | 386 | 2,806 | — | 386 | 1,072 | 231 | 1,522 | ||||||||||||||||||||||||||||||||||
| Loss from continuing operations | (16,598) | (24,014) | (8,874) | (7,724) | (6,796) | (22,330) | (16,737) | ||||||||||||||||||||||||||||||||||
| Discontinued operations: | |||||||||||||||||||||||||||||||||||||||||
| Income from operations of properties sold or held for sale | — | 15,875 | — | — | — | 7,208 | 9,745 | ||||||||||||||||||||||||||||||||||
| Gain on sale of real estate, net | — | — | — | — | — | 46,441 | — | ||||||||||||||||||||||||||||||||||
| Income from discontinued operations | — | 15,875 | — | — | — | 53,649 | 9,745 | ||||||||||||||||||||||||||||||||||
| Net (loss) income | $ | (16,598) | $ | (8,139) | $ | (8,874) | $ | (7,724) | $ | (6,796) | $ | 31,319 | $ | (6,992) | |||||||||||||||||||||||||||
| Per Share Data: | |||||||||||||||||||||||||||||||||||||||||
| Net (loss) income | $ | (0.19) | $ | (0.10) | $ | (0.10) | $ | (0.09) | $ | (0.08) | $ | 0.37 | $ | (0.08) | |||||||||||||||||||||||||||
| Fully diluted weighted average shares outstanding | 87,303 | 84,437 | 87,392 | 87,214 | 84,804 | 84,496 | 84,461 | ||||||||||||||||||||||||||||||||||
| Percentage of Revenues: | |||||||||||||||||||||||||||||||||||||||||
| General and administrative expenses | 14.7 | % | 14.6 | % | 14.9 | % | 14.5 | % | 17.2 | % | 18.6 | % | 15.3 | % | |||||||||||||||||||||||||||
| Net (loss) income | (16.7) | % | (9.9) | % | (17.3) | % | (16.2) | % | (15.2) | % | 73.7 | % | (16.9) | % | |||||||||||||||||||||||||||
| Ratios: | |||||||||||||||||||||||||||||||||||||||||
| Adjusted EBITDA / Interest expense | 4.0 | x | 3.9 | x | 4.0 | x | 4.1 | x | 3.6 | x | 3.1 | x | 4.0 | x | |||||||||||||||||||||||||||
Consolidated Balance Sheets (In thousands, except per share data) (Unaudited) | | ||||
| June 30, 2022 | March 31, 2022 | December 31, 2021 | September 30, 2021 | June 30, 2021 | |||||||||||||||||||||||||
| Assets | |||||||||||||||||||||||||||||
| Land | $ | 373,171 | $ | 340,046 | $ | 322,623 | $ | 306,507 | $ | 301,709 | |||||||||||||||||||
| Income producing property | 1,875,307 | 1,733,326 | 1,642,147 | 1,544,217 | 1,490,975 | ||||||||||||||||||||||||
| 2,248,478 | 2,073,372 | 1,964,770 | 1,850,724 | 1,792,684 | |||||||||||||||||||||||||
| Accumulated depreciation and amortization | (441,105) | (421,663) | (402,560) | (384,392) | (367,519) | ||||||||||||||||||||||||
| Net income producing property | 1,807,373 | 1,651,709 | 1,562,210 | 1,466,332 | 1,425,165 | ||||||||||||||||||||||||
| Properties under development or held for future development | 31,220 | 31,157 | 30,631 | 30,254 | 30,065 | ||||||||||||||||||||||||
| Total real estate held for investment, net | 1,838,593 | 1,682,866 | 1,592,841 | 1,496,586 | 1,455,230 | ||||||||||||||||||||||||
| Investment in real estate held for sale, net | — | — | — | — | 779,121 | ||||||||||||||||||||||||
| Cash and cash equivalents | 44,787 | 139,711 | 233,600 | 307,797 | 5,435 | ||||||||||||||||||||||||
| Restricted cash | 1,984 | 636 | 620 | 605 | 595 | ||||||||||||||||||||||||
| Rents and other receivables | 16,644 | 16,120 | 15,067 | 14,713 | 15,079 | ||||||||||||||||||||||||
| Prepaid expenses and other assets | 32,865 | 37,391 | 33,866 | 33,109 | 28,297 | ||||||||||||||||||||||||
| Other assets related to properties sold or held for sale | — | — | — | — | 84,648 | ||||||||||||||||||||||||
| Total assets | $ | 1,934,873 | $ | 1,876,724 | $ | 1,875,994 | $ | 1,852,810 | $ | 2,368,405 | |||||||||||||||||||
| Liabilities | |||||||||||||||||||||||||||||
| Notes payable, net | $ | 497,135 | $ | 497,093 | $ | 496,946 | $ | 496,823 | $ | 945,905 | |||||||||||||||||||
| Mortgage notes payable, net | 71,576 | — | — | — | — | ||||||||||||||||||||||||
| Line of credit | — | — | — | — | 43,000 | ||||||||||||||||||||||||
| Accounts payable and other liabilities | 39,890 | 33,184 | 40,585 | 38,864 | 47,897 | ||||||||||||||||||||||||
| Dividend payable | 14,916 | 14,924 | 14,650 | 14,440 | 25,474 | ||||||||||||||||||||||||
| Advance rents | 1,821 | 1,463 | 2,082 | 1,747 | 1,572 | ||||||||||||||||||||||||
| Tenant security deposits | 5,439 | 4,817 | 4,669 | 4,480 | 4,374 | ||||||||||||||||||||||||
| Other liabilities related to properties sold or held for sale | — | — | — | — | 23,748 | ||||||||||||||||||||||||
| Total liabilities | 630,777 | 551,481 | 558,932 | 556,354 | 1,091,970 | ||||||||||||||||||||||||
| Equity | |||||||||||||||||||||||||||||
| Preferred shares; $0.01 par value; 10,000 shares authorized | — | — | — | — | — | ||||||||||||||||||||||||
| Shares of beneficial interest, $0.01 par value; 150,000 shares authorized | 874 | 874 | 863 | 846 | 846 | ||||||||||||||||||||||||
| Additional paid-in capital | 1,727,031 | 1,725,828 | 1,697,477 | 1,656,821 | 1,654,409 | ||||||||||||||||||||||||
| Distributions in excess of net income | (408,882) | (385,108) | (362,494) | (341,052) | (357,934) | ||||||||||||||||||||||||
| Accumulated other comprehensive loss | (15,229) | (16,656) | (19,091) | (20,468) | (21,200) | ||||||||||||||||||||||||
| Total shareholders' equity | 1,303,794 | 1,324,938 | 1,316,755 | 1,296,147 | 1,276,121 | ||||||||||||||||||||||||
| Noncontrolling interests in subsidiaries | 302 | 305 | 307 | 309 | 314 | ||||||||||||||||||||||||
| Total equity | 1,304,096 | 1,325,243 | 1,317,062 | 1,296,456 | 1,276,435 | ||||||||||||||||||||||||
| Total liabilities and equity | $ | 1,934,873 | $ | 1,876,724 | $ | 1,875,994 | $ | 1,852,810 | $ | 2,368,405 | |||||||||||||||||||
Funds from Operations (In thousands, except per share data) (Unaudited) | | ||||
| Six Months Ended | Three Months Ended | ||||||||||||||||||||||||||||||||||||||||
| June 30, 2022 | June 30, 2021 | June 30, 2022 | March 31, 2022 | December 31, 2021 | September 30, 2021 | June 30, 2021 | |||||||||||||||||||||||||||||||||||
Funds from operations (FFO) (1) | |||||||||||||||||||||||||||||||||||||||||
| Net (loss) income | $ | (16,598) | $ | (8,139) | $ | (8,874) | $ | (7,724) | $ | (6,796) | $ | 31,319 | $ | (6,992) | |||||||||||||||||||||||||||
| Real estate depreciation and amortization | 46,239 | 34,290 | 24,039 | 22,200 | 20,114 | 18,252 | 17,303 | ||||||||||||||||||||||||||||||||||
| Discontinued operations: | |||||||||||||||||||||||||||||||||||||||||
| Gain on sale of depreciable real estate, net | — | — | — | — | — | (46,441) | — | ||||||||||||||||||||||||||||||||||
| Real estate depreciation and amortization | — | 22,904 | — | — | — | — | 10,248 | ||||||||||||||||||||||||||||||||||
| NAREIT funds from operations (FFO) | 29,641 | 49,055 | 15,165 | 14,476 | 13,318 | 3,130 | 20,559 | ||||||||||||||||||||||||||||||||||
| Loss on extinguishment of debt | — | — | — | — | — | 12,727 | — | ||||||||||||||||||||||||||||||||||
| Loss on interest rate derivatives | — | 5,760 | — | — | — | 106 | 5,760 | ||||||||||||||||||||||||||||||||||
| Severance expense | 474 | 173 | — | 474 | — | — | — | ||||||||||||||||||||||||||||||||||
| Transformation costs | 4,246 | 3,780 | 2,023 | 2,223 | 1,839 | 1,016 | 3,780 | ||||||||||||||||||||||||||||||||||
| Insurance gain | — | — | — | — | (1,026) | — | — | ||||||||||||||||||||||||||||||||||
| Structuring expenses | 980 | — | 980 | — | — | — | — | ||||||||||||||||||||||||||||||||||
Core FFO (1) | 35,341 | 58,768 | 18,168 | 17,173 | 14,131 | 16,979 | 30,099 | ||||||||||||||||||||||||||||||||||
Allocation to participating securities (2) | (123) | (276) | (51) | (72) | (44) | (73) | (137) | ||||||||||||||||||||||||||||||||||
| NAREIT FFO per share - basic | $ | 0.34 | $ | 0.58 | $ | 0.17 | $ | 0.17 | $ | 0.16 | $ | 0.04 | $ | 0.24 | |||||||||||||||||||||||||||
| NAREIT FFO per share - fully diluted | $ | 0.34 | $ | 0.58 | $ | 0.17 | $ | 0.17 | $ | 0.16 | $ | 0.04 | $ | 0.24 | |||||||||||||||||||||||||||
| Core FFO per share - fully diluted | $ | 0.40 | $ | 0.69 | $ | 0.21 | $ | 0.20 | $ | 0.17 | $ | 0.20 | $ | 0.35 | |||||||||||||||||||||||||||
| Common dividend per share | $ | 0.34 | $ | 0.60 | $ | 0.17 | $ | 0.17 | $ | 0.17 | $ | 0.17 | $ | 0.30 | |||||||||||||||||||||||||||
| Average shares - basic | 87,303 | 84,437 | 87,392 | 87,214 | 84,804 | 84,496 | 84,461 | ||||||||||||||||||||||||||||||||||
| Average shares - fully diluted (for NAREIT FFO and Core FFO) | 87,388 | 84,507 | 87,521 | 87,253 | 84,911 | 84,586 | 84,519 | ||||||||||||||||||||||||||||||||||
______________________________ | |||||||||||||||||||||||||||||||||||||||||
(1) See "Definitions" on page 11 for the definitions of NAREIT FFO and Core FFO. | |||||||||||||||||||||||||||||||||||||||||
(2) Adjustment to the numerators for FFO and Core FFO per share calculations when applying the two-class method for calculating EPS. | |||||||||||||||||||||||||||||||||||||||||
Adjusted Funds from Operations (In thousands, except per share data) (Unaudited) | | ||||
| Six Months Ended | Three Months Ended | ||||||||||||||||||||||||||||||||||||||||
| June 30, 2022 | June 30, 2021 | June 30, 2022 | March 31, 2022 | December 31, 2021 | September 30, 2021 | June 30, 2021 | |||||||||||||||||||||||||||||||||||
Adjusted funds from operations (AFFO) (1) | |||||||||||||||||||||||||||||||||||||||||
| NAREIT FFO | $ | 29,641 | $ | 49,055 | $ | 15,165 | $ | 14,476 | $ | 13,318 | $ | 3,130 | $ | 20,559 | |||||||||||||||||||||||||||
| Non-cash loss on extinguishment of debt | — | — | — | — | — | 833 | — | ||||||||||||||||||||||||||||||||||
| Tenant improvements and incentives, net of reimbursements | (1,025) | (573) | (476) | (549) | (642) | (331) | (1,112) | ||||||||||||||||||||||||||||||||||
| Leasing commissions capitalized | — | (2,406) | — | — | (24) | (378) | (1,868) | ||||||||||||||||||||||||||||||||||
| Recurring capital improvements | (2,622) | (2,023) | (1,384) | (1,238) | (1,366) | (1,485) | (1,156) | ||||||||||||||||||||||||||||||||||
| Straight-line rent, net | (325) | (1,173) | (135) | (190) | (218) | (347) | (625) | ||||||||||||||||||||||||||||||||||
| Non-cash fair value interest expense | 105 | — | 105 | — | — | — | — | ||||||||||||||||||||||||||||||||||
| Non-real estate depreciation and amortization of debt costs | 2,359 | 2,694 | 1,151 | 1,208 | 1,241 | 1,330 | 1,350 | ||||||||||||||||||||||||||||||||||
| Amortization of lease intangibles, net | (381) | 572 | (209) | (172) | (172) | (32) | 195 | ||||||||||||||||||||||||||||||||||
Amortization and expensing of restricted share and unit compensation (2) | 4,240 | 3,827 | 2,159 | 2,081 | 2,075 | 2,651 | 2,163 | ||||||||||||||||||||||||||||||||||
| AFFO | 31,992 | 49,973 | 16,376 | 15,616 | 14,212 | 5,371 | 19,506 | ||||||||||||||||||||||||||||||||||
| Cash loss on extinguishment of debt | — | — | — | — | — | 11,894 | — | ||||||||||||||||||||||||||||||||||
| Loss on interest rate derivatives | — | 5,760 | — | — | — | 106 | 5,760 | ||||||||||||||||||||||||||||||||||
| Non-share-based severance expense | 202 | 103 | — | 202 | — | — | — | ||||||||||||||||||||||||||||||||||
| Structuring expenses | 980 | — | 980 | — | — | — | — | ||||||||||||||||||||||||||||||||||
Transformation costs (3) | 3,938 | 3,703 | 1,776 | 2,162 | 1,802 | 674 | 3,703 | ||||||||||||||||||||||||||||||||||
| Insurance gain | — | — | — | — | (1,026) | — | — | ||||||||||||||||||||||||||||||||||
Core AFFO (1) | $ | 37,112 | $ | 59,539 | $ | 19,132 | $ | 17,980 | $ | 14,988 | $ | 18,045 | $ | 28,969 | |||||||||||||||||||||||||||
______________________________ | |||||||||||||||||||||||||||||||||||||||||
(1) See "Definitions" on page 11 for the definitions of AFFO and Core AFFO | |||||||||||||||||||||||||||||||||||||||||
(2) Includes share award modifications related to transformation costs | |||||||||||||||||||||||||||||||||||||||||
(3) Excludes share award modifications related to transformation costs | |||||||||||||||||||||||||||||||||||||||||
Net Operating Income (NOI) - Multifamily (Dollars In thousands) | | ||||
| Apartment Homes as of 6/30/2022 | Six Months Ended | Three Months Ended | |||||||||||||||||||||||||||||||||||||||||||||
| June 30, 2022 | June 30, 2021 | June 30, 2022 | March 31, 2022 | December 31, 2021 | September 30, 2021 | June 30, 2021 | |||||||||||||||||||||||||||||||||||||||||
| Rental and other property revenues | |||||||||||||||||||||||||||||||||||||||||||||||
Same-store (1) | 6,658 | $ | 73,931 | $ | 70,233 | $ | 37,198 | $ | 36,733 | $ | 35,660 | $ | 35,408 | $ | 35,321 | ||||||||||||||||||||||||||||||||
Acquisitions (2) | 1,809 | 10,568 | — | 6,643 | 3,925 | 1,774 | 488 | — | |||||||||||||||||||||||||||||||||||||||
Development (3) | 401 | 4,931 | 2,306 | 2,500 | 2,431 | 2,223 | 1,846 | 1,330 | |||||||||||||||||||||||||||||||||||||||
Non-residential (4) | N/A | 550 | 490 | 305 | 245 | 233 | 304 | 211 | |||||||||||||||||||||||||||||||||||||||
| Total rental and other property revenues | 8,868 | 89,980 | 73,029 | 46,646 | 43,334 | 39,890 | 38,046 | 36,862 | |||||||||||||||||||||||||||||||||||||||
| Property operating expenses | |||||||||||||||||||||||||||||||||||||||||||||||
| Same-store | 26,397 | 25,586 | 13,259 | 13,138 | 12,523 | 13,003 | 12,550 | ||||||||||||||||||||||||||||||||||||||||
| Acquisitions | 4,892 | — | 3,049 | 1,843 | 653 | 212 | — | ||||||||||||||||||||||||||||||||||||||||
| Development | 1,779 | 1,574 | 934 | 845 | 838 | 846 | 853 | ||||||||||||||||||||||||||||||||||||||||
| Non-residential | 145 | 134 | 70 | 75 | 73 | 85 | 65 | ||||||||||||||||||||||||||||||||||||||||
| Total property operating expenses | 33,213 | 27,294 | 17,312 | 15,901 | 14,087 | 14,146 | 13,468 | ||||||||||||||||||||||||||||||||||||||||
| Net Operating Income (NOI) | |||||||||||||||||||||||||||||||||||||||||||||||
| Same-store | 47,534 | 44,647 | 23,939 | 23,595 | 23,137 | 22,405 | 22,771 | ||||||||||||||||||||||||||||||||||||||||
| Acquisitions | 5,676 | — | 3,594 | 2,082 | 1,121 | 276 | — | ||||||||||||||||||||||||||||||||||||||||
| Development | 3,152 | 732 | 1,566 | 1,586 | 1,385 | 1,000 | 477 | ||||||||||||||||||||||||||||||||||||||||
| Non-residential | 405 | 356 | 235 | 170 | 160 | 219 | 146 | ||||||||||||||||||||||||||||||||||||||||
| Total NOI | $ | 56,767 | $ | 45,735 | $ | 29,334 | $ | 27,433 | $ | 25,803 | $ | 23,900 | $ | 23,394 | |||||||||||||||||||||||||||||||||
| Same-store metrics | |||||||||||||||||||||||||||||||||||||||||||||||
| Operating margin | 64% | 64% | 64% | 64% | 65% | 63% | 64% | ||||||||||||||||||||||||||||||||||||||||
| Retention | 66% | 54% | 63% | 71% | 72% | 60% | 57% | ||||||||||||||||||||||||||||||||||||||||
| Same-store effective lease rate growth | |||||||||||||||||||||||||||||||||||||||||||||||
| New | 11.1% | (11.0)% | 11.7% | 10.0% | 8.7% | 3.2% | (8.1)% | ||||||||||||||||||||||||||||||||||||||||
| Renewal | 10.2% | 2.8% | 10.9% | 9.2% | 8.2% | 5.1% | 3.5% | ||||||||||||||||||||||||||||||||||||||||
| Blended | 10.6% | (4.0)% | 11.2% | 9.5% | 8.4% | 4.3% | (2.1)% | ||||||||||||||||||||||||||||||||||||||||
Same-Store Operating Results - Multifamily (Dollars in thousands, except Average Effective Monthly Rent per Home) | | ||||
| Rental and Other Property Revenue | Property Operating Expenses | Net Operating Income | Average Occupancy | Average Effective Monthly Rent per Home | ||||||||||||||||||||||||||||||||||||||||||||||||||||||||||||||||||||||||||||||||||||||||||||||
| Quarter-to-Date Comparison | Apt Homes | Q2 2022 | Q2 2021 | % Chg | Q2 2022 | Q2 2021 | % Chg | Q2 2022 | Q2 2021 | % Chg | Q2 2022 | Q2 2021 | % Chg | Q2 2022 | Q2 2021 | % Chg | ||||||||||||||||||||||||||||||||||||||||||||||||||||||||||||||||||||||||||||||||||
| Virginia | 5,138 | $ | 29,112 | $ | 27,507 | 5.8 | % | $ | 10,292 | $ | 9,568 | 7.6 | % | $ | 18,820 | $ | 17,939 | 4.9 | % | 95.7 | % | 95.3 | % | 0.4 | % | $ | 1,789 | $ | 1,657 | 8.0 | % | |||||||||||||||||||||||||||||||||||||||||||||||||||||||||||||||||||
| DC / Maryland | 1,520 | 8,086 | 7,814 | 3.5 | % | 2,967 | 2,982 | (0.5) | % | 5,119 | 4,832 | 5.9 | % | 96.4 | % | 94.3 | % | 2.1 | % | 1,756 | 1,685 | 4.2 | % | |||||||||||||||||||||||||||||||||||||||||||||||||||||||||||||||||||||||||||
| DC Metro Total | 6,658 | $ | 37,198 | $ | 35,321 | 5.3 | % | $ | 13,259 | $ | 12,550 | 5.6 | % | $ | 23,939 | $ | 22,771 | 5.1 | % | 95.8 | % | 95.1 | % | 0.7 | % | $ | 1,781 | $ | 1,664 | 7.0 | % | |||||||||||||||||||||||||||||||||||||||||||||||||||||||||||||||||||
| Sequential Comparison | Apt Homes | Q2 2022 | Q1 2022 | % Chg | Q2 2022 | Q1 2022 | % Chg | Q2 2022 | Q1 2022 | % Chg | Q2 2022 | Q1 2022 | % Chg | Q2 2022 | Q1 2022 | % Chg | ||||||||||||||||||||||||||||||||||||||||||||||||||||||||||||||||||||||||||||||||||
| Virginia | 5,138 | $ | 29,112 | $ | 28,678 | 1.5 | % | $ | 10,292 | $ | 10,184 | 1.1 | % | $ | 18,820 | $ | 18,494 | 1.8 | % | 95.7 | % | 95.7 | % | — | % | $ | 1,789 | $ | 1,738 | 2.9 | % | |||||||||||||||||||||||||||||||||||||||||||||||||||||||||||||||||||
| DC / Maryland | 1,520 | 8,086 | 8,055 | 0.4 | % | 2,967 | 2,954 | 0.4 | % | 5,119 | 5,101 | 0.4 | % | 96.4 | % | 96.1 | % | 0.3 | % | 1,756 | 1,719 | 2.2 | % | |||||||||||||||||||||||||||||||||||||||||||||||||||||||||||||||||||||||||||
| DC Metro Total | 6,658 | $ | 37,198 | $ | 36,733 | 1.3 | % | $ | 13,259 | $ | 13,138 | 0.9 | % | $ | 23,939 | $ | 23,595 | 1.5 | % | 95.8 | % | 95.8 | % | — | % | $ | 1,781 | $ | 1,734 | 2.7 | % | |||||||||||||||||||||||||||||||||||||||||||||||||||||||||||||||||||
| Year-to-Date Comparison | Apt Homes | YTD 2022 | YTD 2021 | % Chg | YTD 2022 | YTD 2021 | % Chg | YTD 2022 | YTD 2021 | % Chg | YTD 2022 | YTD 2021 | % Chg | YTD 2022 | YTD 2021 | % Chg | ||||||||||||||||||||||||||||||||||||||||||||||||||||||||||||||||||||||||||||||||||
| Virginia | 5,138 | $ | 57,790 | $ | 54,816 | 5.4 | % | $ | 20,476 | $ | 19,665 | 4.1 | % | $ | 37,314 | $ | 35,151 | 6.2 | % | 95.7 | % | 95.1 | % | 0.6 | % | $ | 1,763 | $ | 1,665 | 5.9 | % | |||||||||||||||||||||||||||||||||||||||||||||||||||||||||||||||||||
| DC / Maryland | 1,520 | 16,141 | 15,417 | 4.7 | % | 5,921 | 5,921 | — | % | 10,220 | 9,496 | 7.6 | % | 96.2 | % | 93.2 | % | 3.0 | % | 1,738 | 1,699 | 2.3 | % | |||||||||||||||||||||||||||||||||||||||||||||||||||||||||||||||||||||||||||
| DC Metro Total | 6,658 | $ | 73,931 | $ | 70,233 | 5.3 | % | $ | 26,397 | $ | 25,586 | 3.2 | % | $ | 47,534 | $ | 44,647 | 6.5 | % | 95.8 | % | 94.7 | % | 1.1 | % | $ | 1,758 | $ | 1,673 | 5.1 | % | |||||||||||||||||||||||||||||||||||||||||||||||||||||||||||||||||||
Same-Store Operating Expenses - Multifamily (In thousands) | | ||||
| Quarter-to-Date Comparison | Q2 2022 | Q2 2021 | $ Change | % Change | % of Q2 2022 Total | ||||||||||||||||||||||||
Controllable (1) | $ | 6,744 | $ | 6,586 | $ | 158 | 2.4 | % | 50.9 | % | |||||||||||||||||||
Non-Controllable (2) | 6,515 | 5,964 | 551 | 9.2 | % | 49.1 | % | ||||||||||||||||||||||
| Total same-store operating expenses | $ | 13,259 | $ | 12,550 | $ | 709 | 5.6 | % | 100.0 | % | |||||||||||||||||||
| Sequential Comparison | Q2 2022 | Q1 2022 | $ Change | % Change | % of Q2 2022 Total | ||||||||||||||||||||||||
| Controllable | $ | 6,744 | $ | 6,336 | $ | 408 | 6.4 | % | 50.9 | % | |||||||||||||||||||
| Non-Controllable | 6,515 | 6,802 | (287) | (4.2) | % | 49.1 | % | ||||||||||||||||||||||
| Total same-store operating expenses | $ | 13,259 | $ | 13,138 | $ | 121 | 0.9 | % | 100.0 | % | |||||||||||||||||||
| Year-to-Date Comparison | YTD 2022 | YTD 2021 | $ Change | % Change | % of YTD 2022 Total | ||||||||||||||||||||||||
| Controllable | $ | 13,080 | $ | 13,009 | $ | 71 | 0.5 | % | 49.6 | % | |||||||||||||||||||
| Non-Controllable | 13,317 | 12,577 | 740 | 5.9 | % | 50.4 | % | ||||||||||||||||||||||
| Total same-store operating expenses | $ | 26,397 | $ | 25,586 | $ | 811 | 3.2 | % | 100.0 | % | |||||||||||||||||||
______________________________ | ||
(1) Controllable operating expenses consist of: | ||
| Payroll, Repairs & Maintenance, Marketing, Administrative and other | ||
(2) Non-Controllable operating expenses consist of: | ||
| Utilities, Insurance and Real Estate Taxes | ||
Acquisition and Disposition Summary (Dollars in thousands) | | ||||
| Acquisitions | |||||||||||||||||||||||||||||
| Location | Acquisition Date | Number of Homes | Ending Occupancy (As of June 30, 2022) | Contract Purchase Price | |||||||||||||||||||||||||
| Carlyle of Sandy Springs | Sandy Springs, GA | February 1, 2022 | 389 | 94.3% | $ | 105,586 | |||||||||||||||||||||||
| Alder Park | Smyrna, GA | May 5, 2022 | 270 | 95.9% | 69,750 | ||||||||||||||||||||||||
| Marietta Crossing | Marietta, GA | May 5, 2022 | 420 | 91.2% | 107,900 | ||||||||||||||||||||||||
| Total 2022 | 1,079 | $ | 283,236 | ||||||||||||||||||||||||||
| The Oxford | Conyers, GA | August 10, 2021 | 240 | 95.0% | $ | 48,000 | |||||||||||||||||||||||
Assembly Eagles Landing (1) | Stockbridge, GA | November 19, 2021 | 490 | 95.7% | 106,000 | ||||||||||||||||||||||||
| Total 2021 | 730 | $ | 154,000 | ||||||||||||||||||||||||||
| Dispositions | |||||||||||||||||||||||||||||
| Location | Disposition Date | Square Feet | Contract Sales Price (in thousands) | GAAP (Loss) Gain on Sale | |||||||||||||||||||||||||
Office Portfolio (2) | VA, DC | July 26, 2021 | 2,370,000 | $ | 766,000 | $ | (11,220) | ||||||||||||||||||||||
Retail Portfolio (3) | VA, DC, MD | September 22, 2021 | 693,000 | 168,314 | 57,661 | ||||||||||||||||||||||||
| Total 2021 | 3,063,000 | $ | 934,314 | $ | 46,441 | ||||||||||||||||||||||||
| Multifamily Communities | | ||||
| June 30, 2022 | |||||
| Property | Location | Apartment Homes | Current Strategy | Year Acquired | Year Built | Average Occupancy (1) | Ending Occupancy | % of Total Portfolio NOI (1) | |||||||||||||||||||||
| Virginia | |||||||||||||||||||||||||||||
| Assembly Alexandria | Alexandria, VA | 532 | B Value-Add | 2019 | 1990 | 95.7% | 94.0% | 6% | |||||||||||||||||||||
| Cascade at Landmark | Alexandria, VA | 277 | B Value-Add | 2019 | 1988 | 95.8% | 95.3% | 4% | |||||||||||||||||||||
| Clayborne | Alexandria, VA | 74 | A- | N/A | 2008 | 95.8% | 97.3% | 1% | |||||||||||||||||||||
| Riverside Apartments | Alexandria, VA | 1,222 | B Value-Add | 2016 | 1971 | 95.1% | 94.2% | 13% | |||||||||||||||||||||
| Bennett Park | Arlington, VA | 224 | A- | N/A | 2007 | 96.9% | 97.8% | 4% | |||||||||||||||||||||
| Park Adams | Arlington, VA | 200 | B | 1969 | 1959 | 96.8% | 96.5% | 2% | |||||||||||||||||||||
| The Maxwell | Arlington, VA | 163 | A- | N/A | 2014 | 96.0% | 96.3% | 2% | |||||||||||||||||||||
| The Paramount | Arlington, VA | 135 | B | 2013 | 1984 | 96.0% | 97.0% | 2% | |||||||||||||||||||||
| The Wellington | Arlington, VA | 711 | B Value-Add | 2015 | 1960 | 95.5% | 96.9% | 7% | |||||||||||||||||||||
| Roosevelt Towers | Falls Church, VA | 191 | B | 1965 | 1964 | 95.4% | 96.3% | 2% | |||||||||||||||||||||
| Assembly Dulles | Herndon, VA | 328 | B Value-Add | 2019 | 2000 | 95.3% | 93.9% | 4% | |||||||||||||||||||||
| Assembly Herndon | Herndon, VA | 283 | B Value-Add | 2019 | 1991 | 96.3% | 95.8% | 3% | |||||||||||||||||||||
| Assembly Leesburg | Leesburg, VA | 134 | B | 2019 | 1986 | 96.8% | 96.3% | 2% | |||||||||||||||||||||
| Assembly Manassas | Manassas, VA | 408 | B Value-Add | 2019 | 1986 | 96.0% | 95.3% | 4% | |||||||||||||||||||||
| The Ashby at McLean | McLean, VA | 256 | B | 1996 | 1982 | 95.2% | 96.1% | 4% | |||||||||||||||||||||
| Washington, DC | |||||||||||||||||||||||||||||
| 3801 Connecticut Avenue | Washington, DC | 307 | B Value-Add | 1963 | 1951 | 96.3% | 97.1% | 3% | |||||||||||||||||||||
| Kenmore Apartments | Washington, DC | 374 | B Value-Add | 2008 | 1948 | 95.7% | 95.7% | 3% | |||||||||||||||||||||
| Yale West | Washington, DC | 216 | A- | 2014 | 2011 | 95.7% | 95.4% | 3% | |||||||||||||||||||||
| Maryland | |||||||||||||||||||||||||||||
| Bethesda Hill Apartments | Bethesda, MD | 195 | B | 1997 | 1986 | 95.9% | 95.4% | 3% | |||||||||||||||||||||
| Assembly Watkins Mill | Gaithersburg, MD | 210 | B | 2019 | 1975 | 97.3% | 96.7% | 2% | |||||||||||||||||||||
| Assembly Germantown | Germantown, MD | 218 | B Value-Add | 2019 | 1990 | 96.8% | 97.7% | 2% | |||||||||||||||||||||
| Total same-store communities | 6,658 | 95.8% | 95.6% | 76% | |||||||||||||||||||||||||
| Multifamily Communities (Continued) | | ||||
| June 30, 2022 | |||||
| Property | Location | Apartment Homes | Current Strategy | Year Acquired | Year Built | Average Occupancy (1) | Ending Occupancy | % of Total Portfolio NOI (1) | |||||||||||||||||||||
| Virginia | |||||||||||||||||||||||||||||
| Trove | Arlington, VA | 401 | A | N/A | 2020 | 95.2% | 95.0% | 5% | |||||||||||||||||||||
Georgia | |||||||||||||||||||||||||||||
| The Oxford | Conyers, GA | 240 | B | 2021 | 1999 | 94.5% | 95.0% | 1% | |||||||||||||||||||||
| Marietta Crossing | Marietta, GA | 420 | B Value-Add | 2022 | 1975 | 91.8% | 91.2% | 1% | |||||||||||||||||||||
| Carlyle of Sandy Springs | Sandy Springs, GA | 389 | B Value-Add | 2022 | 1972 | 94.7% | 94.3% | 2% | |||||||||||||||||||||
| Alder Park | Smyrna, GA | 270 | B Value-Add | 2022 | 1982 | 91.9% | 95.9% | 1% | |||||||||||||||||||||
| Assembly Eagles Landing | Stockbridge, GA | 490 | B | 2021 | 2000 | 94.9% | 95.7% | 3% | |||||||||||||||||||||
| Total non same-store communities | 2,210 | 94.5% | 94.4% | 13% | |||||||||||||||||||||||||
| Total multifamily communities | 8,868 | 95.5% | 95.3% | 89% | |||||||||||||||||||||||||
| Office Property | | ||||
| June 30, 2022 | |||||
| Property | Location | Year Acquired | Year Built | Net Rentable Square Feet | Leased % (1) | Ending Occupancy (1) | % of Total Portfolio NOI (2) | |||||||||||||||||||||||||||||||||||||
| Washington, DC | ||||||||||||||||||||||||||||||||||||||||||||
| Watergate 600 | Washington, DC | 2017 | 1972/1997 | 300,000 | 92.1% | 92.1% | 11 | % | ||||||||||||||||||||||||||||||||||||
Adjusted Earnings Before Interest, Taxes, Depreciation and Amortization (EBITDA) (In thousands) (Unaudited) | | ||||
| Six Months Ended | Three Months Ended | ||||||||||||||||||||||||||||||||||||||||
| June 30, 2022 | June 30, 2021 | June 30, 2022 | March 31, 2022 | December 31, 2021 | September 30, 2021 | June 30, 2021 | |||||||||||||||||||||||||||||||||||
Adjusted EBITDA (1) | |||||||||||||||||||||||||||||||||||||||||
| Net (loss) income | $ | (16,598) | $ | (8,139) | $ | (8,874) | $ | (7,724) | $ | (6,796) | $ | 31,319 | $ | (6,992) | |||||||||||||||||||||||||||
| Add/(deduct): | |||||||||||||||||||||||||||||||||||||||||
| Interest expense | 11,806 | 20,281 | 6,156 | 5,650 | 5,676 | 8,106 | 10,158 | ||||||||||||||||||||||||||||||||||
| Real estate depreciation and amortization | 46,239 | 57,194 | 24,039 | 22,200 | 20,114 | 18,252 | 27,551 | ||||||||||||||||||||||||||||||||||
| Income tax expense | — | — | — | — | 526 | — | — | ||||||||||||||||||||||||||||||||||
| Non-real estate depreciation | 455 | 467 | 248 | 207 | 239 | 234 | 234 | ||||||||||||||||||||||||||||||||||
| Severance expense | 474 | 173 | — | 474 | — | — | — | ||||||||||||||||||||||||||||||||||
| Transformation costs | 4,246 | 3,780 | 2,023 | 2,223 | 1,839 | 1,016 | 3,780 | ||||||||||||||||||||||||||||||||||
| Structuring expenses | 980 | — | 980 | — | — | — | — | ||||||||||||||||||||||||||||||||||
| Gain on sale of depreciable real estate, net | — | — | — | — | — | (46,441) | — | ||||||||||||||||||||||||||||||||||
| Loss on extinguishment of debt | — | — | — | — | — | 12,727 | — | ||||||||||||||||||||||||||||||||||
| Loss on interest rate derivatives | — | 5,760 | — | — | — | 106 | 5,760 | ||||||||||||||||||||||||||||||||||
| Insurance gain | — | — | — | — | (1,026) | — | — | ||||||||||||||||||||||||||||||||||
| Adjusted EBITDA | $ | 47,602 | $ | 79,516 | $ | 24,572 | $ | 23,030 | $ | 20,572 | $ | 25,319 | $ | 40,491 | |||||||||||||||||||||||||||
______________________________ | |||||||||||||||||||||||||||||||||||||||||
(1) Adjusted EBITDA is earnings before interest expense, taxes, depreciation, amortization, gain/loss on sale of real estate, casualty gain/loss, real estate impairment, gain/loss on extinguishment of debt, gain/loss on interest rate derivatives, severance expense, acquisition expenses, gain from non-disposal activities and transformation costs. We consider Adjusted EBITDA to be an appropriate supplemental performance measure because it permits investors to view income from operations without the effect of depreciation, and the cost of debt or non-operating gains and losses. Adjusted EBITDA is a non-GAAP measure. | |||||||||||||||||||||||||||||||||||||||||
Long Term Debt Analysis (Dollars in thousands) | | ||||
| June 30, 2022 | March 31, 2022 | December 31, 2021 | September 30, 2021 | June 30, 2021 | |||||||||||||||||||||||||
| Balances Outstanding | |||||||||||||||||||||||||||||
| Secured | |||||||||||||||||||||||||||||
Mortgage note payable, net (1) | $ | 71,576 | $ | — | $ | — | $ | — | $ | — | |||||||||||||||||||
| Unsecured | |||||||||||||||||||||||||||||
| Fixed rate bonds | $ | 397,236 | $ | 397,147 | $ | 397,058 | $ | 396,993 | $ | 696,387 | |||||||||||||||||||
| Term loan | 99,900 | 99,946 | 99,888 | 99,830 | 249,518 | ||||||||||||||||||||||||
| Credit facility | — | — | — | — | 43,000 | ||||||||||||||||||||||||
| Total | $ | 568,712 | $ | 497,093 | $ | 496,946 | $ | 496,823 | $ | 988,905 | |||||||||||||||||||
| Weighted Average Interest Rates | |||||||||||||||||||||||||||||
| Secured | |||||||||||||||||||||||||||||
| Mortgage note payable, net | 4.3 | % | — | % | — | % | — | % | — | % | |||||||||||||||||||
| Unsecured | |||||||||||||||||||||||||||||
| Fixed rate bonds | 4.5 | % | 4.5 | % | 4.5 | % | 4.5 | % | 4.3 | % | |||||||||||||||||||
Term loan (2) | 2.3 | % | 2.3 | % | 2.3 | % | 2.3 | % | 2.9 | % | |||||||||||||||||||
| Credit facility | — | % | — | % | — | % | — | % | 1.1 | % | |||||||||||||||||||
| Weighted Average | 4.1 | % | 4.1 | % | 4.1 | % | 4.1 | % | 3.8 | % | |||||||||||||||||||
______________________________ | |||||||||||||||||||||||||||||
(1) WashREIT assumed mortgages of $42.8 million and $33.7 million in the acquisitions of Marietta Crossing and Alder Park, respectively, during the second quarter of 2022. The mortgages mature on May 1, 2030. | |||||||||||||||||||||||||||||
(2) WashREIT has entered into an interest rate swap to effectively fix the floating interest rate on its total $100.0 million aggregate principal of its term loan outstanding as of June 30, 2022 (see page 27). | |||||||||||||||||||||||||||||
Note: The current debt balances outstanding are shown net of discounts, premiums and unamortized debt costs (see page 27). | |||||||||||||||||||||||||||||
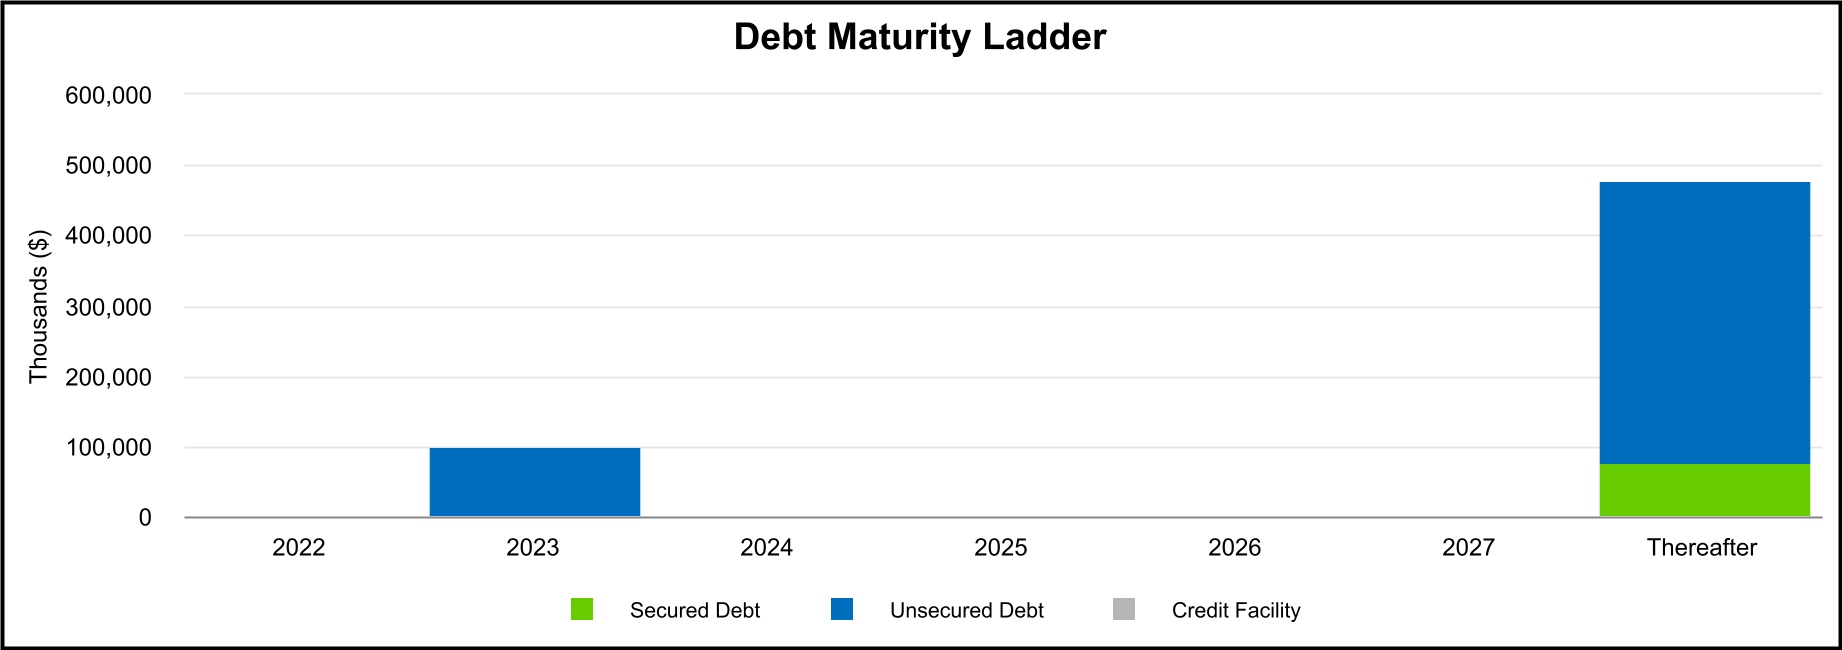
Long Term Debt Maturities (in thousands, except average interest rates) | | ||||
| June 30, 2022 | |||||
| Future Maturities of Debt | ||||||||||||||||||||||||||||||||
| Year | Secured Debt | Unsecured Debt | Credit Facility | Total Debt | Avg Interest Rate | |||||||||||||||||||||||||||
| 2022 | $ | — | $ | — | $ | — | $ | — | —% | |||||||||||||||||||||||
| 2023 | — | 100,000 | (2) | — | 100,000 | 2.3% | ||||||||||||||||||||||||||
| 2024 | — | — | — | — | —% | |||||||||||||||||||||||||||
| 2025 | — | — | — | — | —% | |||||||||||||||||||||||||||
| 2026 | — | — | — | — | —% | |||||||||||||||||||||||||||
| Thereafter | 76,554 | (1) | 400,000 | — | 476,554 | 4.5% | ||||||||||||||||||||||||||
| Scheduled principal payments | $ | 76,554 | $ | 500,000 | $ | — | $ | 576,554 | 4.1% | |||||||||||||||||||||||
| Net discounts/premiums | (4,936) | (127) | — | (5,063) | ||||||||||||||||||||||||||||
| Loan costs, net of amortization | (42) | (2,738) | — | (2,780) | ||||||||||||||||||||||||||||
| Total maturities | $ | 71,576 | $ | 497,135 | $ | — | $ | 568,711 | 4.1% | |||||||||||||||||||||||
Debt Covenant Compliance | | ||||
| Unsecured Public Debt Covenants | Unsecured Private Debt Covenants | ||||||||||||||||||||||||||||||||||
| Notes Payable | Line of Credit and Term Loans | Notes Payable | |||||||||||||||||||||||||||||||||
| Quarter Ended June 30, 2022 | Covenant | Quarter Ended June 30, 2022 | Covenant | Quarter Ended June 30, 2022 | Covenant | ||||||||||||||||||||||||||||||
% of Total Indebtedness to Total Assets(1) | 28.1 | % | ≤ 65.0% | N/A | N/A | N/A | N/A | ||||||||||||||||||||||||||||
| Ratio of Income Available for Debt Service to Annual Debt Service | 3.2 | ≥ 1.5 | N/A | N/A | N/A | N/A | |||||||||||||||||||||||||||||
% of Secured Indebtedness to Total Assets(1) | 3.5 | % | ≤ 40.0% | N/A | N/A | N/A | N/A | ||||||||||||||||||||||||||||
Ratio of Total Unencumbered Assets(2) to Total Unsecured Indebtedness | 3.7 | ≥ 1.5 | N/A | N/A | N/A | N/A | |||||||||||||||||||||||||||||
% of Net Consolidated Total Indebtedness to Consolidated Total Asset Value(3) | N/A | N/A | 22.2 | % | ≤ 60.0% | 22.2 | % | ≤ 60.0% | |||||||||||||||||||||||||||
Ratio of Consolidated Adjusted EBITDA(4) to Consolidated Fixed Charges(5) | N/A | N/A | 4.49 | ≥ 1.50 | 4.49 | ≥ 1.50 | |||||||||||||||||||||||||||||
% of Consolidated Secured Indebtedness to Consolidated Total Asset Value(3) | N/A | N/A | 3.0 | % | ≤ 40.0% | 3.0 | % | ≤ 40.0% | |||||||||||||||||||||||||||
% of Consolidated Unsecured Indebtedness to Unencumbered Pool Value(6) | N/A | N/A | 20.7 | % | ≤ 60.0% | 20.7 | % | ≤ 60.0% | |||||||||||||||||||||||||||
______________________________ | |||||||||||||||||||||||||||||||||||
Capital Analysis (In thousands, except per share amounts) | | ||||
| Three Months Ended | |||||||||||||||||||||||||||||||||||||||||
| June 30, 2022 | March 31, 2022 | December 31, 2021 | September 30, 2021 | June 30, 2021 | |||||||||||||||||||||||||||||||||||||
| Market Data | |||||||||||||||||||||||||||||||||||||||||
| Shares Outstanding | 87,392 | 87,414 | 86,261 | 84,628 | 84,590 | ||||||||||||||||||||||||||||||||||||
| Market Price per Share | $ | 21.31 | $ | 25.50 | $ | 25.85 | $ | 24.75 | $ | 23.00 | |||||||||||||||||||||||||||||||
| Equity Market Capitalization | $ | 1,862,324 | $ | 2,229,057 | $ | 2,229,847 | $ | 2,094,543 | $ | 1,945,570 | |||||||||||||||||||||||||||||||
| Total Debt | $ | 568,712 | $ | 497,093 | $ | 496,946 | $ | 496,823 | $ | 988,905 | |||||||||||||||||||||||||||||||
| Total Market Capitalization | $ | 2,431,036 | $ | 2,726,150 | $ | 2,726,793 | $ | 2,591,366 | $ | 2,934,475 | |||||||||||||||||||||||||||||||
| Total Debt to Market Capitalization | 0.23 | :1 | 0.18 | :1 | 0.18 | :1 | 0.19 | :1 | 0.34 | :1 | |||||||||||||||||||||||||||||||
Earnings to Fixed Charges(1) | -0.4x | -0.4x | -0.2x | -1.7x | -0.6x | ||||||||||||||||||||||||||||||||||||
Debt Service Coverage Ratio(2) | 4.0x | 4.1x | 3.6x | 3.1x | 4.0x | ||||||||||||||||||||||||||||||||||||
| Dividend Data | Six Months Ended | Three Months Ended | |||||||||||||||||||||||||||||||||||||||
| June 30, 2022 | June 30, 2021 | June 30, 2022 | March 31, 2022 | December 31, 2021 | September 30, 2021 | June 30, 2021 | |||||||||||||||||||||||||||||||||||
| Total Dividends Declared | $ | 29,790 | $ | 50,935 | $ | 14,900 | $ | 14,890 | $ | 14,646 | $ | 14,437 | $ | 25,473 | |||||||||||||||||||||||||||
| Common Dividend Declared per Share | $ | 0.34 | $ | 0.60 | $ | 0.17 | $ | 0.17 | $ | 0.17 | $ | 0.17 | $ | 0.30 | |||||||||||||||||||||||||||
| Payout Ratio (Core FFO basis) | 85.0 | % | 87.0 | % | 81.0 | % | 85.0 | % | 100.0 | % | 85.0 | % | 85.7 | % | |||||||||||||||||||||||||||
| Payout Ratio (Core AFFO basis) | 81.0 | % | 85.7 | % | |||||||||||||||||||||||||||||||||||||
______________________________ | |||||||||||||||||||||||||||||||||||||||||
(1) The ratio of earnings to fixed charges is computed by dividing earnings by fixed charges. For this purpose, earnings consist of income from continuing operations attributable to the controlling interests plus fixed charges, less capitalized interest. Fixed charges consist of interest expense, including amortized costs of debt issuance, plus interest costs capitalized. The earnings to fixed charges ratio includes loss on extinguishment of debt of $12.7 million for the three months ended September 30, 2021 and loss on interest rate derivatives of $5.8 million for the three months ended June 30, 2021. | |||||||||||||||||||||||||||||||||||||||||
(2) Debt service coverage ratio is computed by dividing Adjusted EBITDA (see page 25) by interest expense and principal amortization. | |||||||||||||||||||||||||||||||||||||||||