| CONTACT: | 7550 Wisconsin Ave, Suite 900 | |||||||
| Amy Hopkins | Bethesda, MD 20814 | |||||||
| Vice President, Investor Relations | Tel 202-774-3253 | |||||||
| E-Mail: ahopkins@elmecommunities.com | Fax 301-984-9610 | |||||||
| www.elmecommunities.com | ||||||||
| August 5, 2025 | ||||||||
| Elme Communities Announces Second Quarter 2025 Results | ||||||||
| Financial Results | |||||||||||
| Three months ended June 30, | |||||||||||
| 2025 | 2024 | ||||||||||
| Net loss per diluted share | $ | (0.04) | $ | (0.04) | |||||||
| Core FFO per diluted share | 0.24 | 0.23 | |||||||||
| ELME COMMUNITIES AND SUBSIDIARIES | |||||||||||||||||||||||
| FINANCIAL HIGHLIGHTS | |||||||||||||||||||||||
| (In thousands, except per share data) | |||||||||||||||||||||||
| (Unaudited) | |||||||||||||||||||||||
| Three Months Ended June 30, | Six Months Ended June 30, | ||||||||||||||||||||||
| OPERATING RESULTS | 2025 | 2024 | 2025 | 2024 | |||||||||||||||||||
| Revenue | |||||||||||||||||||||||
| Real estate rental revenue | $ | 62,099 | $ | 60,103 | $ | 123,592 | $ | 119,616 | |||||||||||||||
| Expenses | |||||||||||||||||||||||
| Property operating and maintenance | 14,624 | 13,996 | 28,799 | 27,460 | |||||||||||||||||||
| Real estate taxes and insurance | 8,038 | 7,986 | 15,857 | 16,241 | |||||||||||||||||||
| Property management | 2,256 | 2,175 | 4,502 | 4,393 | |||||||||||||||||||
| General and administrative | 7,689 | 6,138 | 16,918 | 12,334 | |||||||||||||||||||
| Depreciation and amortization | 23,560 | 23,895 | 46,799 | 48,838 | |||||||||||||||||||
| 56,167 | 54,190 | 112,875 | 109,266 | ||||||||||||||||||||
| Real estate operating income | 5,932 | 5,913 | 10,717 | 10,350 | |||||||||||||||||||
| Other income (expense) | |||||||||||||||||||||||
| Interest expense | (9,498) | (9,384) | (18,958) | (18,878) | |||||||||||||||||||
| Other income | — | — | — | 1,410 | |||||||||||||||||||
| (9,498) | (9,384) | (18,958) | (17,468) | ||||||||||||||||||||
| Net loss | $ | (3,566) | $ | (3,471) | $ | (8,241) | $ | (7,118) | |||||||||||||||
| Net loss | $ | (3,566) | $ | (3,471) | $ | (8,241) | $ | (7,118) | |||||||||||||||
| Depreciation and amortization | 23,560 | 23,895 | 46,799 | 48,838 | |||||||||||||||||||
| NAREIT funds from operations | $ | 19,994 | $ | 20,424 | $ | 38,558 | $ | 41,720 | |||||||||||||||
| Leasing commissions capitalized | (4) | — | (4) | — | |||||||||||||||||||
| Recurring capital improvements | (3,203) | (2,144) | (6,120) | (4,915) | |||||||||||||||||||
| Straight-line rents, net | 86 | 25 | 166 | 40 | |||||||||||||||||||
| Non-real estate depreciation & amortization of debt costs | 1,269 | 1,259 | 2,540 | 2,429 | |||||||||||||||||||
| Amortization of lease intangibles, net | (167) | (163) | (336) | (325) | |||||||||||||||||||
| Amortization and expensing of restricted share and unit compensation | 1,740 | 1,045 | 3,113 | 2,135 | |||||||||||||||||||
| Adjusted funds from operations | $ | 19,715 | $ | 20,446 | $ | 37,917 | $ | 41,084 | |||||||||||||||
| Three Months Ended June 30, | Six Months Ended June 30, | |||||||||||||||||||||||||
| Per share data: | 2025 | 2024 | 2025 | 2024 | ||||||||||||||||||||||
| Net loss | (Basic) | $ | (0.04) | $ | (0.04) | $ | (0.10) | $ | (0.08) | |||||||||||||||||
| (Diluted) | $ | (0.04) | $ | (0.04) | $ | (0.10) | $ | (0.08) | ||||||||||||||||||
| NAREIT FFO | (Basic) | $ | 0.23 | $ | 0.23 | $ | 0.44 | $ | 0.47 | |||||||||||||||||
| (Diluted) | $ | 0.23 | $ | 0.23 | $ | 0.43 | $ | 0.47 | ||||||||||||||||||
| Dividends paid | $ | 0.18 | $ | 0.18 | $ | 0.36 | $ | 0.36 | ||||||||||||||||||
| Weighted average shares outstanding - basic | 88,093 | 87,910 | 88,078 | 87,898 | ||||||||||||||||||||||
| Weighted average shares outstanding - diluted | 88,093 | 87,910 | 88,078 | 87,898 | ||||||||||||||||||||||
| Weighted average shares outstanding - diluted (for NAREIT FFO) | 88,414 | 87,975 | 88,436 | 87,936 | ||||||||||||||||||||||
| ELME COMMUNITIES AND SUBSIDIARIES | |||||||||||
| CONSOLIDATED BALANCE SHEETS | |||||||||||
| (In thousands, except per share data) | |||||||||||
| (Unaudited) | |||||||||||
| June 30, 2025 | December 31, 2024 | ||||||||||
| Assets | |||||||||||
| Land | $ | 383,808 | $ | 383,808 | |||||||
| Income producing property | 2,013,831 | 1,999,525 | |||||||||
| 2,397,639 | 2,383,333 | ||||||||||
| Accumulated depreciation and amortization | (662,209) | (618,299) | |||||||||
| Net income producing property | 1,735,430 | 1,765,034 | |||||||||
| Properties under development or held for future development | 30,980 | 30,980 | |||||||||
| Total real estate held for investment, net | 1,766,410 | 1,796,014 | |||||||||
| Cash and cash equivalents | 4,786 | 6,144 | |||||||||
| Restricted cash | 2,307 | 2,465 | |||||||||
| Rents and other receivables | 12,250 | 12,511 | |||||||||
| Prepaid expenses and other assets | 24,451 | 28,628 | |||||||||
| Total assets | $ | 1,810,204 | $ | 1,845,762 | |||||||
| Liabilities | |||||||||||
| Notes payable, net | $ | 523,196 | $ | 522,953 | |||||||
| Line of credit | 175,000 | 176,000 | |||||||||
| Accounts payable and other liabilities | 38,230 | 36,293 | |||||||||
| Dividend payable | 15,947 | 15,898 | |||||||||
| Advance rents | 5,079 | 6,257 | |||||||||
| Tenant security deposits | 6,282 | 6,283 | |||||||||
| Total liabilities | 763,734 | 763,684 | |||||||||
| Equity | |||||||||||
| Shareholders' equity | |||||||||||
| Preferred shares; $0.01 par value; 10,000 shares authorized; no shares issued or outstanding | — | — | |||||||||
Shares of beneficial interest, $0.01 par value; 150,000 shares authorized: 88,162 and 88,029 shares issued and outstanding, as of June 30, 2025 and December 31, 2024, respectively | 882 | 880 | |||||||||
| Additional paid in capital | 1,743,161 | 1,740,078 | |||||||||
| Distributions in excess of net income | (686,226) | (646,095) | |||||||||
| Accumulated other comprehensive loss | (11,624) | (13,066) | |||||||||
| Total shareholders' equity | 1,046,193 | 1,081,797 | |||||||||
| Noncontrolling interests in subsidiaries | 277 | 281 | |||||||||
| Total equity | 1,046,470 | 1,082,078 | |||||||||
| Total liabilities and equity | $ | 1,810,204 | $ | 1,845,762 | |||||||
| The following tables contain reconciliations of net loss to NOI and same-store NOI for the periods presented (in thousands): | |||||||||||||||||||||||
| Three Months Ended June 30, | Six Months Ended June 30, | ||||||||||||||||||||||
| 2025 | 2024 | 2025 | 2024 | ||||||||||||||||||||
| Net loss | $ | (3,566) | $ | (3,471) | $ | (8,241) | $ | (7,118) | |||||||||||||||
| Adjustments: | |||||||||||||||||||||||
| Property management expense | 2,256 | 2,175 | 4,502 | 4,393 | |||||||||||||||||||
| General and administrative expense | 7,689 | 6,138 | 16,918 | 12,334 | |||||||||||||||||||
| Real estate depreciation and amortization | 23,560 | 23,895 | 46,799 | 48,838 | |||||||||||||||||||
| Interest expense | 9,498 | 9,384 | 18,958 | 18,878 | |||||||||||||||||||
| Other income | — | — | — | (1,410) | |||||||||||||||||||
| Total Net Operating Income (NOI) | $ | 39,437 | $ | 38,121 | $ | 78,936 | $ | 75,915 | |||||||||||||||
| Multifamily NOI: | |||||||||||||||||||||||
| Same-store Portfolio | $ | 36,483 | $ | 34,927 | $ | 72,944 | $ | 69,497 | |||||||||||||||
| Development | (61) | (57) | (124) | (114) | |||||||||||||||||||
| Total | 36,422 | 34,870 | 72,820 | 69,383 | |||||||||||||||||||
| Other NOI (Watergate 600) | 3,015 | 3,251 | 6,116 | 6,532 | |||||||||||||||||||
| Total NOI | $ | 39,437 | $ | 38,121 | $ | 78,936 | $ | 75,915 | |||||||||||||||
| The following table contains a reconciliation of net loss to core funds from operations for the periods presented (in thousands, except per share data): | |||||||||||||||||||||||||||||
| Three Months Ended June 30, | Six Months Ended June 30, | ||||||||||||||||||||||||||||
| 2025 | 2024 | 2025 | 2024 | ||||||||||||||||||||||||||
| Net loss | $ | (3,566) | $ | (3,471) | $ | (8,241) | $ | (7,118) | |||||||||||||||||||||
| Add: | |||||||||||||||||||||||||||||
| Real estate depreciation and amortization | 23,560 | 23,895 | 46,799 | 48,838 | |||||||||||||||||||||||||
| NAREIT funds from operations | 19,994 | 20,424 | 38,558 | 41,720 | |||||||||||||||||||||||||
| Add/(deduct): | |||||||||||||||||||||||||||||
Other non-operating expenses(1) | 1,503 | 60 | 4,544 | 60 | |||||||||||||||||||||||||
| Severance expense | — | 64 | — | 64 | |||||||||||||||||||||||||
| Gain on land easements | — | — | — | (1,410) | |||||||||||||||||||||||||
| Core funds from operations | $ | 21,497 | $ | 20,548 | $ | 43,102 | $ | 40,434 | |||||||||||||||||||||
| Three Months Ended June 30, | Six Months Ended June 30, | ||||||||||||||||||||||||||||
| Per share data: | 2025 | 2024 | 2025 | 2024 | |||||||||||||||||||||||||
| NAREIT FFO | (Basic) | $ | 0.23 | $ | 0.23 | $ | 0.44 | $ | 0.47 | ||||||||||||||||||||
| (Diluted) | $ | 0.23 | $ | 0.23 | $ | 0.43 | $ | 0.47 | |||||||||||||||||||||
| Core FFO | (Basic) | $ | 0.24 | $ | 0.23 | $ | 0.49 | $ | 0.46 | ||||||||||||||||||||
| (Diluted) | $ | 0.24 | $ | 0.23 | $ | 0.49 | $ | 0.46 | |||||||||||||||||||||
| Weighted average shares outstanding - basic | 88,093 | 87,910 | 88,078 | 87,898 | |||||||||||||||||||||||||
| Weighted average shares outstanding - diluted (for NAREIT and Core FFO) | 88,414 | 87,975 | 88,436 | 87,936 | |||||||||||||||||||||||||
| Adjusted Earnings Before Interest, Taxes, Depreciation and Amortization (EBITDA) (in thousands): | |||||||||||||||||||||||
| Three Months Ended June 30, | Six Months Ended June 30, | ||||||||||||||||||||||
| 2025 | 2024 | 2025 | 2024 | ||||||||||||||||||||
| Net loss | $ | (3,566) | $ | (3,471) | $ | (8,241) | $ | (7,118) | |||||||||||||||
| Add/(deduct): | |||||||||||||||||||||||
| Interest expense | 9,498 | 9,384 | 18,958 | 18,878 | |||||||||||||||||||
| Real estate depreciation and amortization | 23,560 | 23,895 | 46,799 | 48,838 | |||||||||||||||||||
| Non-real estate depreciation | 198 | 197 | 397 | 308 | |||||||||||||||||||
| Severance expense | — | 64 | — | 64 | |||||||||||||||||||
Other non-operating expenses(1) | 1,503 | 60 | 4,544 | 60 | |||||||||||||||||||
| Gain on land easements | — | — | — | (1,410) | |||||||||||||||||||
| Adjusted EBITDA | $ | 31,193 | $ | 30,129 | $ | 62,457 | $ | 59,620 | |||||||||||||||
| Non-GAAP Financial Measures | ||||||||||||||
| Other Definitions | ||||||||||||||
| Table of Contents |  | ||||
June 30, 2025 | |||||
| Schedule | Page | |||||||
| Key Financial Data | ||||||||
| Portfolio Analysis | ||||||||
Net Operating Income (NOI) - Multifamily | ||||||||
Same-Store Operating Results - Multifamily | ||||||||
Same-Store Operating Expenses - Multifamily | ||||||||
| Growth and Strategy | ||||||||
| Schedule of Communities | ||||||||
| Capital Analysis | ||||||||
Debt Covenant Compliance | ||||||||
| Reconciliations | ||||||||
Consolidated Statements of Operations (In thousands, except per share data) (Unaudited) | | ||||
| Six Months Ended | Three Months Ended | |||||||||||||||||||||||||||||||||||||||||||
| OPERATING RESULTS | June 30, 2025 | June 30, 2024 | June 30, 2025 | March 31, 2025 | December 31, 2024 | September 30, 2024 | June 30, 2024 | |||||||||||||||||||||||||||||||||||||
| Revenues | ||||||||||||||||||||||||||||||||||||||||||||
| Real estate rental revenue | $ | 123,592 | $ | 119,616 | $ | 62,099 | $ | 61,493 | $ | 61,264 | $ | 61,055 | $ | 60,103 | ||||||||||||||||||||||||||||||
| Expenses | ||||||||||||||||||||||||||||||||||||||||||||
| Property operating and maintenance | (28,799) | (27,460) | (14,624) | (14,175) | (14,727) | (14,095) | (13,996) | |||||||||||||||||||||||||||||||||||||
| Real estate taxes and insurance | (15,857) | (16,241) | (8,038) | (7,819) | (8,015) | (8,163) | (7,986) | |||||||||||||||||||||||||||||||||||||
| Property management | (4,502) | (4,393) | (2,256) | (2,246) | (2,233) | (2,235) | (2,175) | |||||||||||||||||||||||||||||||||||||
| General and administrative | (16,918) | (12,334) | (7,689) | (9,229) | (6,281) | (6,354) | (6,138) | |||||||||||||||||||||||||||||||||||||
| Depreciation and amortization | (46,799) | (48,838) | (23,560) | (23,239) | (23,623) | (23,474) | (23,895) | |||||||||||||||||||||||||||||||||||||
| (112,875) | (109,266) | (56,167) | (56,708) | (54,879) | (54,321) | (54,190) | ||||||||||||||||||||||||||||||||||||||
| Real estate operating income | 10,717 | 10,350 | 5,932 | 4,785 | 6,385 | 6,734 | 5,913 | |||||||||||||||||||||||||||||||||||||
| Other (expense) income | ||||||||||||||||||||||||||||||||||||||||||||
| Interest expense | (18,958) | (18,878) | (9,498) | (9,460) | (9,400) | (9,557) | (9,384) | |||||||||||||||||||||||||||||||||||||
| Loss on extinguishment of debt | — | — | — | — | — | (147) | — | |||||||||||||||||||||||||||||||||||||
| Other income | — | 1,410 | — | — | — | — | — | |||||||||||||||||||||||||||||||||||||
| Net loss | $ | (8,241) | $ | (7,118) | $ | (3,566) | $ | (4,675) | $ | (3,015) | $ | (2,970) | $ | (3,471) | ||||||||||||||||||||||||||||||
| Per Share Data: | ||||||||||||||||||||||||||||||||||||||||||||
| Net loss | $ | (0.10) | $ | (0.08) | $ | (0.04) | $ | (0.05) | $ | (0.03) | $ | (0.03) | $ | (0.04) | ||||||||||||||||||||||||||||||
| Fully diluted weighted average shares outstanding | 88,078 | 87,898 | 88,093 | 88,064 | 87,955 | 87,930 | 87,910 | |||||||||||||||||||||||||||||||||||||
| Percentage of Revenues: | ||||||||||||||||||||||||||||||||||||||||||||
| General and administrative expenses | 13.7 | % | 10.3 | % | 12.4 | % | 15.0 | % | 10.3 | % | 10.4 | % | 10.2 | % | ||||||||||||||||||||||||||||||
| Net loss | (6.7) | % | (6.0) | % | (5.7) | % | (7.6) | % | (4.9) | % | (4.9) | % | (5.8) | % | ||||||||||||||||||||||||||||||
| Ratios: | ||||||||||||||||||||||||||||||||||||||||||||
Adjusted EBITDA(1) / Interest expense | 3.3 | x | 3.2 | x | 3.3 | x | 3.3 | x | 3.2 | x | 3.2 | x | 3.2 | x | ||||||||||||||||||||||||||||||
______________________________ | ||||||||||||||||||||||||||||||||||||||||||||
Consolidated Balance Sheets (In thousands, except per share data) (Unaudited) | | ||||
| June 30, 2025 | March 31, 2025 | December 31, 2024 | September 30, 2024 | June 30, 2024 | |||||||||||||||||||||||||
| Assets | |||||||||||||||||||||||||||||
| Land | $ | 383,808 | $ | 383,808 | $ | 383,808 | $ | 383,808 | $ | 383,808 | |||||||||||||||||||
| Income producing property | 2,013,831 | 2,004,162 | 1,999,525 | 1,986,596 | 1,976,127 | ||||||||||||||||||||||||
| 2,397,639 | 2,387,970 | 2,383,333 | 2,370,404 | 2,359,935 | |||||||||||||||||||||||||
| Accumulated depreciation and amortization | (662,209) | (640,061) | (618,299) | (595,533) | (573,054) | ||||||||||||||||||||||||
| Net income producing property | 1,735,430 | 1,747,909 | 1,765,034 | 1,774,871 | 1,786,881 | ||||||||||||||||||||||||
| Properties under development or held for future development | 30,980 | 30,980 | 30,980 | 30,980 | 30,980 | ||||||||||||||||||||||||
| Total real estate held for investment, net | 1,766,410 | 1,778,889 | 1,796,014 | 1,805,851 | 1,817,861 | ||||||||||||||||||||||||
| Cash and cash equivalents | 4,786 | 6,396 | 6,144 | 4,840 | 5,629 | ||||||||||||||||||||||||
| Restricted cash | 2,307 | 2,556 | 2,465 | 2,358 | 2,263 | ||||||||||||||||||||||||
| Rents and other receivables | 12,250 | 12,206 | 12,511 | 12,676 | 12,575 | ||||||||||||||||||||||||
| Prepaid expenses and other assets | 24,451 | 27,532 | 28,628 | 27,434 | 23,147 | ||||||||||||||||||||||||
| Total assets | $ | 1,810,204 | $ | 1,827,579 | $ | 1,845,762 | $ | 1,853,159 | $ | 1,861,475 | |||||||||||||||||||
| Liabilities | |||||||||||||||||||||||||||||
| Notes payable, net | $ | 523,196 | $ | 523,061 | $ | 522,953 | $ | 522,914 | $ | 522,734 | |||||||||||||||||||
| Line of credit | 175,000 | 182,000 | 176,000 | 168,000 | 156,000 | ||||||||||||||||||||||||
| Accounts payable and other liabilities | 38,230 | 31,082 | 36,293 | 36,295 | 37,283 | ||||||||||||||||||||||||
| Dividend payable | 15,947 | 15,943 | 15,898 | 15,906 | 15,905 | ||||||||||||||||||||||||
| Advance rents | 5,079 | 6,010 | 6,257 | 4,801 | 5,074 | ||||||||||||||||||||||||
| Tenant security deposits | 6,282 | 6,282 | 6,283 | 6,270 | 6,334 | ||||||||||||||||||||||||
| Total liabilities | 763,734 | 764,378 | 763,684 | 754,186 | 743,330 | ||||||||||||||||||||||||
| Equity | |||||||||||||||||||||||||||||
Preferred shares, $0.01 par value; 10,000 shares authorized | — | — | — | — | — | ||||||||||||||||||||||||
| Shares of beneficial interest, $0.01 par value; 150,000 shares authorized | 882 | 882 | 880 | 880 | 880 | ||||||||||||||||||||||||
| Additional paid-in capital | 1,743,161 | 1,741,220 | 1,740,078 | 1,739,319 | 1,737,941 | ||||||||||||||||||||||||
| Distributions in excess of net income | (686,226) | (666,713) | (646,095) | (627,186) | (608,310) | ||||||||||||||||||||||||
| Accumulated other comprehensive loss | (11,624) | (12,467) | (13,066) | (14,323) | (12,651) | ||||||||||||||||||||||||
| Total shareholders' equity | 1,046,193 | 1,062,922 | 1,081,797 | 1,098,690 | 1,117,860 | ||||||||||||||||||||||||
| Noncontrolling interests in subsidiaries | 277 | 279 | 281 | 283 | 285 | ||||||||||||||||||||||||
| Total equity | 1,046,470 | 1,063,201 | 1,082,078 | 1,098,973 | 1,118,145 | ||||||||||||||||||||||||
| Total liabilities and equity | $ | 1,810,204 | $ | 1,827,579 | $ | 1,845,762 | $ | 1,853,159 | $ | 1,861,475 | |||||||||||||||||||
NAREIT Funds from Operations/ Adjusted Funds From Operations (In thousands, except per share data) (Unaudited) | | ||||
| Six Months Ended | Three Months Ended | |||||||||||||||||||||||||||||||||||||||||||
| June 30, 2025 | June 30, 2024 | June 30, 2025 | March 31, 2025 | December 31, 2024 | September 30, 2024 | June 30, 2024 | ||||||||||||||||||||||||||||||||||||||
| Funds from operations (FFO) | ||||||||||||||||||||||||||||||||||||||||||||
| Net loss | $ | (8,241) | $ | (7,118) | $ | (3,566) | $ | (4,675) | $ | (3,015) | $ | (2,970) | $ | (3,471) | ||||||||||||||||||||||||||||||
| Real estate depreciation and amortization | 46,799 | 48,838 | 23,560 | 23,239 | 23,623 | 23,474 | 23,895 | |||||||||||||||||||||||||||||||||||||
NAREIT funds from operations (FFO)(1) | 38,558 | 41,720 | 19,994 | 18,564 | 20,608 | 20,504 | 20,424 | |||||||||||||||||||||||||||||||||||||
| Loss on extinguishment of debt | — | — | — | — | — | 147 | — | |||||||||||||||||||||||||||||||||||||
| Severance expense | — | 64 | — | — | — | 13 | 64 | |||||||||||||||||||||||||||||||||||||
Other non-operating expenses(2) | 4,544 | 60 | 1,503 | 3,041 | 128 | — | 60 | |||||||||||||||||||||||||||||||||||||
| Gain on land easements | — | (1,410) | — | — | — | — | — | |||||||||||||||||||||||||||||||||||||
Core FFO(1) | $ | 43,102 | $ | 40,434 | $ | 21,497 | $ | 21,605 | $ | 20,736 | $ | 20,664 | $ | 20,548 | ||||||||||||||||||||||||||||||
Allocation to participating securities(3) | (177) | (158) | (88) | (89) | (50) | (78) | (79) | |||||||||||||||||||||||||||||||||||||
| NAREIT FFO per share - basic | $ | 0.44 | $ | 0.47 | $ | 0.23 | $ | 0.21 | $ | 0.23 | $ | 0.23 | $ | 0.23 | ||||||||||||||||||||||||||||||
| NAREIT FFO per share - fully diluted | $ | 0.43 | $ | 0.47 | $ | 0.23 | $ | 0.21 | $ | 0.23 | $ | 0.23 | $ | 0.23 | ||||||||||||||||||||||||||||||
| Core FFO per share - fully diluted | $ | 0.49 | $ | 0.46 | $ | 0.24 | $ | 0.24 | $ | 0.24 | $ | 0.23 | $ | 0.23 | ||||||||||||||||||||||||||||||
| Common dividend per share | $ | 0.36 | $ | 0.36 | $ | 0.18 | $ | 0.18 | $ | 0.18 | $ | 0.18 | $ | 0.18 | ||||||||||||||||||||||||||||||
| Average shares - basic | 88,078 | 87,898 | 88,093 | 88,064 | 87,955 | 87,930 | 87,910 | |||||||||||||||||||||||||||||||||||||
| Average shares - fully diluted (for NAREIT FFO and Core FFO) | 88,436 | 87,936 | 88,414 | 88,457 | 88,001 | 87,994 | 87,975 | |||||||||||||||||||||||||||||||||||||
NAREIT Funds from Operations/ Adjusted Funds From Operations (continued) (In thousands, except per share data) (Unaudited) | | ||||
| Six Months Ended | Three Months Ended | |||||||||||||||||||||||||||||||||||||||||||
| June 30, 2025 | June 30, 2024 | June 30, 2025 | March 31, 2025 | December 31, 2024 | September 30, 2024 | June 30, 2024 | ||||||||||||||||||||||||||||||||||||||
Adjusted funds from operations (AFFO)(1) | ||||||||||||||||||||||||||||||||||||||||||||
NAREIT FFO(1) | $ | 38,558 | $ | 41,720 | $ | 19,994 | $ | 18,564 | $ | 20,608 | $ | 20,504 | $ | 20,424 | ||||||||||||||||||||||||||||||
| Non-cash loss on extinguishment of debt | — | — | — | — | — | 147 | — | |||||||||||||||||||||||||||||||||||||
| Leasing commissions capitalized | (4) | — | (4) | — | (107) | (30) | — | |||||||||||||||||||||||||||||||||||||
| Recurring capital improvements | (6,120) | (4,915) | (3,203) | (2,917) | (3,143) | (2,284) | (2,144) | |||||||||||||||||||||||||||||||||||||
| Straight-line rent, net | 166 | 40 | 86 | 80 | 41 | 26 | 25 | |||||||||||||||||||||||||||||||||||||
| Non-real estate depreciation and amortization of debt costs | 2,540 | 2,429 | 1,269 | 1,271 | 1,303 | 1,326 | 1,259 | |||||||||||||||||||||||||||||||||||||
| Amortization of lease intangibles, net | (336) | (325) | (167) | (169) | (184) | (201) | (163) | |||||||||||||||||||||||||||||||||||||
| Amortization and expensing of restricted share and unit compensation | 3,113 | 2,135 | 1,740 | 1,373 | 1,504 | 1,578 | 1,045 | |||||||||||||||||||||||||||||||||||||
AFFO(1) | 37,917 | 41,084 | 19,715 | 18,202 | 20,022 | 21,066 | 20,446 | |||||||||||||||||||||||||||||||||||||
| Non-share-based severance expense | — | 64 | — | — | — | 13 | 64 | |||||||||||||||||||||||||||||||||||||
Other non-operating expenses(2) | 4,544 | 60 | 1,503 | 3,041 | 128 | — | 60 | |||||||||||||||||||||||||||||||||||||
| Gain on land easements | — | (1,410) | — | — | — | — | — | |||||||||||||||||||||||||||||||||||||
Core AFFO(1) | $ | 42,461 | $ | 39,798 | $ | 21,218 | $ | 21,243 | $ | 20,150 | $ | 21,079 | $ | 20,570 | ||||||||||||||||||||||||||||||
______________________________ | ||||||||||||||||||||||||||||||||||||||||||||
(1) See “Definitions” on page 10 for the definitions of non-GAAP measures: NAREIT FFO, Core FFO, AFFO, and Core AFFO. | ||||||||||||||||||||||||||||||||||||||||||||
(2) Other non-operating expenses during 2025 consist of advisory and legal services provided by third parties related to the previously disclosed cooperation agreement with Argosy-Lionbridge Management, LLC in Q1 2025 and our previously announced formal strategic alternatives review. | ||||||||||||||||||||||||||||||||||||||||||||
(3) Adjustment to the numerators for FFO and Core FFO per share calculations when applying the two-class method for calculating EPS. | ||||||||||||||||||||||||||||||||||||||||||||
Net Operating Income (NOI) - Multifamily (Dollars In thousands) | | ||||
| Apartment Homes as of June 30, 2025 | Six Months Ended | Three Months Ended | ||||||||||||||||||||||||||||||||||||||||||||||||
| June 30, 2025 | June 30, 2024 | June 30, 2025 | March 31, 2025 | December 31, 2024 | September 30, 2024 | June 30, 2024 | ||||||||||||||||||||||||||||||||||||||||||||
| Rental and other property revenues | ||||||||||||||||||||||||||||||||||||||||||||||||||
Same-store rental and other property operations (1) | 9,374 | $ | 114,690 | $ | 110,363 | $ | 57,683 | $ | 57,007 | $ | 56,848 | $ | 56,427 | $ | 55,492 | |||||||||||||||||||||||||||||||||||
| Property operating expenses | ||||||||||||||||||||||||||||||||||||||||||||||||||
| Same-store | 41,746 | 40,866 | 21,200 | 20,546 | 21,208 | 20,759 | 20,565 | |||||||||||||||||||||||||||||||||||||||||||
| Development | 124 | 114 | 61 | 63 | 58 | 61 | 57 | |||||||||||||||||||||||||||||||||||||||||||
| Total property operating expenses | $ | 41,870 | $ | 40,980 | $ | 21,261 | $ | 20,609 | $ | 21,266 | $ | 20,820 | $ | 20,622 | ||||||||||||||||||||||||||||||||||||
Net Operating Income (NOI)(2) | ||||||||||||||||||||||||||||||||||||||||||||||||||
| Same-store | 72,944 | 69,497 | 36,483 | 36,461 | 35,640 | 35,668 | 34,927 | |||||||||||||||||||||||||||||||||||||||||||
| Development | (124) | (114) | (61) | (63) | (58) | (61) | (57) | |||||||||||||||||||||||||||||||||||||||||||
| Total NOI | $ | 72,820 | $ | 69,383 | $ | 36,422 | $ | 36,398 | $ | 35,582 | $ | 35,607 | $ | 34,870 | ||||||||||||||||||||||||||||||||||||
| Same-store metrics | ||||||||||||||||||||||||||||||||||||||||||||||||||
Operating margin(3) | 64% | 63% | 63% | 64% | 63% | 63% | 63% | |||||||||||||||||||||||||||||||||||||||||||
| Retention | 62% | 65% | 62% | 62% | 69% | 66% | 65% | |||||||||||||||||||||||||||||||||||||||||||
| Same-store effective lease rate growth | ||||||||||||||||||||||||||||||||||||||||||||||||||
| New | (2.8)% | (1.3)% | (3.3)% | (2.0)% | (3.9)% | (2.2)% | (0.1)% | |||||||||||||||||||||||||||||||||||||||||||
| Renewal | 5.0% | 5.7% | 4.9% | 5.0% | 4.9% | 4.4% | 5.4% | |||||||||||||||||||||||||||||||||||||||||||
| Blended | 1.5% | 2.7% | 1.3% | 1.9% | 1.0% | 1.8% | 3.1% | |||||||||||||||||||||||||||||||||||||||||||
______________________________ | ||||||||||||||||||||||||||||||||||||||||||||||||||
(1) Utility costs reimbursed by residents are included in real estate rental revenue on our consolidated statements of operations. Utility reimbursements totaled $4.7 million and $4.5 million for the six months ended June 30, 2025 and 2024 respectively, and $2.3 million, $2.4 million, $2.4 million, $2.3 million and $2.1 million for the three months ended June 30, 2025, March 31, 2025, December 31, 2024, September 30, 2024 and June 30, 2024, respectively. | ||||||||||||||||||||||||||||||||||||||||||||||||||
(3) Operating margin is calculated by dividing the same-store NOI (non-GAAP) by same-store rental and other property revenues. | ||||||||||||||||||||||||||||||||||||||||||||||||||
Same-Store Operating Results - Multifamily (Dollars in thousands, except Average Effective Monthly Rent per Home) | | ||||
| Rental and Other Property Revenue | Property Operating Expenses | Net Operating Income (1) | Average Occupancy | Average Effective Monthly Rent per Home | ||||||||||||||||||||||||||||||||||||||||||||||||||||||||||||||||||||||||||||||||||||||||||||||
| Quarter-to-Date Comparison | Apt Homes | Q2 2025 | Q2 2024 | % Chg | Q2 2025 | Q2 2024 | % Chg | Q2 2025 | Q2 2024 | % Chg | Q2 2025 | Q2 2024 | % Chg | Q2 2025 | Q2 2024 | % Chg | ||||||||||||||||||||||||||||||||||||||||||||||||||||||||||||||||||||||||||||||||||
| Virginia | 5,550 | $ | 37,794 | $ | 36,074 | 4.8 | % | $ | 12,381 | $ | 12,221 | 1.3 | % | $ | 25,413 | $ | 23,853 | 6.5 | % | 96.4 | % | 96.3 | % | 0.1 | % | $ | 2,077 | $ | 2,006 | 3.5 | % | |||||||||||||||||||||||||||||||||||||||||||||||||||||||||||||||||||
| DC / Maryland | 1,515 | 9,247 | 9,139 | 1.2 | % | 3,480 | 3,359 | 3.6 | % | 5,767 | 5,780 | (0.2) | % | 94.9 | % | 95.2 | % | (0.3) | % | 1,995 | 1,974 | 1.1 | % | |||||||||||||||||||||||||||||||||||||||||||||||||||||||||||||||||||||||||||
| Georgia | 2,309 | 10,642 | 10,279 | 3.5 | % | 5,339 | 4,985 | 7.1 | % | 5,303 | 5,294 | 0.2 | % | 90.2 | % | 89.6 | % | 0.6 | % | 1,466 | 1,544 | (5.1) | % | |||||||||||||||||||||||||||||||||||||||||||||||||||||||||||||||||||||||||||
| Total | 9,374 | $ | 57,683 | $ | 55,492 | 3.9 | % | $ | 21,200 | $ | 20,565 | 3.1 | % | $ | 36,483 | $ | 34,927 | 4.5 | % | 94.7 | % | 94.5 | % | 0.2 | % | $ | 1,913 | $ | 1,887 | 1.4 | % | |||||||||||||||||||||||||||||||||||||||||||||||||||||||||||||||||||
| Sequential Comparison | Apt Homes | Q2 2025 | Q1 2025 | % Chg | Q2 2025 | Q1 2025 | % Chg | Q2 2025 | Q1 2025 | % Chg | Q2 2025 | Q1 2025 | % Chg | Q2 2025 | Q1 2025 | % Chg | ||||||||||||||||||||||||||||||||||||||||||||||||||||||||||||||||||||||||||||||||||
| Virginia | 5,550 | $ | 37,794 | $ | 37,144 | 1.7 | % | $ | 12,381 | $ | 12,176 | 1.7 | % | $ | 25,413 | $ | 24,968 | 1.8 | % | 96.4 | % | 96.5 | % | (0.1) | % | $ | 2,077 | $ | 2,059 | 0.9 | % | |||||||||||||||||||||||||||||||||||||||||||||||||||||||||||||||||||
| DC / Maryland | 1,515 | 9,247 | 9,299 | (0.6) | % | 3,480 | 3,376 | 3.1 | % | 5,767 | 5,923 | (2.6) | % | 94.9 | % | 94.9 | % | — | % | 1,995 | 1,992 | 0.2 | % | |||||||||||||||||||||||||||||||||||||||||||||||||||||||||||||||||||||||||||
| Georgia | 2,309 | 10,642 | 10,564 | 0.7 | % | 5,339 | 4,994 | 6.9 | % | 5,303 | 5,570 | (4.8) | % | 90.2 | % | 90.6 | % | (0.4) | % | 1,466 | 1,489 | (1.5) | % | |||||||||||||||||||||||||||||||||||||||||||||||||||||||||||||||||||||||||||
| Total | 9,374 | $ | 57,683 | $ | 57,007 | 1.2 | % | $ | 21,200 | $ | 20,546 | 3.2 | % | $ | 36,483 | $ | 36,461 | 0.1 | % | 94.7 | % | 94.8 | % | (0.1) | % | $ | 1,913 | $ | 1,908 | 0.3 | % | |||||||||||||||||||||||||||||||||||||||||||||||||||||||||||||||||||
| Year-to-Date Comparison | Apt Homes | YTD 2025 | YTD 2024 | % Chg | YTD 2025 | YTD 2024 | % Chg | YTD 2025 | YTD 2024 | % Chg | YTD 2025 | YTD 2024 | % Chg | YTD 2025 | YTD 2024 | % Chg | ||||||||||||||||||||||||||||||||||||||||||||||||||||||||||||||||||||||||||||||||||
| Virginia | 5,550 | $ | 74,938 | $ | 71,630 | 4.6 | % | $ | 24,557 | $ | 24,343 | 0.9 | % | $ | 50,381 | $ | 47,287 | 6.5 | % | 96.5 | % | 96.2 | % | 0.3 | % | $ | 2,068 | $ | 1,998 | 3.5 | % | |||||||||||||||||||||||||||||||||||||||||||||||||||||||||||||||||||
| DC / Maryland | 1,515 | 18,546 | 18,255 | 1.6 | % | 6,856 | 6,663 | 2.9 | % | 11,690 | 11,592 | 0.8 | % | 94.9 | % | 95.0 | % | (0.1) | % | 1,993 | 1,964 | 1.5 | % | |||||||||||||||||||||||||||||||||||||||||||||||||||||||||||||||||||||||||||
| Georgia | 2,309 | 21,206 | 20,478 | 3.6 | % | 10,333 | 9,860 | 4.8 | % | 10,873 | 10,618 | 2.4 | % | 90.4 | % | 89.5 | % | 0.9 | % | 1,477 | 1,550 | (4.7) | % | |||||||||||||||||||||||||||||||||||||||||||||||||||||||||||||||||||||||||||
| Total | 9,374 | $ | 114,690 | $ | 110,363 | 3.9 | % | $ | 41,746 | $ | 40,866 | 2.2 | % | $ | 72,944 | $ | 69,497 | 5.0 | % | 94.7 | % | 94.4 | % | 0.3 | % | $ | 1,910 | $ | 1,882 | 1.5 | % | |||||||||||||||||||||||||||||||||||||||||||||||||||||||||||||||||||
______________________________ | ||||||||||||||||||||||||||||||||||||||||||||||||||||||||||||||||||||||||||||||||||||||||||||||||||
Same-Store Operating Expenses - Multifamily (In thousands) | | ||||
| Quarter-to-Date Comparison | Q2 2025 | Q2 2024 | $ Change | % Change | % of Q2 2025 Total | ||||||||||||||||||||||||
Controllable operating expenses(1) | $ | 10,610 | $ | 10,212 | $ | 398 | 3.9 | % | 50.0 | % | |||||||||||||||||||
| Real estate taxes | 6,099 | 6,060 | 39 | 0.6 | % | 28.8 | % | ||||||||||||||||||||||
| Utilities | 3,255 | 3,102 | 153 | 4.9 | % | 15.4 | % | ||||||||||||||||||||||
| Insurance | 1,236 | 1,191 | 45 | 3.8 | % | 5.8 | % | ||||||||||||||||||||||
| Total same-store operating expenses | 21,200 | 20,565 | 635 | 3.1 | % | 100.0 | % | ||||||||||||||||||||||
| Utility reimbursements | (2,322) | (2,117) | (205) | 9.7 | % | ||||||||||||||||||||||||
| Total same-store operating expenses, net of utility reimbursements | $ | 18,878 | $ | 18,448 | $ | 430 | 2.3 | % | |||||||||||||||||||||
| Sequential Comparison | Q2 2025 | Q1 2025 | $ Change | % Change | % of Q2 2025 Total | ||||||||||||||||||||||||
Controllable operating expenses(1) | $ | 10,610 | $ | 9,685 | $ | 925 | 9.6 | % | 50.0 | % | |||||||||||||||||||
| Real estate taxes | 6,099 | 5,878 | 221 | 3.8 | % | 28.8 | % | ||||||||||||||||||||||
| Utilities | 3,255 | 3,747 | (492) | (13.1) | % | 15.4 | % | ||||||||||||||||||||||
| Insurance | 1,236 | 1,236 | — | — | % | 5.8 | % | ||||||||||||||||||||||
| Total same-store operating expenses | 21,200 | 20,546 | 654 | 3.2 | % | 100.0 | % | ||||||||||||||||||||||
| Utility reimbursements | (2,322) | (2,368) | 46 | (1.9) | % | ||||||||||||||||||||||||
| Total same-store operating expenses, net of utility reimbursements | $ | 18,878 | $ | 18,178 | $ | 700 | 3.9 | % | |||||||||||||||||||||
| Year-to-Date Comparison | YTD 2025 | YTD 2024 | $ Change | % Change | % of YTD 2025 Total | ||||||||||||||||||||||||
Controllable operating expenses(1) | $ | 20,295 | $ | 19,396 | $ | 899 | 4.6 | % | 48.6 | % | |||||||||||||||||||
| Real estate taxes | 11,977 | 12,404 | (427) | (3.4) | % | 28.7 | % | ||||||||||||||||||||||
| Utilities | 7,002 | 6,683 | 319 | 4.8 | % | 16.8 | % | ||||||||||||||||||||||
| Insurance | 2,472 | 2,383 | 89 | 3.7 | % | 5.9 | % | ||||||||||||||||||||||
| Total same-store operating expenses | 41,746 | 40,866 | 880 | 2.2 | % | 100.0 | % | ||||||||||||||||||||||
| Utility reimbursements | (4,690) | (4,489) | (201) | 4.5 | % | ||||||||||||||||||||||||
| Total same-store operating expenses, net of utility reimbursements | $ | 37,056 | $ | 36,377 | $ | 679 | 1.9 | % | |||||||||||||||||||||
______________________________ | ||
(1) Controllable operating expenses consist of: | ||
| Payroll, Repairs & Maintenance, Marketing, Administrative and other | ||
| Multifamily Communities | | ||||
| June 30, 2025 | |||||
| Community | Location | Apartment Homes | Current Strategy | Year Acquired | Year Built | Average Occupancy(1) | Ending Occupancy | % of Total Portfolio NOI(1,2) | |||||||||||||||||||||
| Virginia | |||||||||||||||||||||||||||||
| Cascade at Landmark | Alexandria, VA | 277 | B Value-Add | 2019 | 1988 | 95.2% | 96.0% | 3% | |||||||||||||||||||||
| Clayborne | Alexandria, VA | 74 | A- | N/A | 2008 | 94.2% | 97.3% | 1% | |||||||||||||||||||||
| Elme Alexandria | Alexandria, VA | 532 | B Value-Add | 2019 | 1990 | 96.5% | 96.1% | 5% | |||||||||||||||||||||
| Riverside Apartments | Alexandria, VA | 1222 | B Value-Add | 2016 | 1971 | 96.1% | 96.6% | 12% | |||||||||||||||||||||
| Bennett Park | Arlington, VA | 224 | A- | N/A | 2007 | 95.7% | 96.0% | 4% | |||||||||||||||||||||
| Park Adams | Arlington, VA | 200 | B Value-Add | 1969 | 1959 | 96.0% | 95.5% | 2% | |||||||||||||||||||||
| The Maxwell | Arlington, VA | 163 | A- | N/A | 2014 | 96.8% | 94.5% | 2% | |||||||||||||||||||||
| The Paramount | Arlington, VA | 135 | B | 2013 | 1984 | 96.9% | 95.6% | 2% | |||||||||||||||||||||
| The Wellington | Arlington, VA | 710 | B Value-Add | 2015 | 1960 | 96.8% | 95.9% | 8% | |||||||||||||||||||||
| Trove | Arlington, VA | 401 | A | N/A | 2020 | 95.7% | 96.5% | 5% | |||||||||||||||||||||
| Roosevelt Towers | Falls Church, VA | 191 | B Value-Add | 1965 | 1964 | 96.6% | 99.5% | 2% | |||||||||||||||||||||
| Elme Dulles | Herndon, VA | 328 | B Value-Add | 2019 | 2000 | 97.5% | 98.2% | 4% | |||||||||||||||||||||
| Elme Herndon | Herndon, VA | 283 | B Value-Add | 2019 | 1991 | 97.3% | 96.5% | 3% | |||||||||||||||||||||
| Elme Leesburg | Leesburg, VA | 134 | B Value-Add | 2019 | 1986 | 97.7% | 97.8% | 2% | |||||||||||||||||||||
| Elme Manassas | Manassas, VA | 408 | B Value-Add | 2019 | 1986 | 96.2% | 95.3% | 4% | |||||||||||||||||||||
| The Ashby at McLean | McLean, VA | 268 | B Value-Add | 1996 | 1982 | 98.6% | 97.4% | 4% | |||||||||||||||||||||
| Washington, DC | |||||||||||||||||||||||||||||
| 3801 Connecticut Avenue | Washington, DC | 307 | B Value-Add | 1963 | 1951 | 94.4% | 96.4% | 3% | |||||||||||||||||||||
| Kenmore Apartments | Washington, DC | 371 | B Value-Add | 2008 | 1948 | 93.4% | 91.9% | 3% | |||||||||||||||||||||
| Yale West | Washington, DC | 216 | A- | 2014 | 2011 | 94.3% | 94.0% | 3% | |||||||||||||||||||||
| Maryland | |||||||||||||||||||||||||||||
| Elme Bethesda | Bethesda, MD | 193 | B | 1997 | 1986 | 95.9% | 94.3% | 2% | |||||||||||||||||||||
| Elme Watkins Mill | Gaithersburg, MD | 210 | B | 2019 | 1975 | 95.9% | 96.7% | 2% | |||||||||||||||||||||
| Elme Germantown | Germantown, MD | 218 | B Value-Add | 2019 | 1990 | 96.8% | 98.2% | 2% | |||||||||||||||||||||
| Georgia | |||||||||||||||||||||||||||||
| Elme Druid Hills | Atlanta, GA | 500 | B Value-Add | 2023 | 1987 | 93.9% | 93.0% | 4% | |||||||||||||||||||||
| Elme Conyers | Conyers, GA | 240 | B | 2021 | 1999 | 90.4% | 92.1% | 1% | |||||||||||||||||||||
| Multifamily Communities (continued) | | ||||
| June 30, 2025 | |||||
| Community | Location | Apartment Homes | Current Strategy | Year Acquired | Year Built | Average Occupancy(1) | Ending Occupancy | % of Total Portfolio NOI(1,2) | |||||||||||||||||||||
Georgia | |||||||||||||||||||||||||||||
Elme Marietta (3) | Marietta, GA | 420 | B Value-Add | 2022 | 1975 | 88.4% | 90.5% | 2% | |||||||||||||||||||||
| Elme Sandy Springs | Sandy Springs, GA | 389 | B Value-Add | 2022 | 1972 | 89.0% | 90.0% | 3% | |||||||||||||||||||||
| Elme Cumberland | Smyrna, GA | 270 | B Value-Add | 2022 | 1982 | 92.8% | 95.6% | 2% | |||||||||||||||||||||
| Elme Eagles Landing | Stockbridge, GA | 490 | B Value-Add | 2021 | 2000 | 88.3% | 90.4% | 2% | |||||||||||||||||||||
| Total multifamily communities | 9,374 | 94.7% | 95.0% | 92% | |||||||||||||||||||||||||
______________________________ | |||||||||||||||||||||||||||||
(1) For the six months ended June 30, 2025. | |||||||||||||||||||||||||||||
(3) Metrics for Elme Marietta are not adjusted for 24 down units that are currently unavailable for use due to a fire that occurred within the community on March 24, 2024. We currently anticipate these units will be placed back in service by the end of the fourth quarter of 2025. Concurrently, we are engaged with our insurance provider to determine potential insurance proceeds and coverage under our business interruption insurance. | |||||||||||||||||||||||||||||
| Office Property | | ||||
| June 30, 2025 | |||||
| Property | Location | Year Acquired | Year Built | Net Rentable Square Feet | Leased %(1) | Ending Occupancy(1) | % of Total Portfolio NOI(2,3) | |||||||||||||||||||||||||||||||||||||
| Washington, DC | ||||||||||||||||||||||||||||||||||||||||||||
| Watergate 600 | Washington, DC | 2017 | 1972/1997 | 300,000 | 82.3% | 82.3% | 8% | |||||||||||||||||||||||||||||||||||||
______________________________ | ||||||||||||||||||||||||||||||||||||||||||||
(1) The leased and occupied square footage includes short-term lease agreements. | ||||||||||||||||||||||||||||||||||||||||||||
(2) For the six months ended June 30, 2025. | ||||||||||||||||||||||||||||||||||||||||||||
Adjusted Earnings Before Interest, Taxes, Depreciation and Amortization (EBITDA) (In thousands) (Unaudited) | | ||||
| Six Months Ended | Three Months Ended | |||||||||||||||||||||||||||||||||||||||||||
| June 30, 2025 | June 30, 2024 | June 30, 2025 | March 31, 2025 | December 31, 2024 | September 30, 2024 | June 30, 2024 | ||||||||||||||||||||||||||||||||||||||
Adjusted EBITDA(1) | ||||||||||||||||||||||||||||||||||||||||||||
| Net loss | $ | (8,241) | $ | (7,118) | $ | (3,566) | $ | (4,675) | $ | (3,015) | $ | (2,970) | $ | (3,471) | ||||||||||||||||||||||||||||||
| Add/(deduct): | ||||||||||||||||||||||||||||||||||||||||||||
| Interest expense | 18,958 | 18,878 | 9,498 | 9,460 | 9,400 | 9,557 | 9,384 | |||||||||||||||||||||||||||||||||||||
| Real estate depreciation and amortization | 46,799 | 48,838 | 23,560 | 23,239 | 23,623 | 23,474 | 23,895 | |||||||||||||||||||||||||||||||||||||
| Non-real estate depreciation | 397 | 308 | 198 | 199 | 168 | 160 | 197 | |||||||||||||||||||||||||||||||||||||
| Severance expense | — | 64 | — | — | — | 13 | 64 | |||||||||||||||||||||||||||||||||||||
Other non-operating expenses(2) | 4,544 | 60 | 1,503 | 3,041 | 128 | — | 60 | |||||||||||||||||||||||||||||||||||||
| Loss on extinguishment of debt | — | — | — | — | — | 147 | — | |||||||||||||||||||||||||||||||||||||
| Gain on land easements | — | (1,410) | — | — | — | — | — | |||||||||||||||||||||||||||||||||||||
| Adjusted EBITDA | $ | 62,457 | $ | 59,620 | $ | 31,193 | $ | 31,264 | $ | 30,304 | $ | 30,381 | $ | 30,129 | ||||||||||||||||||||||||||||||
______________________________ | ||||||||||||||||||||||||||||||||||||||||||||
(1) Adjusted EBITDA is a non-GAAP measure. See “Definitions” on page 10 for the definition of Adjusted EBITDA and reconciliation of Net loss to Adjusted EBITDA on the current page. | ||||||||||||||||||||||||||||||||||||||||||||
(2) Other non-operating expenses during 2025 consist of advisory and legal services provided by third parties related to the previously disclosed cooperation agreement with Argosy-Lionbridge Management, LLC in Q1 2025 and our previously announced formal strategic alternatives review. | ||||||||||||||||||||||||||||||||||||||||||||
Long Term Debt Analysis (Dollars in thousands) | | ||||
| June 30, 2025 | March 31, 2025 | December 31, 2024 | September 30, 2024 | June 30, 2024 | |||||||||||||||||||||||||
| Balances Outstanding | |||||||||||||||||||||||||||||
| Unsecured | |||||||||||||||||||||||||||||
| Fixed rate bonds | $ | 398,301 | $ | 398,212 | $ | 398,123 | $ | 398,034 | $ | 397,945 | |||||||||||||||||||
Term loan(1) | 124,895 | 124,849 | 124,830 | 124,880 | 124,788 | ||||||||||||||||||||||||
| Credit facility | 175,000 | 182,000 | 176,000 | 168,000 | 156,000 | ||||||||||||||||||||||||
| Total | $ | 698,196 | $ | 705,061 | $ | 698,953 | $ | 690,914 | $ | 678,733 | |||||||||||||||||||
| Weighted Average Interest Rates | |||||||||||||||||||||||||||||
| Unsecured | |||||||||||||||||||||||||||||
| Fixed rate bonds | 4.5 | % | 4.5 | % | 4.5 | % | 4.5 | % | 4.5 | % | |||||||||||||||||||
Term loan(2) | 5.8 | % | 5.8 | % | 4.7 | % | 4.7 | % | 4.7 | % | |||||||||||||||||||
| Credit facility | 5.3 | % | 5.3 | % | 5.3 | % | 5.8 | % | 6.3 | % | |||||||||||||||||||
| Weighted Average | 4.9 | % | 4.9 | % | 4.7 | % | 4.9 | % | 4.9 | % | |||||||||||||||||||
______________________________ | |||||||||||||||||||||||||||||
(1) In the first quarter of 2023, Elme Communities entered into a $125.0 million unsecured term loan (“2023 Term Loan”) with an interest rate of SOFR (subject to a credit spread adjustment of 10 basis points) plus a margin of 95 basis points (subject to adjustment depending on Elme Communities' credit rating). The original term of the 2023 Term Loan had a two-year term ending in January 2025, with two one-year extension options. In the fourth quarter of 2024, we exercised one of two one-year extension options to extend the maturity of the loan to January 10, 2026. | |||||||||||||||||||||||||||||
(2) In the first quarter of 2023, Elme Communities entered into two interest rate swap arrangements with an aggregate notional amount of $125.0 million that effectively fixed the interest at 4.73% for the 2023 Term Loan beginning on July 21, 2023 through the 2023 Term Loan’s initial maturity date of January 10, 2025. In the second quarter of 2024, we entered into two forward interest rate swap arrangements with an aggregate notional amount of $150.0 million beginning on January 10, 2025 through the loan maturity date of January 10, 2026. These forward interest rate swap arrangements effectively fix (i) a portion of our variable rate debt based on an adjusted daily SOFR at 4.72% (subject to applicable interest rate margins) and (ii) the 2023 Term Loan’s interest rate at 5.77% beginning on January 10, 2025 through the loan maturity date of January 10, 2026. | |||||||||||||||||||||||||||||
Note: The current debt balances outstanding are shown net of discounts, premiums and unamortized debt costs (see page 26). | |||||||||||||||||||||||||||||
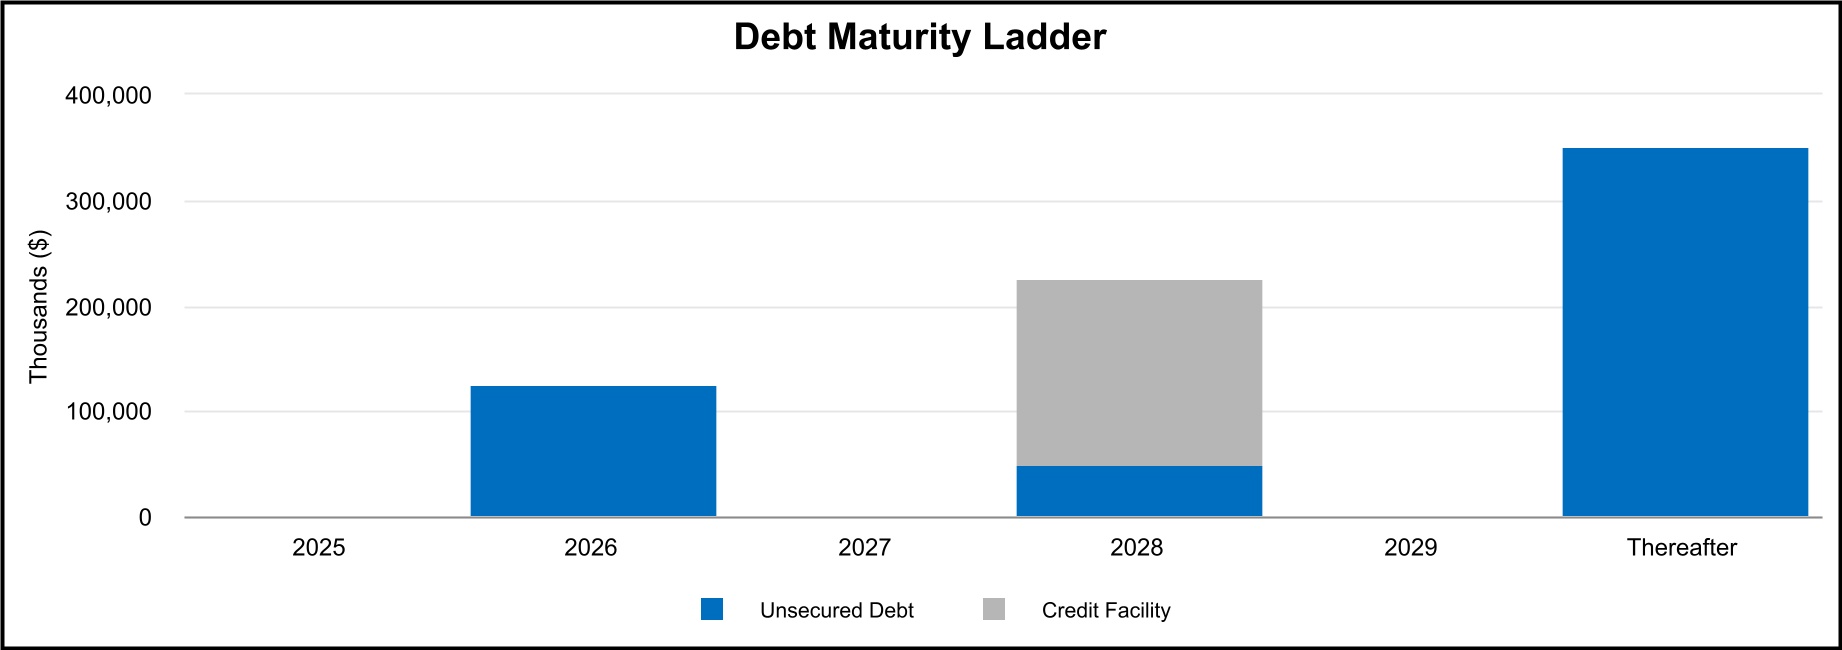
Long Term Debt Maturities (in thousands, except average interest rates) | | ||||
| June 30, 2025 | |||||
| Future Maturities of Debt | |||||||||||||||||||||||
| Year | Unsecured Debt | Credit Facility | Total Debt | Avg Interest Rate | |||||||||||||||||||
| 2025 | $ | — | $ | — | $ | — | —% | ||||||||||||||||
| 2026 | 125,000 | (1) | — | 125,000 | 5.8% | ||||||||||||||||||
| 2027 | — | — | — | —% | |||||||||||||||||||
| 2028 | 50,000 | 175,000 | (2) | 225,000 | 5.8% | ||||||||||||||||||
| 2029 | — | — | — | —% | |||||||||||||||||||
| Thereafter | 350,000 | — | 350,000 | 4.1% | |||||||||||||||||||
| Scheduled principal payments | $ | 525,000 | $ | 175,000 | $ | 700,000 | 4.9% | ||||||||||||||||
| Net discounts/premiums | (60) | — | (60) | ||||||||||||||||||||
| Loan costs, net of amortization | (1,744) | — | (1,744) | ||||||||||||||||||||
| Total maturities | $ | 523,196 | $ | 175,000 | $ | 698,196 | 4.9% | ||||||||||||||||
Weighted average maturity = 3.8 years | |||||||||||||||||||||||
______________________________ | |||||||||||||||||||||||
(1) In the first quarter of 2023, we entered into a $125.0 million 2023 Term Loan with an interest rate of SOFR (subject to a credit spread adjustment of 10 basis points) plus a margin of 95 basis points (subject to adjustment depending on Elme Communities' credit rating). The original term of the 2023 Term Loan had a two-year term ending in January 2025, with two one-year extension options. In the fourth quarter of 2024, we exercised one of two one-year extension options to extend the maturity of the loan to January 10, 2026. In the first quarter of 2023, Elme Communities entered into two interest rate swap arrangements with an aggregate notional amount of $125.0 million that effectively fixed the interest at 4.73% for the 2023 Term Loan beginning on July 21, 2023 through the 2023 Term Loan’s initial maturity date of January 10, 2025. In the second quarter of 2024, we entered into two forward interest rate swap arrangements with an aggregate notional amount of $150.0 million beginning on January 10, 2025 through the loan maturity date of January 10, 2026. These forward interest rate swap arrangements effectively fix (i) a portion of our variable rate debt based on an adjusted daily SOFR at 4.72% (subject to applicable interest rate margins) and (ii) the 2023 Term Loan’s interest rate at 5.77% beginning on January 10, 2025 through the loan maturity date of January 10, 2026. | |||||||||||||||||||||||
(2) In the third quarter of 2024, we executed an amended and restated credit agreement (the “Amended Credit Agreement”) that provides for a revolving credit facility of $500.0 million that matures in July 2028, with two six-month extension options. | |||||||||||||||||||||||
Debt Covenant Compliance | | ||||
| Unsecured Public Debt Covenants | Unsecured Private Debt Covenants | ||||||||||||||||||||||||||||||||||
| Notes Payable | Line of Credit and Term Loan | Notes Payable | |||||||||||||||||||||||||||||||||
| Quarter Ended June 30, 2025 | Covenant | Quarter Ended June 30, 2025 | Covenant | Quarter Ended June 30, 2025 | Covenant | ||||||||||||||||||||||||||||||
% of Total Indebtedness to Total Assets(1) | 34.4 | % | ≤ 65.0% | N/A | N/A | N/A | N/A | ||||||||||||||||||||||||||||
| Ratio of Income Available for Debt Service to Annual Debt Service | 3.1 | ≥ 1.5 | N/A | N/A | N/A | N/A | |||||||||||||||||||||||||||||
% of Secured Indebtedness to Total Assets(1) | — | % | ≤ 40.0% | N/A | N/A | N/A | N/A | ||||||||||||||||||||||||||||
Ratio of Total Unencumbered Assets(2) to Total Unsecured Indebtedness | 2.9 | ≥ 1.5 | N/A | N/A | N/A | N/A | |||||||||||||||||||||||||||||
% of Net Consolidated Total Indebtedness to Consolidated Total Asset Value(3) (7) | N/A | N/A | 27.7 | % | ≤ 60.0% | 27.0 | % | ≤ 60.0% | |||||||||||||||||||||||||||
Ratio of Consolidated Adjusted EBITDA(4) to Consolidated Fixed Charges(5) | N/A | N/A | 3.63 | ≥ 1.50 | 3.63 | ≥ 1.50 | |||||||||||||||||||||||||||||
% of Consolidated Secured Indebtedness to Consolidated Total Asset Value(3) (7) | N/A | N/A | — | % | ≤ 40.0% | — | % | ≤ 40.0% | |||||||||||||||||||||||||||
% of Consolidated Unsecured Indebtedness to Unencumbered Pool Value(6) (7) | N/A | N/A | 27.7 | % | ≤ 60.0% | 27.0 | % | ≤ 60.0% | |||||||||||||||||||||||||||
______________________________ | |||||||||||||||||||||||||||||||||||
(1) Total Assets is calculated by applying a capitalization rate of 7.50% to the EBITDA(4) from the last four consecutive quarters, excluding EBITDA from acquired, disposed, and non-stabilized development properties. | |||||||||||||||||||||||||||||||||||
(2) Total Unencumbered Assets is calculated by applying a capitalization rate of 7.50% to the EBITDA(4) from unencumbered properties from the last four consecutive quarters, excluding EBITDA from acquired, disposed, and non-stabilized development properties. | |||||||||||||||||||||||||||||||||||
(3) Consolidated Total Asset Value is the sum of unrestricted cash plus the quotient of applying a capitalization rate to the annualized NOI from the most recently ended quarter for each asset class, excluding NOI from disposed properties, acquisitions during the past 6 quarters, development, major redevelopment and low occupancy properties. To this amount, we add the purchase price of acquisitions during the past 6 quarters plus values for development, major redevelopment and low occupancy properties. | |||||||||||||||||||||||||||||||||||
(4) Consolidated Adjusted EBITDA is defined as earnings before noncontrolling interests, depreciation, amortization, interest expense, income tax expense, acquisition costs, extraordinary, unusual or nonrecurring transactions including sale of assets, impairment, gains and losses on extinguishment of debt and other non-cash charges. | |||||||||||||||||||||||||||||||||||
(5) Consolidated Fixed Charges consist of interest expense excluding capitalized interest and amortization of deferred financing costs, principal payments and preferred dividends, if any. | |||||||||||||||||||||||||||||||||||
(6) Unencumbered Pool Value is the sum of unrestricted cash plus the quotient of applying a capitalization rate to the annualized NOI from unencumbered properties from the most recently ended quarter for each asset class excluding NOI from disposed properties, acquisitions during the past 6 quarters, development, major redevelopment and low occupancy properties. To this we add the purchase price of unencumbered acquisitions during the past 6 quarters and values for unencumbered development, major redevelopment and low occupancy properties. | |||||||||||||||||||||||||||||||||||
(7) For the line of credit and 2023 Term Loan, Watergate 600 is valued at its undepreciated GAAP book value for Consolidated Total Asset Value and Unencumbered Pool Value. | |||||||||||||||||||||||||||||||||||
Capital Analysis (In thousands, except per share amounts) | | ||||
| Three Months Ended | ||||||||||||||||||||||||||||||||||||||||||||
| June 30, 2025 | March 31, 2025 | December 31, 2024 | September 30, 2024 | June 30, 2024 | ||||||||||||||||||||||||||||||||||||||||
| Market Data | ||||||||||||||||||||||||||||||||||||||||||||
| Shares Outstanding | 88,162 | 88,157 | 88,029 | 88,010 | 88,011 | |||||||||||||||||||||||||||||||||||||||
| Market Price per Share | $ | 15.90 | $ | 17.40 | $ | 15.27 | $ | 17.59 | $ | 15.93 | ||||||||||||||||||||||||||||||||||
| Equity Market Capitalization | $ | 1,401,776 | $ | 1,533,932 | $ | 1,344,203 | $ | 1,548,096 | $ | 1,402,015 | ||||||||||||||||||||||||||||||||||
| Total Debt | $ | 698,196 | $ | 705,061 | $ | 698,953 | $ | 690,914 | $ | 678,733 | ||||||||||||||||||||||||||||||||||
| Total Market Capitalization | $ | 2,099,972 | $ | 2,238,993 | $ | 2,043,156 | $ | 2,239,010 | $ | 2,080,748 | ||||||||||||||||||||||||||||||||||
| Total Debt to Market Capitalization | 0.33 | :1 | 0.31 | :1 | 0.34 | :1 | 0.31 | :1 | 0.33 | :1 | ||||||||||||||||||||||||||||||||||
Earnings to Fixed Charges(1) | 0.6x | 0.5x | 0.7x | 0.7x | 0.6x | |||||||||||||||||||||||||||||||||||||||
Debt Service Coverage Ratio(2) | 3.3x | 3.3x | 3.2x | 3.2x | 3.2x | |||||||||||||||||||||||||||||||||||||||
| Dividend Data | Six Months Ended | Three Months Ended | ||||||||||||||||||||||||||||||||||||||||||
| June 30, 2025 | June 30, 2024 | June 30, 2025 | March 31, 2025 | December 31, 2024 | September 30, 2024 | June 30, 2024 | ||||||||||||||||||||||||||||||||||||||
| Total Dividends Declared | $ | 31,890 | $ | 31,801 | $ | 15,947 | $ | 15,943 | $ | 15,894 | $ | 15,906 | $ | 15,916 | ||||||||||||||||||||||||||||||
| Common Dividend Declared per Share | $ | 0.36 | $ | 0.36 | $ | 0.18 | $ | 0.18 | $ | 0.18 | $ | 0.18 | $ | 0.18 | ||||||||||||||||||||||||||||||
Payout Ratio (Core FFO basis)(3) | 73.5 | % | 78.3 | % | 75.0 | % | 75.0 | % | 75.0 | % | 78.3 | % | 78.3 | % | ||||||||||||||||||||||||||||||
Payout Ratio (Core AFFO basis)(4) | 75.0 | % | 80.0 | % | 75.0 | % | 78.3 | % | ||||||||||||||||||||||||||||||||||||
______________________________ | ||||||||||||||||||||||||||||||||||||||||||||
(1) The ratio of earnings to fixed charges is computed by dividing earnings by fixed charges. For this purpose, earnings consist of income from continuing operations attributable to the controlling interests plus fixed charges, less capitalized interest. Fixed charges consist of interest expense, including amortized costs of debt issuance, plus interest costs capitalized. | ||||||||||||||||||||||||||||||||||||||||||||
(2) Debt service coverage ratio is calculated by dividing Adjusted EBITDA by interest expense and principal amortization. Adjusted EBITDA is a non-GAAP measure. See “Definitions” on page 10 for the definition of Adjusted EBITDA. | ||||||||||||||||||||||||||||||||||||||||||||
(3) Payout Ratio (Core FFO basis) is calculated by dividing the common dividend per share by the Core FFO per share. Core FFO is a non-GAAP measure. See “Definitions” on page 10 for the definition of Core FFO. | ||||||||||||||||||||||||||||||||||||||||||||
(4) Payout Ratio (Core AFFO basis) is calculated by dividing the common dividend per share by the Core AFFO per share. Core AFFO is a non-GAAP measure. See “Definitions” on page 10 for the definition of Core AFFO. | ||||||||||||||||||||||||||||||||||||||||||||
Net Loss to NOI Reconciliations (In thousands) | | ||||
| Six Months Ended | Three Months Ended | |||||||||||||||||||||||||||||||||||||||||||
| June 30, 2025 | June 30, 2024 | June 30, 2025 | March 31, 2025 | December 31, 2024 | September 30, 2024 | June 30, 2024 | ||||||||||||||||||||||||||||||||||||||
| Net loss | $ | (8,241) | $ | (7,118) | $ | (3,566) | $ | (4,675) | $ | (3,015) | $ | (2,970) | $ | (3,471) | ||||||||||||||||||||||||||||||
| Adjustments: | ||||||||||||||||||||||||||||||||||||||||||||
| Property management expense | 4,502 | 4,393 | 2,256 | 2,246 | 2,233 | 2,235 | 2,175 | |||||||||||||||||||||||||||||||||||||
| General and administrative expense | 16,918 | 12,334 | 7,689 | 9,229 | 6,281 | 6,354 | 6,138 | |||||||||||||||||||||||||||||||||||||
| Real estate depreciation and amortization | 46,799 | 48,838 | 23,560 | 23,239 | 23,623 | 23,474 | 23,895 | |||||||||||||||||||||||||||||||||||||
| Interest expense | 18,958 | 18,878 | 9,498 | 9,460 | 9,400 | 9,557 | 9,384 | |||||||||||||||||||||||||||||||||||||
| Loss on extinguishment of debt | — | — | — | — | — | 147 | — | |||||||||||||||||||||||||||||||||||||
| Other income | — | (1,410) | — | — | — | — | — | |||||||||||||||||||||||||||||||||||||
Total Net operating income (NOI)(1) | $ | 78,936 | $ | 75,915 | $ | 39,437 | $ | 39,499 | $ | 38,522 | $ | 38,797 | $ | 38,121 | ||||||||||||||||||||||||||||||
| Multifamily NOI: | ||||||||||||||||||||||||||||||||||||||||||||
| Same-store portfolio | $ | 72,944 | $ | 69,497 | $ | 36,483 | $ | 36,461 | $ | 35,640 | $ | 35,668 | $ | 34,927 | ||||||||||||||||||||||||||||||
| Development | (124) | (114) | (61) | (63) | (58) | (61) | (57) | |||||||||||||||||||||||||||||||||||||
| Total | 72,820 | 69,383 | 36,422 | 36,398 | 35,582 | 35,607 | 34,870 | |||||||||||||||||||||||||||||||||||||
| Other NOI (Watergate 600) | 6,116 | 6,532 | 3,015 | 3,101 | 2,940 | 3,190 | 3,251 | |||||||||||||||||||||||||||||||||||||
| Total NOI | $ | 78,936 | $ | 75,915 | $ | 39,437 | $ | 39,499 | $ | 38,522 | $ | 38,797 | $ | 38,121 | ||||||||||||||||||||||||||||||
______________________________ | ||||||||||||||||||||||||||||||||||||||||||||
(1) NOI is a non-GAAP measure. See “Definitions” on page 10 for the definition of NOI and reconciliation of Net loss to NOI on the current page. | ||||||||||||||||||||||||||||||||||||||||||||