
Exhibit 99.2
First Quarter 2007
Supplemental Operating and Financial Data
for the Quarter Ended March 31, 2007
| Contact: |
6110 Executive Boulevard | |
| Sara Grootwassink |
Suite 800 | |
| Chief Financial Officer |
Rockville, MD 20852 | |
| Direct Dial: (301) 255-0820 |
(301) 984-9400 | |
| E-mail: sgrootwassink@writ.com |
(301) 984-9610 fax |

Company Background and Highlights
First Quarter 2007
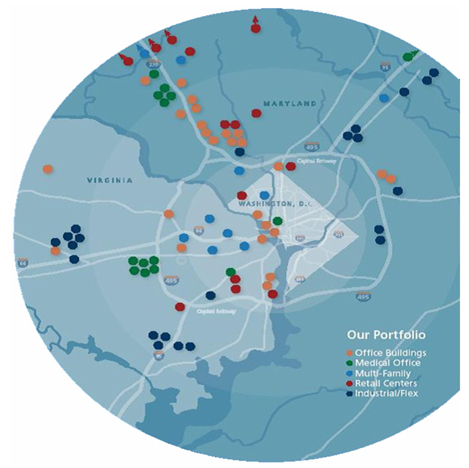
Washington Real Estate Investment Trust (the “Company”) is a self-administered, self-managed, equity real estate investment trust (REIT) investing in income-producing properties in the greater Washington metropolitan region. WRIT is diversified, as it invests in multi-family, retail, industrial/flex, office, and medical office segments.
In the year 2006, WRIT increased its dividend for the 36th consecutive year and achieved its 34th consecutive year of increased FFO per share. WRIT acquired 14 properties for $303 million and added 1.5 million square feet to the portfolio. We raised over $350 million of capital and entered into an unsecured revolving credit facility with an initial capacity of $200 million. WRIT strengthened its level of corporate governance appointing two new Trustees to the Board. And George “Skip” McKenzie was promoted to President and Chief Operating Officer.
In first quarter 2007, WRIT continued its momentum in both acquisitions and capital markets activity. This quarter, we raised $150 million of capital and acquired $155 million of assets. Our three development projects are progressing well and will be completed in 2007. WRIT announced its 181st consecutive quarterly dividend at equal or increasing rates.
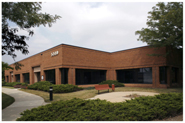
On February 8, 2007, WRIT acquired a portfolio of five single-story flex buildings, consisting of 157,000 square feet, within 270 Technology Park in Frederick, Maryland for $26.5 million. 270 Technology Park presents a solid investment opportunity in high-quality flex buildings ideally located with excellent visibility just south of the City of Frederick along I-270 in one of Frederick’s fast-growing development areas.
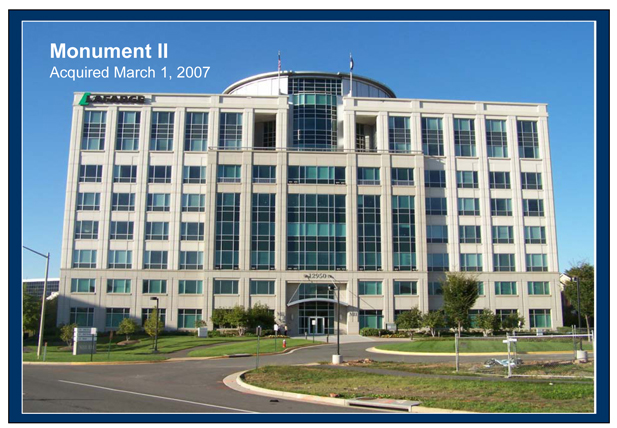
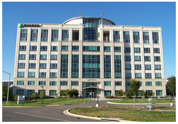
On March 1, 2007, WRIT acquired the 100% leased Monument II, a class A, 205,000 square foot, eight-story office building with a detached five-level parking garage located along the Dulles Toll Road in Herndon, Virginia for $78.2 million. Monument II was completed in 2000 as part of the Monument at Worldgate complex, a mixed-use development consisting of class A office, retail, restaurants, hotels, health clubs, and residential buildings.
On March 9, 2007, WRIT acquired 2440 M Street, a Class A medical office building, consisting of 110,000 square feet, with a three-level parking garage in northwest Washington, D.C. for $50.0 million. 2440 M Street is well-positioned in the West End business district, just three blocks from George Washington University Hospital and 1 1/2 miles from Georgetown University Hospital.
In additon to the recent acquisitions, WRIT has several developments in progress. Bennett Park, formerly Rosslyn Towers, is a ground-up development project in Arlington, Virginia consisting of high-rise and mid-rise Class A apartment buildings with a total of 224 units and 5,900 square feet of retail space. Construction is anticipated to be complete on the high-rise building in fourth quarter 2007 and on the mid-rise in third quarter 2007. Total cost of the project is estimated to be $76.6 million.
1
The Clayborne Apartments, formerly South Washington Street, is a ground-up development project in Alexandria, Virginia, adjacent to our 800 South Washington retail property. This project is a 75-unit Class A apartment building that will include 2,600 square feet of additional retail space. Construction is anticipated to be completed on the building in third quarter 2007. Total cost of the project is estimated to be $32.7 million.
Dulles Station is a 180,000 square foot development project of office and retail space located in Herndon, Virginia. Phase One of the Dulles Station development is anticipated to be complete in third quarter 2007 with an estimated cost of $52.0 million.
This quarter, WRIT raised more than $150 million in capital. On January 17, 2007, WRIT issued $135 million of 3 7/8% Convertible Senior Notes due 2026. The $15 million over-allotment option was exercised and closed on January 30, 2007. Acquisitions and development were financed with proceeds from the January convertible note offering, borrowings on our line of credit, and cash from operations.
As of March 31, 2007, WRIT owns a diversified portfolio of 85 properties consisting of 14 retail centers, 25 general purpose office properties, 14 medical office properties, 23 industrial/flex properties, 9 multi-family properties and land for development. WRIT’s dividends have increased every year for 36 consecutive years and its FFO per share has increased every year for 34 consecutive years. WRIT shares are publicly traded on the New York Stock Exchange (NYSE:WRE).
2
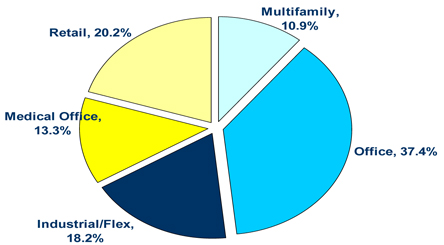
Net Operating Income Contribution by Sector - First Quarter 2007
With investments in the multifamily, retail, industrial/flex, office and medical office segments, WRIT is uniquely diversified. This balanced portfolio provides stability during market fluctuations in specific property types.
First Quarter 2007 Acquisitons
| 2440 M Street | Monument II | 270 Technology Park | ||
| Washington, D.C. | Herndon, VA | Frederick, MD | ||
 |
 |
 |
Certain statements in the supplemental disclosures which follow are “forward-looking statements” within the meaning of the Private Securities Litigation Reform Act of 1995. Such statements involve known and unknown risks, uncertainties and other factors that may cause actual results to differ materially. Such risks, uncertainties and other factors include, but are not limited to, fluctuations in interest rates, availability of raw materials and labor costs, levels of competition, the effect of government regulation, the availability of capital, weather conditions, the timing and pricing of lease transactions and changes in general and local economic and real estate market conditions, and other risks and uncertainties detailed from time to time in our filings with the SEC, including our 2006 Form 10-K. We assume no obligation to update or supplement forward-looking statements that become untrue because of subsequent events.
3
Supplemental Financial and Operating Data
Table of Contents
March 31, 2007
| Schedule |
Page | |
| Key Financial Data |
||
| Consolidated Statements of Operations |
5 | |
| Consolidated Balance Sheets |
6 | |
| Funds From Operations and Funds Available for Distribution |
7 | |
| Earnings Before Interest Taxes Depreciation and Amortization (EBITDA) |
8 | |
| Capital Analysis |
||
| Long-Term Debt Analysis |
9-10 | |
| Capital Analysis |
11 | |
| Portfolio Analysis |
||
| Core Portfolio Net Operating Income (NOI) Growth & Rental Rate Growth |
12 | |
| Core Portfolio Net Operating Income (NOI) Summary |
13 | |
| Core Portfolio Net Operating Income (NOI) Detail for the Quarter |
14-15 | |
| Core Portfolio & Overall Economic Occupancy Levels by Sector |
16 | |
| Tenant Analysis |
||
| Commercial Leasing Summary |
17-18 | |
| 10 Largest Tenants - Based on Annualized Base Rent |
19 | |
| Industry Diversification |
20 | |
| Lease Expirations as of March 31, 2007 |
21 | |
| Growth and Strategy |
||
| 2007 Acquisition Summary |
22 | |
| 2007 Development Summary |
23 | |
| Performance Data |
||
| 12, 36 and 60 Month Total Returns Chart |
24 | |
| Appendix |
||
| Schedule of Properties |
25-26 | |
| Reporting Definitions |
27 | |
Consolidated Statements of Operations
(In thousands, except per share data)
(unaudited)
| Three Months Ended | ||||||||||||||||||||
| 03/31/07 | 12/31/06 | 09/30/06 | 06/30/06 | 03/31/06 | ||||||||||||||||
| OPERATING RESULTS |
||||||||||||||||||||
| Real estate rental revenue |
$ | 60,798 | $ | 57,111 | $ | 54,857 | $ | 51,351 | $ | 49,220 | ||||||||||
| Real estate expenses |
(18,959 | ) | (17,443 | ) | (17,025 | ) | (14,840 | ) | (14,777 | ) | ||||||||||
| 41,839 | 39,668 | 37,832 | 36,511 | 34,443 | ||||||||||||||||
| Real estate depreciation and amortization |
(16,378 | ) | (14,526 | ) | (13,588 | ) | (12,462 | ) | (11,496 | ) | ||||||||||
| Income from real estate |
25,461 | 25,142 | 24,244 | 24,049 | 22,947 | |||||||||||||||
| Other income |
618 | 269 | 293 | 175 | 170 | |||||||||||||||
| Other income from life insurance proceeds |
1,303 | |||||||||||||||||||
| Interest expense |
(14,376 | ) | (13,392 | ) | (12,527 | ) | (11,604 | ) | (10,322 | ) | ||||||||||
| General and administrative |
(2,883 | ) | (2,461 | ) | (2,230 | ) | (5,276 | ) | (2,656 | ) | ||||||||||
| Income from continuing operations |
10,123 | 9,558 | 9,780 | 7,344 | 10,139 | |||||||||||||||
| Discontinued operations: |
||||||||||||||||||||
| Income from operations of properties sold or held for sale |
589 | 523 | 450 | 375 | 493 | |||||||||||||||
| Net Income |
$ | 10,712 | $ | 10,081 | $ | 10,230 | $ | 7,719 | $ | 10,632 | ||||||||||
| Per Share Data |
||||||||||||||||||||
| Net Income |
$ | 0.24 | $ | 0.22 | $ | 0.23 | $ | 0.18 | $ | 0.25 | ||||||||||
| Fully diluted weighted average shares outstanding |
45,153 | 45,122 | 45,093 | 43,037 | 42,197 | |||||||||||||||
| Percentage of Revenues: |
||||||||||||||||||||
| Real estate expenses |
31.2 | % | 30.5 | % | 31.0 | % | 28.9 | % | 30.0 | % | ||||||||||
| General and administrative |
4.7 | % | 4.3 | % | 4.1 | % | 10.3 | % | 5.4 | % | ||||||||||
| Ratios: |
||||||||||||||||||||
| EBITDA / Interest expense |
2.8 | x | 2.9 | x | 2.9 | x | 2.8 | x | 3.2 | x | ||||||||||
| Income from continuing operations/Total real estate revenue |
16.7 | % | 16.7 | % | 17.8 | % | 14.3 | % | 20.6 | % | ||||||||||
| Net income/Total real estate revenue |
17.6 | % | 17.7 | % | 18.6 | % | 15.0 | % | 21.6 | % | ||||||||||
Note: Certain prior quarter amounts have been reclassified to conform to the current quarter presentation.
5
Consolidated Balance Sheets
(In thousands)
(unaudited)
| March 31, 2007 |
December 31, 2006 |
September 30, 2006 |
June 30, 2006 |
March 31, 2006 |
||||||||||||||||
| Assets |
||||||||||||||||||||
| Land |
$ | 316,269 | $ | 288,821 | $ | 288,822 | $ | 261,354 | $ | 227,110 | ||||||||||
| Income producing property |
1,394,944 | 1,264,442 | 1,246,046 | 1,123,365 | 1,013,412 | |||||||||||||||
| 1,711,213 | 1,553,263 | 1,534,868 | 1,384,719 | 1,240,522 | ||||||||||||||||
| Accumulated depreciation and amortization |
(290,663 | ) | (277,016 | ) | (263,732 | ) | (251,317 | ) | (239,763 | ) | ||||||||||
| Net income producing property |
1,420,550 | 1,276,247 | 1,271,136 | 1,133,402 | 1,000,759 | |||||||||||||||
| Development in progress, including land held for development |
136,831 | 120,656 | 110,394 | 90,612 | 69,820 | |||||||||||||||
| Total investment in real estate, net |
1,557,381 | 1,396,903 | 1,381,530 | 1,224,014 | 1,070,579 | |||||||||||||||
| Investment in real estate held for sale, net |
29,167 | 29,551 | 29,824 | 29,301 | 29,161 | |||||||||||||||
| Cash and cash equivalents |
7,305 | 8,721 | 11,832 | 13,970 | 2,981 | |||||||||||||||
| Restricted cash |
5,143 | 4,151 | 4,692 | 2,540 | 2,401 | |||||||||||||||
| Rents and other receivables, net of allowance for doubtful accounts |
33,342 | 31,649 | 29,567 | 28,202 | 26,345 | |||||||||||||||
| Prepaid expenses and other assets |
70,263 | 58,192 | 53,895 | 44,112 | 39,763 | |||||||||||||||
| Other assets related to properties sold or held for sale |
2,039 | 2,098 | 2,159 | 1,656 | 1,551 | |||||||||||||||
| Total Assets |
$ | 1,704,640 | $ | 1,531,265 | $ | 1,513,499 | $ | 1,343,795 | $ | 1,172,781 | ||||||||||
| Liabilities and Shareholders’ Equity |
||||||||||||||||||||
| Notes payable |
$ | 879,035 | $ | 728,255 | $ | 728,216 | $ | 618,662 | $ | 518,656 | ||||||||||
| Mortgage notes payable |
228,367 | 237,073 | 238,051 | 178,834 | 168,965 | |||||||||||||||
| Lines of credit/short-term note payable |
91,200 | 61,000 | 28,000 | 19,000 | 59,000 | |||||||||||||||
| Accounts payable and other liabilities |
52,227 | 45,089 | 52,191 | 53,995 | 36,255 | |||||||||||||||
| Advance rents |
6,838 | 5,894 | 6,145 | 5,796 | 5,227 | |||||||||||||||
| Tenant security deposits |
9,510 | 9,231 | 9,087 | 8,099 | 7,168 | |||||||||||||||
| Other liabilities related to properties sold or held for sale |
1,062 | 1,053 | 1,002 | 1,100 | 877 | |||||||||||||||
| Total Liabilities |
1,268,239 | 1,087,595 | 1,062,692 | 885,486 | 796,148 | |||||||||||||||
| Minority interest |
1,758 | 1,739 | 1,717 | 1,699 | 1,687 | |||||||||||||||
| Shareholders’ Equity |
||||||||||||||||||||
| Shares of beneficial interest, $0.01 par value; 100,000 shares authorized |
451 | 451 | 450 | 450 | 422 | |||||||||||||||
| Additional paid-in capital |
501,325 | 500,727 | 499,393 | 498,577 | 406,098 | |||||||||||||||
| Distributions in excess of net income |
(67,133 | ) | (59,247 | ) | (50,753 | ) | (42,417 | ) | (31,574 | ) | ||||||||||
| Total Shareholders’ Equity |
434,643 | 441,931 | 449,090 | 456,610 | 374,946 | |||||||||||||||
| Total Liabilities and Shareholders’ Equity |
$ | 1,704,640 | $ | 1,531,265 | $ | 1,513,499 | $ | 1,343,795 | $ | 1,172,781 | ||||||||||
| Total Debt / Total Market Capitalization |
0.42:1 | 0.36:1 | 0.36:1 | 0.33:1 | 0.35:1 | |||||||||||||||
Note: Certain prior quarter amounts have been reclassified to conform to the current quarter presentation.
6
Funds From Operations and Funds Available for Distribution
(In thousands, except per share data)
(unaudited)
| Three Months Ended | ||||||||||||||||||||
| 3/31/2007 | 12/31/2006 | 9/30/2006 | 6/30/2006 | 03/31/06 | ||||||||||||||||
| Funds From Operations(1) |
||||||||||||||||||||
| Net Income |
$ | 10,712 | $ | 10,081 | $ | 10,230 | $ | 7,719 | $ | 10,632 | ||||||||||
| Real estate depreciation and amortization |
16,378 | 14,526 | 13,588 | 12,462 | 11,496 | |||||||||||||||
| Other income from life insurance proceeds |
(1,303 | ) | ||||||||||||||||||
| Discontinued operations: |
||||||||||||||||||||
| Real estate depreciation and amortization |
397 | 548 | 550 | 528 | 472 | |||||||||||||||
| Funds From Operations (FFO) |
$ | 26,184 | $ | 25,155 | $ | 24,368 | $ | 20,709 | $ | 22,600 | ||||||||||
| FFO per share - basic |
$ | 0.58 | $ | 0.56 | $ | 0.54 | $ | 0.48 | $ | 0.54 | ||||||||||
| FFO per share - fully diluted |
$ | 0.58 | $ | 0.56 | $ | 0.54 | $ | 0.48 | $ | 0.54 | ||||||||||
| Funds Available for Distribution(2) |
||||||||||||||||||||
| Tenant Improvements |
(2,161 | ) | (2,143 | ) | (2,602 | ) | (2,033 | ) | (2,695 | ) | ||||||||||
| External and Internal Leasing Commissions Capitalized |
(2,068 | ) | (1,554 | ) | (1,604 | ) | (1,477 | ) | (960 | ) | ||||||||||
| Recurring Capital Improvements |
(1,936 | ) | (1,648 | ) | (2,019 | ) | (2,724 | ) | (2,295 | ) | ||||||||||
| Straight-Line Rent, Net |
(1,171 | ) | (757 | ) | (836 | ) | (686 | ) | (812 | ) | ||||||||||
| Non-real estate depreciation and amortization |
750 | 765 | 640 | 554 | 495 | |||||||||||||||
| Amortization of lease intangibles, net |
(595 | ) | 197 | 91 | (17 | ) | 13 | |||||||||||||
| Amortization and expensing of restricted share and unit compensation |
782 | 1,081 | 556 | 1,487 | 340 | |||||||||||||||
| Funds Available for Distribution (FAD) |
$ | 19,785 | $ | 21,096 | $ | 18,594 | $ | 15,813 | $ | 16,686 | ||||||||||
| Total Dividends Paid |
$ | 18,581 | $ | 18,580 | $ | 18,567 | $ | 18,562 | $ | 16,979 | ||||||||||
| Average shares - basic |
44,931 | 44,894 | 44,874 | 42,852 | 42,052 | |||||||||||||||
| Average shares - fully diluted |
45,153 | 45,122 | 45,093 | 43,037 | 42,197 | |||||||||||||||
| (1) |
Funds From Operations (“FFO”) – The National Association of Real Estate Investment Trusts, Inc. (“NAREIT”) defines FFO (April, 2002 White Paper) as net income (computed in accordance with generally accepted accounting principles (“GAAP”)) excluding gains (or losses) from sales of property plus real estate depreciation and amortization. We consider FFO to be a standard supplemental measure for equity real estate investment trusts (“REITs”) because it facilitates an understanding of the operating performance of our properties without giving effect to real estate depreciation and amortization, which historically assumes that the value of real estate assets diminishes predictably over time. Since real estate values have instead historically risen or fallen with market conditions, we believe that FFO more accurately provides investors an indication of our ability to incur and service debt, make capital expenditures and fund other needs. FFO is a non-GAAP measure. |
| (2) |
Funds Available for Distribution (“FAD”) is calculated by subtracting from FFO (1) recurring expenditures, tenant improvements and leasing costs, that are capitalized and amortized and are necessary to maintain our properties and revenue stream and (2) straight line rents, then adding (3) non-real estate depreciation and amortization and adding or subtracting the amortization of lease intangibles as appropriate. FAD is included herein, because we consider it to be a measure of a REIT’s ability to incur and service debt and to distribute dividends to its shareholders. FAD is a non-GAAP and non-standardized measure, and may be calculated differently by other REITs. |
7
Earnings Before Interest Taxes Depreciation and Amortization (EBITDA)
(In thousands)
(unaudited)
| Three Months Ended | ||||||||||||||||||||
| 03/31/07 | 12/31/06 | 09/30/06 | 06/30/06 | 03/31/06 | ||||||||||||||||
| EBITDA(1) |
||||||||||||||||||||
| Net income |
$ | 10,712 | $ | 10,081 | $ | 10,230 | $ | 7,719 | $ | 10,632 | ||||||||||
| Add: |
||||||||||||||||||||
| Interest expense |
14,376 | 13,392 | 12,527 | 11,604 | 10,322 | |||||||||||||||
| Real estate depreciation and amortization |
16,775 | 15,074 | 14,138 | 12,990 | 11,968 | |||||||||||||||
| Non-real estate depreciation |
136 | 117 | 107 | 87 | 73 | |||||||||||||||
| Less: |
||||||||||||||||||||
| Other income |
(1,921 | ) | (269 | ) | (293 | ) | (175 | ) | (170 | ) | ||||||||||
| EBITDA |
$ | 40,078 | $ | 38,395 | $ | 36,709 | $ | 32,225 | $ | 32,825 | ||||||||||
| (1) |
EBITDA is earnings before interest, taxes, depreciation and amortization. We consider EBITDA to be an appropriate supplemental performance measure because it eliminates depreciation, interest and the gain (loss) from property dispositions, which permits investors to view income from operations without the effect of non-cash depreciation or the cost of debt. EBITDA is a non-GAAP measure. |
8
Long-Term Debt Analysis
(In thousands, except per share amounts)
| March 31, 2007 |
December 31, 2006 |
September 30, 2006 |
June 30, 2006 |
March 31, 2006 |
||||||||||||||||
| Balances Outstanding |
||||||||||||||||||||
| Secured |
||||||||||||||||||||
| Conventional fixed rate |
$ | 228,367 | $ | 237,073 | $ | 238,051 | $ | 178,834 | $ | 168,965 | ||||||||||
| Secured total |
228,367 | 237,073 | 238,051 | 178,834 | 168,965 | |||||||||||||||
| Unsecured |
||||||||||||||||||||
| Fixed rate bonds and notes |
879,035 | 728,255 | 728,216 | 618,662 | 518,656 | |||||||||||||||
| Credit facility |
91,200 | 61,000 | 28,000 | 19,000 | 59,000 | |||||||||||||||
| Unsecured total |
970,235 | 789,255 | 756,216 | 637,662 | 577,656 | |||||||||||||||
| Total |
$ | 1,198,602 | $ | 1,026,328 | $ | 994,267 | $ | 816,496 | $ | 746,621 | ||||||||||
| Average Interest Rates |
||||||||||||||||||||
| Secured |
||||||||||||||||||||
| Conventional fixed rate |
5.9 | % | 5.9 | % | 5.9 | % | 5.9 | % | 5.9 | % | ||||||||||
| Secured total |
5.9 | % | 5.9 | % | 5.9 | % | 5.9 | % | 5.9 | % | ||||||||||
| Unsecured |
||||||||||||||||||||
| Fixed rate bonds |
5.2 | % | 5.5 | % | 5.5 | % | 5.9 | % | 5.9 | % | ||||||||||
| Credit facilities |
5.8 | % | 6.0 | % | 5.9 | % | 5.9 | % | 5.3 | % | ||||||||||
| Unsecured total |
5.3 | % | 5.6 | % | 5.5 | % | 5.9 | % | 5.8 | % | ||||||||||
| Average |
5.4 | % | 5.6 | % | 5.6 | % | 5.9 | % | 5.9 | % | ||||||||||
Note: The current balance outstanding of the fixed rate bonds and notes is shown net of discounts/premiums in the amount of $965,477.
9
Long-Term Debt Analysis
(In thousands, except per share amounts)
Continued from previous page
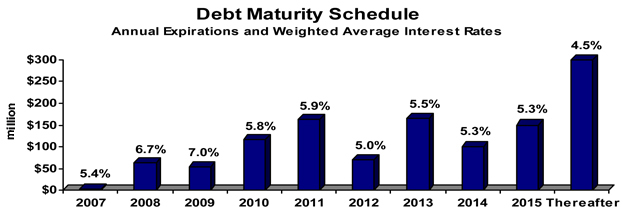
| Future Maturities of Debt | |||||||||||||||
| Year |
Secured Debt | Unsecured Debt | Credit Facilities | Total Debt | Average Interest Rate | ||||||||||
| 2007 |
$ | 2,558 | $ | — | $ | — | $ | 2,558 | 5.4 | % | |||||
| 2008 |
3,571 | 60,000 | — | 63,571 | 6.7 | % | |||||||||
| 2009 |
53,768 | — | — | 53,768 | 7.0 | % | |||||||||
| 2010 |
25,428 | — | 91,200 | 116,628 | 5.8 | % | |||||||||
| 2011 |
12,763 | 150,000 | — | 162,763 | 5.9 | % | |||||||||
| 2012 |
20,483 | 50,000 | — | 70,483 | 5.0 | % | |||||||||
| 2013 |
105,396 | 60,000 | — | 165,396 | 5.5 | % | |||||||||
| 2014 |
205 | 100,000 | — | 100,205 | 5.3 | % | |||||||||
| 2015 |
216 | 150,000 | — | 150,216 | 5.3 | % | |||||||||
| Thereafter |
3,979 | 310,000 | — | 313,979 | 4.5 | % | |||||||||
| Total maturities |
$ | 228,367 | $ | 880,000 | $ | 91,200 | $ | 1,199,567 | 5.4 | % | |||||
Weighted average maturity = 9.1 years
10
Capital Analysis
(In thousands, except per share amounts)
| March 31, 2007 |
December 31, 2006 |
September 30, 2006 |
June 30, 2006 |
March 31, 2006 |
||||||||||||||||
| Market Data |
||||||||||||||||||||
| Shares Outstanding |
45,045 | 45,042 | 45,011 | 44,998 | 42,183 | |||||||||||||||
| Market Price per Share |
$ | 37.42 | $ | 40.00 | $ | 39.80 | $ | 36.70 | $ | 33.09 | ||||||||||
| Equity Market Capitalization |
$ | 1,685,584 | $ | 1,801,680 | $ | 1,791,438 | $ | 1,651,427 | $ | 1,395,835 | ||||||||||
| Total Debt |
$ | 1,198,602 | $ | 1,026,328 | $ | 994,267 | $ | 816,496 | $ | 746,621 | ||||||||||
| Total Market Capitalization |
$ | 2,884,186 | $ | 2,828,008 | $ | 2,785,705 | $ | 2,467,923 | $ | 2,142,456 | ||||||||||
| Total Debt to Market Capitalization |
0.42:1 | 0.36:1 | 0.36:1 | 0.33:1 | 0.35:1 | |||||||||||||||
| Earnings to Fixed Charges(1) |
1.6 x | 1.6 x | 1.6 x | 1.5 x | 1.9 x | |||||||||||||||
| Debt Service Coverage Ratio(2) |
2.6 x | 2.7 x | 2.8 x | 2.6 x | 3.0 x | |||||||||||||||
| Dividend Data |
||||||||||||||||||||
| Total Dividends Paid |
$ | 18,581 | $ | 18,580 | $ | 18,567 | $ | 18,562 | $ | 16,979 | ||||||||||
| Common Dividend per Share |
$ | 0.4125 | $ | 0.4125 | $ | 0.4125 | $ | 0.4125 | $ | 0.4025 | ||||||||||
| Payout Ratio (FFO per share basis) |
71.1 | % | 73.7 | % | 76.4 | % | 85.9 | % | 74.5 | % | ||||||||||
| (1) |
The ratio of earnings to fixed charges is computed by dividing earnings by fixed charges. For this purpose, earnings consist of income from continuing operations plus fixed charges, less capitalized interest. Fixed charges consist of interest expense, including amortized costs of debt issuance, plus interest costs capitalized. |
| (2) |
Debt service coverage ratio is computed by dividing earnings before interest income and expense, depreciation, amortization and gain on sale of real estate by interest expense and principal amortization. |
11
Core Portfolio Net Operating Income (NOI) Growth & Rental Rate Growth
2007 vs. 2006
Cash Basis
| First Quarter(1) | ||||||
| Sector |
NOI Growth |
Rental Rate Growth |
||||
| Multifamily |
1.2 | % | 5.1 | % | ||
| Office Buildings |
4.6 | % | 1.8 | % | ||
| Medical Office Buildings |
5.6 | % | 2.9 | % | ||
| Retail Centers |
3.4 | % | 4.8 | % | ||
| Industrial / Flex Properties |
-0.6 | % | 3.2 | % | ||
| Overall Core Portfolio |
2.9 | % | 3.2 | % | ||
GAAP Basis
| First Quarter(1) | ||||||
| Sector |
NOI Growth |
Rental Rate Growth |
||||
| Multifamily |
1.3 | % | 5.2 | % | ||
| Office Buildings |
4.7 | % | 2.1 | % | ||
| Medical Office Buildings |
-0.5 | % | 0.2 | % | ||
| Retail Centers |
7.3 | % | 8.2 | % | ||
| Industrial / Flex Properties |
-3.8 | % | 2.4 | % | ||
| Overall Core Portfolio |
2.6 | % | 3.5 | % | ||
| 1 |
Non-core acquired properties were: |
2007 acquistions - 270 Technology Park, Monument II and 2440 M Street
2006 acquisitions - Hampton Overlook, Hampton South, Alexandria Professional Center, 9707 Medical Center Dr., 15001 Shady Grove Rd., Plumtree Medical Center, Randolph Shopping Center, Montrose Shopping Center, 9950 Business Parkway, 15005 Shady Grove Road, 6565 Arlington Blvd, West Gude Drive, The Ridges and The Crescent.
12
Core Portfolio Net Operating Income (NOI) Summary
(In Thousands)
| Three Months Ended March 31, | |||||||||
| 2007 | 2006 | % Change | |||||||
| Cash Basis: |
|||||||||
| Multifamily |
$ | 4,547 | $ | 4,494 | 1.2 | % | |||
| Office Buildings |
12,716 | 12,152 | 4.6 | % | |||||
| Medical Office Buildings |
3,431 | 3,248 | 5.6 | % | |||||
| Retail Centers |
7,061 | 6,831 | 3.4 | % | |||||
| Industrial/Flex |
6,762 | 6,802 | -0.6 | % | |||||
| $ | 34,517 | $ | 33,527 | 2.9 | % | ||||
| GAAP Basis: |
|||||||||
| Multifamily |
$ | 4,554 | $ | 4,496 | 1.3 | % | |||
| Office Buildings |
13,072 | 12,484 | 4.7 | % | |||||
| Medical Office Buildings |
3,309 | 3,323 | -0.4 | % | |||||
| Retail Centers |
7,575 | 7,057 | 7.3 | % | |||||
| Industrial/Flex |
6,655 | 6,920 | -3.8 | % | |||||
| $ | 35,165 | $ | 34,280 | 2.6 | % | ||||
13
Core Portfolio Net Operating Income (NOI) Detail
(In Thousands)
| Three Months Ended March 31, 2007 | ||||||||||||||||||||||||||||
| Multifamily | Office | Medical Office |
Retail | Industrial | Corporate and Other |
Total | ||||||||||||||||||||||
| Real estate rental revenue |
||||||||||||||||||||||||||||
| Core Portfolio |
$ | 8,172 | $ | 19,793 | $ | 4,595 | $ | 9,639 | $ | 9,088 | $ | — | $ | 51,287 | ||||||||||||||
| Non-core- acquired 1 |
— | 3,785 | 3,367 | 1,050 | 1,309 | — | 9,511 | |||||||||||||||||||||
| Total |
8,172 | 23,578 | 7,962 | 10,689 | 10,397 | — | 60,798 | |||||||||||||||||||||
| Real estate expenses |
||||||||||||||||||||||||||||
| Core Portfolio |
3,618 | 6,721 | 1,286 | 2,064 | 2,433 | — | 16,122 | |||||||||||||||||||||
| Non-core- acquired 1 |
— | 1,194 | 1,105 | 190 | 348 | — | 2,837 | |||||||||||||||||||||
| Total |
3,618 | 7,915 | 2,391 | 2,254 | 2,781 | — | 18,959 | |||||||||||||||||||||
| Net Operating Income (NOI) |
||||||||||||||||||||||||||||
| Core Portfolio |
4,554 | 13,072 | 3,309 | 7,575 | 6,655 | — | 35,165 | |||||||||||||||||||||
| Non-core- acquired 1 |
— | 2,591 | 2,262 | 860 | 961 | — | 6,674 | |||||||||||||||||||||
| Total |
$ | 4,554 | $ | 15,663 | $ | 5,571 | $ | 8,435 | $ | 7,616 | $ | — | $ | 41,839 | ||||||||||||||
| Core Portfolio NOI GAAP Basis (from above) |
$ | 4,554 | $ | 13,072 | $ | 3,309 | $ | 7,575 | $ | 6,655 | $ | — | $ | 35,165 | ||||||||||||||
| Straight-line revenue, net for core properties |
(7 | ) | (316 | ) | 30 | (457 | ) | 14 | — | (736 | ) | |||||||||||||||||
| FAS 141 Min Rent |
— | (44 | ) | 92 | (60 | ) | 89 | — | 77 | |||||||||||||||||||
| Amortization of lease intangibles for core properties |
— | 4 | — | 3 | 4 | — | 11 | |||||||||||||||||||||
| Core portfolio NOI, Cash Basis |
$ | 4,547 | $ | 12,716 | $ | 3,431 | $ | 7,061 | $ | 6,762 | $ | — | $ | 34,517 | ||||||||||||||
| Reconciliation of NOI to Net Income |
||||||||||||||||||||||||||||
| Total NOI |
$ | 4,554 | $ | 15,663 | $ | 5,571 | $ | 8,435 | $ | 7,616 | $ | — | $ | 41,839 | ||||||||||||||
| Other revenue |
— | — | — | — | — | 1,921 | 1,921 | |||||||||||||||||||||
| Interest expense |
(913 | ) | (749 | ) | (1,154 | ) | (336 | ) | (243 | ) | (10,981 | ) | (14,376 | ) | ||||||||||||||
| Depreciation and amortization |
(1,596 | ) | (6,739 | ) | (2,909 | ) | (1,954 | ) | (3,061 | ) | (119 | ) | (16,378 | ) | ||||||||||||||
| Discontinued Operations2 |
589 | 589 | ||||||||||||||||||||||||||
| General and administrative |
— | — | — | — | — | (2,883 | ) | (2,883 | ) | |||||||||||||||||||
| Net Income |
$ | 2,045 | $ | 8,764 | $ | 1,508 | $ | 6,145 | $ | 4,312 | $ | (12,062 | ) | $ | 10,712 | |||||||||||||
| 1 |
Non-core acquired properties were: |
2007 acquisitions - 270 Technology Park, Monument II and 2440 M Street
2006 acquisitions - Hampton Overlook, Hampton South, Alexandria Professional Center, 9707 Medical Center Dr., 15001 Shady Grove Rd., Plumtree Medical Center, Randolph Shopping Center, Montrose Shopping Center, 9950 Business Parkway, 15005 Shady Grove Road, 6565 Arlington Blvd, West Gude Drive, The Ridges and The Crescent.
| 2 |
Discontinued operations include: Maryland Trade Center I and II |
14
Core Portfolio Net Operating Income (NOI) Detail
(In Thousands)
| Three Months Ended March 31, 2006 | ||||||||||||||||||||||||||||
| Multifamily | Office | Medical Office | Retail | Industrial | Corporate and Other |
Total | ||||||||||||||||||||||
| Real estate rental revenue |
||||||||||||||||||||||||||||
| Core Portfolio |
$ | 7,846 | $ | 18,536 | $ | 4,533 | $ | 8,919 | $ | 9,158 | $ | — | $ | 48,992 | ||||||||||||||
| Non-core- acquired 1 |
— | — | — | — | 228 | — | 228 | |||||||||||||||||||||
| Total |
7,846 | 18,536 | 4,533 | 8,919 | 9,386 | — | 49,220 | |||||||||||||||||||||
| Real estate expenses |
||||||||||||||||||||||||||||
| Core Portfolio |
3,350 | 6,052 | 1,210 | 1,862 | 2,238 | — | 14,712 | |||||||||||||||||||||
| Non-core- acquired 1 |
— | — | — | — | 65 | — | 65 | |||||||||||||||||||||
| Total |
3,350 | 6,052 | 1,210 | 1,862 | 2,303 | — | 14,777 | |||||||||||||||||||||
| Net Operating Income (NOI) |
||||||||||||||||||||||||||||
| Core Portfolio |
4,496 | 12,484 | 3,323 | 7,057 | 6,920 | — | 34,280 | |||||||||||||||||||||
| Non-core- acquired 1 |
— | — | — | — | 163 | — | 163 | |||||||||||||||||||||
| Total |
$ | 4,496 | $ | 12,484 | $ | 3,323 | $ | 7,057 | $ | 7,083 | $ | — | $ | 34,443 | ||||||||||||||
| Core Portfolio NOI GAAP Basis (from above) |
$ | 4,496 | $ | 12,484 | $ | 3,323 | $ | 7,057 | $ | 6,920 | $ | — | $ | 34,280 | ||||||||||||||
| Straight-line revenue, net for core properties |
(2 | ) | (289 | ) | (102 | ) | (155 | ) | (219 | ) | — | (767 | ) | |||||||||||||||
| FAS 141 Min Rent |
— | (44 | ) | 27 | (71 | ) | 95 | — | 7 | |||||||||||||||||||
| Amortization of lease intangibles for core properties |
— | 1 | — | — | 6 | — | 7 | |||||||||||||||||||||
| Core portfolio NOI, Cash Basis |
$ | 4,494 | $ | 12,152 | $ | 3,248 | $ | 6,831 | $ | 6,802 | $ | — | $ | 33,527 | ||||||||||||||
| Reconciliation of NOI to Net Income |
||||||||||||||||||||||||||||
| Total NOI |
$ | 4,496 | $ | 12,484 | $ | 3,323 | $ | 7,057 | $ | 7,083 | $ | — | $ | 34,443 | ||||||||||||||
| Other revenue |
— | — | — | — | — | 170 | 170 | |||||||||||||||||||||
| Interest expense |
(913 | ) | — | (789 | ) | (341 | ) | (499 | ) | (7,780 | ) | (10,322 | ) | |||||||||||||||
| Depreciation and amortization |
(1,534 | ) | (4,804 | ) | (1,248 | ) | (1,289 | ) | (2,542 | ) | (79 | ) | (11,496 | ) | ||||||||||||||
| Discontinued Operations2 |
493 | 493 | ||||||||||||||||||||||||||
| General and administrative |
— | — | — | — | — | (2,656 | ) | (2,656 | ) | |||||||||||||||||||
| Net Income |
$ | 2,049 | $ | 8,173 | $ | 1,286 | $ | 5,427 | $ | 4,042 | $ | (10,345 | ) | $ | 10,632 | |||||||||||||
| 1 |
Non-core acquired properties were: |
2006 acquisitions - Hampton Overlook and Hampton South
| 2 |
Discontinued operations include: Maryland Trade Center I and II |
15
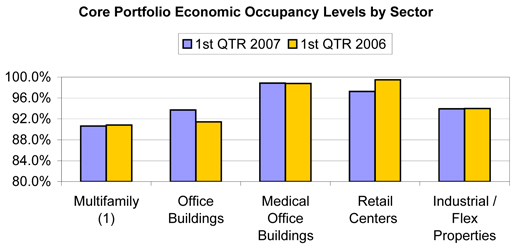
Core Portfolio & Overall Economic Occupancy Levels by Sector
Q1 2007 vs. Q1 2006
GAAP Basis
| Core Portfolio | All Properties | |||||||||||
| Sector |
1st QTR 2007 |
1st QTR 2006 |
1st QTR 2007 |
1st QTR 2006 |
||||||||
| Multifamily (1) |
90.6 | % | 90.8 | % | 90.6 | % | 90.8 | % | ||||
| Office Buildings |
93.7 | % | 91.4 | % | 92.9 | % | 91.1 | % | ||||
| Medical Office Buildings |
98.8 | % | 98.8 | % | 98.9 | % | 98.8 | % | ||||
| Retail Centers |
97.3 | % | 99.5 | % | 94.8 | % | 99.5 | % | ||||
| Industrial / Flex Properties |
93.9 | % | 94.0 | % | 94.2 | % | 93.5 | % | ||||
| Overall Portfolio |
94.2 | % | 93.7 | % | 93.8 | % | 93.4 | % | ||||
| (1) |
Multifamily occupancy level for Q1 ‘07 is 91.3% and 91.7% for Q1 ‘06 without the impact of units off-line for planned renovations. The overall portfolio is 94.4% for Q1 ‘07 and 93.9% for Q1 ‘06 occupied without this impact. |
16
Commercial Leasing Summary
Three months ended 03/31/07
| 1st Quarter 2007 | ||||||||
| Gross Leasing Square Footage |
||||||||
| Office Buildings |
185,062 | |||||||
| Medical Office Buildings |
21,403 | |||||||
| Retail Centers |
73,875 | |||||||
| Industrial Centers |
85,192 | |||||||
| Total |
365,532 | |||||||
| Weighted Average Term (yrs) |
||||||||
| Office Buildings |
4.4 | |||||||
| Medical Office Buildings |
5.8 | |||||||
| Retail Centers |
6.5 | |||||||
| Industrial Centers |
4.4 | |||||||
| Total |
4.9 | |||||||
| GAAP | CASH | |||||||
| Rental Rate Increases: |
||||||||
| Rate on expiring leases |
||||||||
| Office Buildings |
$ | 22.91 | $ | 25.92 | ||||
| Medical Office Buildings |
27.66 | 27.97 | ||||||
| Retail Centers |
16.59 | 16.74 | ||||||
| Industrial Centers |
8.60 | 9.12 | ||||||
| Total |
$ | 18.58 | $ | 20.27 | ||||
| Rate on new and renewal leases |
||||||||
| Office Buildings |
$ | 24.28 | $ | 24.80 | ||||
| Medical Office Buildings |
30.55 | 28.19 | ||||||
| Retail Centers |
19.57 | 18.28 | ||||||
| Industrial Centers |
10.20 | 9.59 | ||||||
| Total |
$ | 20.42 | $ | 20.14 | ||||
| Percentage Increase |
||||||||
| Office Buildings |
5.98 | % | -4.32 | % | ||||
| Medical Office Buildings |
10.45 | % | 0.79 | % | ||||
| Retail Centers |
17.96 | % | 9.20 | % | ||||
| Industrial Centers |
18.60 | % | 5.15 | % | ||||
| Total |
9.90 | % | -0.64 | % | ||||
17
Commercial Leasing Summary
Three months ended 03/31/07
Continued from previous page
| Total Dollars | Dollars per Square Foot | |||||
| Tenant Improvements |
||||||
| Office Buildings |
$ | 2,148,932 | $ | 11.61 | ||
| Medical Office Buildings |
38,536 | 1.80 | ||||
| Retail Centers |
114,875 | 1.55 | ||||
| Industrial Centers |
350,724 | 4.12 | ||||
| Subtotal |
$ | 2,653,067 | $ | 7.26 | ||
| Total Dollars | Dollars per Square Foot | |||||
| Leasing Costs |
||||||
| Office Buildings |
$ | 1,554,090 | $ | 8.40 | ||
| Medical Office Buildings |
19,853 | 0.93 | ||||
| Retail Centers |
452,741 | 6.13 | ||||
| Industrial Centers |
225,744 | 2.65 | ||||
| Subtotal |
$ | 2,252,428 | $ | 6.16 | ||
| Total Dollars | Dollars per Square Foot | |||||
| Tenant Improvements and Leasing Costs |
||||||
| Office Buildings |
$ | 3,703,022 | $ | 20.01 | ||
| Medical Office Buildings |
58,389 | 2.73 | ||||
| Retail Centers |
567,616 | 7.68 | ||||
| Industrial Centers |
576,468 | 6.77 | ||||
| Total |
$ | 4,905,495 | $ | 13.42 | ||
18
10 Largest Tenants - Based on Annualized Rent
March 31, 2007
| Tenant |
Number of Buildings |
Weighted Average Remaining Lease Term in Months |
Percentage of Aggregate Portfolio Annualized Rent |
Aggregate Rentable Square Feet |
Percentage Feet |
|||||||
| World Bank |
1 | 38 | 4.58 | % | 210,354 | 2.15 | % | |||||
| Sunrise Senior Living, Inc. |
1 | 78 | 2.66 | % | 184,202 | 1.89 | % | |||||
| General Services Administration |
8 | 29 | 2.16 | % | 286,434 | 2.93 | % | |||||
| URS Corporation |
1 | 81 | 1.46 | % | 97,208 | 1.00 | % | |||||
| INOVA Health Care Services |
4 | 42 | 1.45 | % | 80,722 | 0.83 | % | |||||
| Lafarge North America, Inc. |
1 | 40 | 1.40 | % | 80,610 | 0.83 | % | |||||
| George Washington University |
2 | 15 | 1.27 | % | 73,915 | 0.76 | % | |||||
| Lockheed Corporation |
3 | 23 | 1.15 | % | 94,693 | 0.97 | % | |||||
| Science Application Int’l Corp. |
2 | 31 | 1.02 | % | 87,541 | 0.90 | % | |||||
| Sun Microsystems, Inc. |
1 | 57 | 0.96 | % | 65,443 | 0.67 | % | |||||
| Total/Weighted Average |
44 | 18.11 | % | 1,261,122 | 12.93 | % | ||||||
19
Industry Diversification
March 31, 2007
| Industry Classification (NAICS) |
Annualized Base Rental Revenue |
Percentage of Aggregate Annualized Rent |
Aggregate Rentable Square Feet |
Percentage of Aggregate Square Feet |
|||||||
| Professional, Scientific and Technical Services |
$ | 46,224,136 | 24.29 | % | 2,113,731 | 21.65 | % | ||||
| Ambulatory Health Care Services |
31,644,846 | 16.63 | % | 1,104,169 | 11.30 | % | |||||
| Credit Intermediation and Related Activities |
15,417,943 | 8.10 | % | 470,864 | 4.82 | % | |||||
| Executive, Legislative & Other General Government Support |
8,157,122 | 4.29 | % | 445,177 | 4.56 | % | |||||
| Nursing and Residential Care Facilities |
5,531,033 | 2.91 | % | 207,460 | 2.12 | % | |||||
| Food Services and Drinking Places |
5,398,215 | 2.84 | % | 223,206 | 2.29 | % | |||||
| Educational Services |
4,687,808 | 2.46 | % | 191,318 | 1.96 | % | |||||
| Religious, Grantmaking, Civic, Professional & Similar Org. |
4,501,718 | 2.37 | % | 157,121 | 1.61 | % | |||||
| Administrative and Support Services |
4,324,842 | 2.27 | % | 267,077 | 2.73 | % | |||||
| Food and Beverage Stores |
4,050,611 | 2.13 | % | 257,333 | 2.63 | % | |||||
| Furniture and Home Furnishing Stores |
3,628,765 | 1.91 | % | 241,382 | 2.47 | % | |||||
| Specialty Trade Contractors |
3,448,297 | 1.81 | % | 416,237 | 4.26 | % | |||||
| Miscellaneous Store Retailers |
3,127,539 | 1.64 | % | 236,814 | 2.42 | % | |||||
| Transportation Equipment Manufacturing |
3,028,911 | 1.59 | % | 163,029 | 1.67 | % | |||||
| Merchant Wholesalers-Durable Goods |
2,876,325 | 1.51 | % | 326,020 | 3.34 | % | |||||
| Personal and Laundry Services |
2,729,845 | 1.43 | % | 127,979 | 1.31 | % | |||||
| Real Estate |
2,520,946 | 1.32 | % | 109,081 | 1.12 | % | |||||
| Clothing & Clothing Accessories Stores |
2,361,908 | 1.24 | % | 148,410 | 1.52 | % | |||||
| Publishing Industries (except Internet) |
2,280,934 | 1.20 | % | 89,994 | 0.92 | % | |||||
| Computer & Electronic Product Manufacturing |
2,242,933 | 1.18 | % | 194,512 | 1.99 | % | |||||
| Insurance Carriers and Related Activities |
1,969,050 | 1.03 | % | 99,714 | 1.02 | % | |||||
| Other |
30,159,081 | 15.85 | % | 2,176,544 | 22.29 | % | |||||
| Total |
$ | 190,312,808 | 100.00 | % | 9,767,172 | 100.00 | % | ||||
20
Lease Expirations
March 31, 2007
| Year |
Number of Leases |
Rentable Square Feet |
Percent of Rentable Square Feet |
Annualized Rent * |
Average Rental Rate |
Percent of Annualized Rent * |
||||||||||
| Office: |
||||||||||||||||
| 2007 |
66 | 267,376 | 7.70 | % | $ | 7,464,508 | $ | 27.92 | 7.86 | % | ||||||
| 2008 |
77 | 338,430 | 9.74 | % | 9,586,343 | 28.33 | 10.09 | % | ||||||||
| 2009 |
113 | 604,406 | 17.40 | % | 16,001,842 | 26.48 | 16.85 | % | ||||||||
| 2010 |
94 | 814,364 | 23.45 | % | 23,569,149 | 28.94 | 24.81 | % | ||||||||
| 2011 |
83 | 458,032 | 13.19 | % | 12,849,907 | 28.05 | 13.53 | % | ||||||||
| 2012 and thereafter |
102 | 990,783 | 28.52 | % | 25,526,585 | 25.76 | 26.86 | % | ||||||||
| 535 | 3,473,391 | 100.00 | % | $ | 94,998,334 | $ | 27.35 | 100.00 | % | |||||||
| Medical Office: |
||||||||||||||||
| 2007 |
22 | 66,431 | 6.93 | % | $ | 1,766,185 | $ | 26.59 | 5.95 | % | ||||||
| 2008 |
34 | 78,139 | 8.15 | % | 2,521,114 | 32.26 | 8.50 | % | ||||||||
| 2009 |
30 | 93,261 | 9.73 | % | 2,781,379 | 29.82 | 9.37 | % | ||||||||
| 2010 |
40 | 166,487 | 17.36 | % | 5,192,788 | 31.19 | 17.50 | % | ||||||||
| 2011 |
44 | 186,276 | 19.43 | % | 5,835,937 | 31.33 | 19.66 | % | ||||||||
| 2012 and thereafter |
92 | 368,220 | 38.40 | % | 11,582,086 | 31.45 | 39.02 | % | ||||||||
| 262 | 958,814 | 100.00 | % | $ | 29,679,489 | $ | 30.95 | 100.00 | % | |||||||
| Retail: |
||||||||||||||||
| 2007 |
45 | 153,887 | 8.19 | % | $ | 3,030,042 | $ | 19.69 | 9.80 | % | ||||||
| 2008 |
39 | 205,198 | 10.92 | % | 2,183,025 | 10.64 | 7.06 | % | ||||||||
| 2009 |
42 | 148,280 | 7.89 | % | 3,203,238 | 21.60 | 10.36 | % | ||||||||
| 2010 |
48 | 292,667 | 15.57 | % | 5,018,832 | 17.15 | 16.23 | % | ||||||||
| 2011 |
24 | 149,813 | 7.97 | % | 2,610,149 | 17.42 | 8.44 | % | ||||||||
| 2012 and thereafter |
93 | 929,967 | 49.46 | % | 14,875,595 | 16.00 | 48.11 | % | ||||||||
| 291 | 1,879,812 | 100.00 | % | $ | 30,920,881 | $ | 16.45 | 100.00 | % | |||||||
| Industrial: |
||||||||||||||||
| 2007 |
44 | 382,624 | 11.07 | % | $ | 4,046,263 | $ | 10.58 | 11.66 | % | ||||||
| 2008 |
66 | 778,293 | 22.53 | % | 7,462,992 | 9.59 | 21.50 | % | ||||||||
| 2009 |
56 | 684,429 | 19.81 | % | 6,940,118 | 10.14 | 19.99 | % | ||||||||
| 2010 |
38 | 283,585 | 8.21 | % | 3,157,659 | 11.13 | 9.10 | % | ||||||||
| 2011 |
33 | 437,612 | 12.67 | % | 3,567,894 | 8.15 | 10.28 | % | ||||||||
| 2012 and thereafter |
48 | 888,612 | 25.71 | % | 9,539,178 | 10.73 | 27.47 | % | ||||||||
| 285 | 3,455,155 | 100.00 | % | $ | 34,714,104 | $ | 10.05 | 100.00 | % | |||||||
| Total: |
||||||||||||||||
| 2007 |
177 | 870,318 | 8.91 | % | $ | 16,306,998 | $ | 18.74 | 8.57 | % | ||||||
| 2008 |
216 | 1,400,060 | 14.33 | % | 21,753,474 | 15.54 | 11.43 | % | ||||||||
| 2009 |
241 | 1,530,376 | 15.67 | % | 28,926,577 | 18.90 | 15.20 | % | ||||||||
| 2010 |
220 | 1,557,103 | 15.94 | % | 36,938,428 | 23.72 | 19.41 | % | ||||||||
| 2011 |
184 | 1,231,733 | 12.61 | % | 24,863,887 | 20.19 | 13.07 | % | ||||||||
| 2012 and thereafter |
335 | 3,177,582 | 32.54 | % | 61,523,444 | 19.36 | 32.32 | % | ||||||||
| 1,373 | 9,767,172 | 100.00 | % | $ | 190,312,808 | $ | 19.48 | 100.00 | % | |||||||
| * | Annualized Rent is as of March 31, 2007 rental revenue (cash basis) multiplied by 12. |
21
2007 Acquisition Summary
as of March 31, 2007
($’s in thousands)
Acquisition Summary
| Acquisition Date |
Square Feet |
Leased Percentage at Acquisition |
March 31, 2007 Leased Percentage |
Investment | |||||||||||
| 270 Technology Park |
Frederick, MD | February 8, 2007 | 157,000 | 97 | % | 97 | % | $ | 26,500 | ||||||
| Monument II |
Herndon, VA | March 1, 2007 | 205,000 | 100 | % | 100 | % | 78,200 | |||||||
| 2440 M Street |
Washington, DC | March 9, 2007 | 110,000 | 96 | % | 96 | % | 50,000 | |||||||
| Total |
472,000 | $ | 154,700 | ||||||||||||
22
2007 Development Summary
as of March 31, 2007
($’s in thousands)
| Property and Location |
Total Rentable Square Feet or # of Units |
Percentage Leased or Committed |
Anticipated Total Cash Cost |
Cash Cost to Date |
Anticipated Construction Completion Date | ||||||||||
| Development | |||||||||||||||
| Bennett Park 1 |
$ | 76,600 | $ | 53,124 | 3 | ||||||||||
| Arlington, VA |
|||||||||||||||
| (High Rise) |
178 units, 1,600 sq ft. retail & 498 parking spaces underground (includes parking for existing office) |
0 | % | 4Q 07 | |||||||||||
| (Mid Rise) |
46 units, 4,300 sq ft. retail |
0 | % | 3Q 07 | |||||||||||
| The Clayborne Apartments 2 |
75 units & 2,600 sq ft. retail |
0 | % | $ | 32,700 | $ | 20,540 | 3 | 3Q 07 | ||||||
| Alexandria, VA |
|||||||||||||||
| Dulles Station 4 Phase I |
179,995 sq ft office |
0 | % | $ | 52,000 | 5 | $ | 35,287 | 3 | 3Q 07 | |||||
| Herndon, VA Phase II |
360,005 sq ft office |
TBD | $ | 22,594 | 3 | TBD | |||||||||
| Total | $ | 161,300 | $ | 131,545 | |||||||||||
| 1 |
Bennett Park, formerly known as Rosslyn Towers, is a planned 224 unit multifamily property. 1620 Wilson Boulevard was acquired in conjunction with the overall development plan for Bennett Park. |
| 2 |
718 E. Jefferson Street was acquired to complete our ownership of the entire block of 800 S. Washington Street. The surface parking lot on this block is in development. We currently refer to this development project as The Clayborne Apartments. |
| 3 |
Includes land cost (Dulles Station Phase II land allocation $16.1M). |
| 4 |
Dulles Station is 5.27 acres acquired in December, 2005. |
| 5 |
Represents total costs associated with Phase I. We will concurrently build a portion of the structured garage, allocated to Phase II, which will cost an additional $7.2M. |
23
WRIT vs.
FTSE NAREIT Equity REITs, MSCI US REIT
& Russell 2000 Indices
12, 36, and 60 Month Total Returns
March 31, 2007
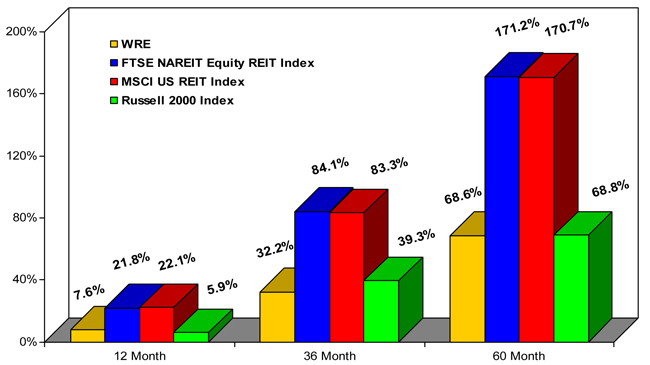
Sources: SNL Interactive and NAREIT
24
Schedule of Properties
March 31, 2007
| PROPERTIES |
LOCATION |
YEAR ACQUIRED |
YEAR CONSTRUCTED |
NET RENTABLE SQUARE FEET | ||||
| Office Buildings |
||||||||
| 1901 Pennsylvania Avenue |
Washington, DC | 1977 | 1960 | 97,000 | ||||
| 51 Monroe Street |
Rockville, MD | 1979 | 1975 | 210,000 | ||||
| 515 King Street |
Alexandria, VA | 1992 | 1966 | 76,000 | ||||
| The Lexington Building |
Rockville, MD | 1993 | 1970 | 46,000 | ||||
| The Saratoga Building |
Rockville, MD | 1993 | 1977 | 58,000 | ||||
| Brandywine Center |
Rockville, MD | 1993 | 1969 | 35,000 | ||||
| 6110 Executive Boulevard |
Rockville, MD | 1995 | 1971 | 198,000 | ||||
| 1220 19th Street |
Washington, DC | 1995 | 1976 | 102,000 | ||||
| Maryland Trade Center I |
Greenbelt, MD | 1996 | 1981 | 184,000 | ||||
| Maryland Trade Center II |
Greenbelt, MD | 1996 | 1984 | 158,000 | ||||
| 1600 Wilson Boulevard |
Arlington, VA | 1997 | 1973 | 166,000 | ||||
| 7900 Westpark Drive |
McLean, VA | 1997 | 1972/1986/19991 | 523,000 | ||||
| 600 Jefferson Plaza |
Rockville, MD | 1999 | 1985 | 112,000 | ||||
| 1700 Research Boulevard |
Rockville, MD | 1999 | 1982 | 101,000 | ||||
| Parklawn Plaza |
Rockville, MD | 1999 | 1986 | 40,000 | ||||
| Wayne Plaza |
Silver Spring, MD | 2000 | 1970 | 91,000 | ||||
| Courthouse Square |
Alexandria, VA | 2000 | 1979 | 113,000 | ||||
| One Central Plaza |
Rockville, MD | 2001 | 1974 | 267,000 | ||||
| The Atrium Building |
Rockville, MD | 2002 | 1980 | 80,000 | ||||
| 1776 G Street |
Washington, DC | 2003 | 1979 | 263,000 | ||||
| Albemarle Point |
Chantilly, VA | 2005 | 2001 | 89,000 | ||||
| 6565 Arlington Blvd |
Falls Church, VA | 2006 | 1967/1998 | 140,000 | ||||
| West Gude Drive |
Rockville, MD | 2006 | 1984/1986/1988 | 289,000 | ||||
| The Ridges |
Gaithersburg, MD | 2006 | 1990 | 104,000 | ||||
| Monument II |
Herndon, VA | 2007 | 2000 | 205,000 | ||||
| Subtotal |
3,747,000 | |||||||
| Medical Office Buildings |
||||||||
| Woodburn Medical Park I |
Annandale, VA | 1998 | 1984 | 71,000 | ||||
| Woodburn Medical Park II |
Annandale, VA | 1998 | 1988 | 96,000 | ||||
| Prosperity Medical Center I |
Merrifield, VA | 2003 | 2000 | 92,000 | ||||
| Prosperity Medical Center II |
Merrifield, VA | 2003 | 2001 | 88,000 | ||||
| Prosperity Medical Center III |
Merrifield, VA | 2003 | 2002 | 75,000 | ||||
| Shady Grove Medical Village II |
Rockville, MD | 2004 | 1999 | 66,000 | ||||
| 8301 Arlington Boulevard |
Fairfax, VA | 2004 | 1965 | 49,000 | ||||
| Alexandria Professional Center |
Alexandria, VA | 2006 | 1968 | 113,000 | ||||
| 9707 Medical Center Drive |
Rockville, MD | 2006 | 1994 | 38,000 | ||||
| 15001 Shady Grove Road |
Rockville, MD | 2006 | 1999 | 51,000 | ||||
| Plumtree Medical Center |
Bel Air, MD | 2006 | 1991 | 33,000 | ||||
| 15005 Shady Grove Road |
Rockville, MD | 2006 | 2002 | 52,000 | ||||
| The Crescent |
Gaithersburg, MD | 2006 | 1989 | 49,000 | ||||
| 2440 M Street |
Washington, DC | 2007 | 1986/2006 | 110,000 | ||||
| Subtotal |
983,000 | |||||||
| Retail Centers |
||||||||
| Takoma Park |
Takoma Park, MD | 1963 | 1962 | 51,000 | ||||
| Westminster |
Westminster, MD | 1972 | 1969 | 151,000 | ||||
| Concord Centre |
Springfield, VA | 1973 | 1960 | 76,000 | ||||
| Wheaton Park |
Wheaton, MD | 1977 | 1967 | 72,000 | ||||
| Bradlee |
Alexandria, VA | 1984 | 1955 | 168,000 | ||||
| Chevy Chase Metro Plaza |
Washington, DC | 1985 | 1975 | 49,000 | ||||
| Montgomery Village Center |
Gaithersburg, MD | 1992 | 1969 | 198,000 | ||||
| Shoppes of Foxchase |
Alexandria, VA | 1994 | 1960 | 134,000 | ||||
| Frederick County Square |
Frederick, MD | 1995 | 1973 | 227,000 | ||||
| 800 S. Washington Street2 |
Alexandria, VA | 1998/2003 | 1955/1959 | 44,000 | ||||
| Centre at Hagerstown |
Hagerstown, MD | 2002 | 2000 | 332,000 | ||||
| Frederick Crossing |
Frederick, MD | 2005 | 1999/2003 | 295,000 | ||||
| Randolph Shopping Center |
Rockville, MD | 2006 | 1972 | 82,000 | ||||
| Montrose Shopping Center |
Rockville, MD | 2006 | 1970 | 143,000 | ||||
| Subtotal |
2,022,000 | |||||||
| 1 |
A 49,000 square foot addition to 7900 Westpark Drive was completed in September 1999. |
| 2 |
South Washington Street includes 718 Jefferson Street, acquired in May 2003 to complete the ownership of the entire block of 800 S. Washington Street. See Development Summary on page 23. |
25
Schedule of Properties (Cont.)
March 31, 2007
| PROPERTIES |
LOCATION |
YEAR ACQUIRED |
YEAR CONSTRUCTED |
NET RENTABLE* SQUARE FEET | ||||
| Multifamily Buildings * / # units |
||||||||
| 3801 Connecticut Avenue / 307 |
Washington, DC | 1963 | 1951 | 179,000 | ||||
| Roosevelt Towers / 190 |
Falls Church, VA | 1965 | 1964 | 170,000 | ||||
| Country Club Towers / 227 |
Arlington, VA | 1969 | 1965 | 163,000 | ||||
| Park Adams / 200 |
Arlington, VA | 1969 | 1959 | 173,000 | ||||
| Munson Hill Towers / 279 |
Falls Church, VA | 1970 | 1963 | 259,000 | ||||
| The Ashby at McLean / 250 |
McLean, VA | 1996 | 1982 | 252,000 | ||||
| Walker House Apartments / 212 |
Gaithersburg, MD | 1996 | 1971/20034 | 159,000 | ||||
| Bethesda Hill Apartments / 194 |
Bethesda, MD | 1997 | 1986 | 226,000 | ||||
| Avondale / 236 |
Laurel, MD | 1999 | 1987 | 170,000 | ||||
| Subtotal (2,095 units) |
1,751,000 | |||||||
| Industrial Distribution / Flex Properties |
||||||||
| Fullerton Business Center |
Springfield, VA | 1985 | 1980 | 104,000 | ||||
| Charleston Business Center |
Rockville, MD | 1993 | 1973 | 85,000 | ||||
| Tech 100 Industrial Park |
Elkridge, MD | 1995 | 1990 | 166,000 | ||||
| Crossroads Distribution Center |
Elkridge, MD | 1995 | 1987 | 85,000 | ||||
| The Alban Business Center |
Springfield, VA | 1996 | 1981/1982 | 87,000 | ||||
| The Earhart Building |
Chantilly, VA | 1996 | 1987 | 92,000 | ||||
| Ammendale Technology Park I |
Beltsville, MD | 1997 | 1985 | 167,000 | ||||
| Ammendale Technology Park II |
Beltsville, MD | 1997 | 1986 | 107,000 | ||||
| Pickett Industrial Park |
Alexandria, VA | 1997 | 1973 | 246,000 | ||||
| Northern Virginia Industrial Park |
Lorton, VA | 1998 | 1968/1991 | 787,000 | ||||
| 8900 Telegraph Road |
Lorton, VA | 1998 | 1985 | 32,000 | ||||
| Dulles South IV |
Chantilly, VA | 1999 | 1988 | 83,000 | ||||
| Sully Square |
Chantilly, VA | 1999 | 1986 | 95,000 | ||||
| Amvax |
Beltsville, MD | 1999 | 1986 | 31,000 | ||||
| Sullyfield Center |
Chantilly, VA | 2001 | 1985 | 244,000 | ||||
| Fullerton Industrial Center |
Springfield, VA | 2003 | 1980 | 137,000 | ||||
| 8880 Gorman Road |
Laurel, MD | 2004 | 2000 | 141,000 | ||||
| Dulles Business Park Portfolio |
Chantilly, VA | 2004/2005 | 1999-2005 | 324,000 | ||||
| Albemarle Point |
Chantilly, VA | 2005 | 2001/2003/2005 | 207,000 | ||||
| Hampton Overlook |
Capital Heights, MD | 2006 | 1989 | 134,000 | ||||
| Hampton South |
Capital Heights, MD | 2006 | 1989/2005 | 168,000 | ||||
| 9950 Business Parkway |
Lanham, MD | 2006 | 2005 | 102,000 | ||||
| 270 Technology Park |
Frederick, MD | 2007 | 1986-1987 | 157,000 | ||||
| Subtotal |
3,781,000 | |||||||
| TOTAL |
12,284,000 | |||||||
| * | Multifamily buildings are presented in gross square feet. |
| 4 |
A 16 unit addition referred to as The Gardens at Walker House was completed in October 2003. |
26
Supplemental Definitions
March 31, 2007
Annualized base rent (ABR) is calculated as monthly base rent (cash basis) per the lease, as of the reporting period, multiplied by 12.
Debt to total market capitalization is total debt from the balance sheet divided by the sum of total debt from the balance sheet plus the market value of shares outstanding at the end of the period.
EBITDA (a non-GAAP measure) is earnings before interest, taxes, depreciation and amortization.
Ratio of earnings to fixed charges is computed by dividing earnings by fixed charges. For this purpose, earnings consist of income from continuing operations (or net income if there are no discontinued operations) plus fixed charges, less capitalized interest. Fixed charges consist of interest expense, including amortized costs of debt issuance, plus interest costs capitalized.
Debt service coverage ratio is computed by dividing earnings before interest income and expense, depreciation, amortization and gain on sale of real estate by interest expense and principal amortization.
Funds from operations (FFO) - The National Association of Real Estate Investment Trusts, Inc. (NAREIT) defines FFO (April, 2002 White Paper) as net income (computed in accordance with generally accepted accounting principles (GAAP)) excluding gains (or losses) from sales of property plus real estate depreciation and amortization. FFO is a non-GAAP measure.
Funds Available for Distribution (FAD), a non-GAAP measure, is calculated by subtracting from FFO recurring expenditures, tenant improvements and leasing costs, that are capitalized and amortized and are necessary to maintain our properties and revenue stream and straight line rents, then adding non-real estate depreciation and amortization and adding or subtracting amortization of lease intangibles, as appropriate.
Recurring capital expenditures represents non-accretive building improvements and leasing costs required to maintain current revenues. Recurring capital expenditures do not include acquisition capital that was taken into consideration when underwriting the purchase of a building or which are incurred to bring a building up to “operating standard.”
Rent increases on renewals and rollovers are calculated as the difference, weighted by square feet, of the net ABR due the first month after a term commencement date and the net ABR due the last month prior to the termination date of the former tenant’s term.
Core portfolio properties include all properties that were owned for the entirety of the current and prior year reporting periods.
Core portfolio net operating income (NOI) growth is the change in the NOI of the core portfolio properties from the prior reporting period to the current reporting period.
27