
Exhibit 99.2
Second Quarter 2008
Supplemental Operating and Financial Data
for the Quarter Ending June 30, 2008
| Contact:
Sara Grootwassink
Executive Vice President and
Chief Financial Officer
E-mail: sgrootwassink@writ.com |
6110 Executive Boulevard
Suite 800
Rockville, MD 20852
(301) 984-9400
(301) 984-9610 fax |
Company Background and Highlights
Second Quarter 2008
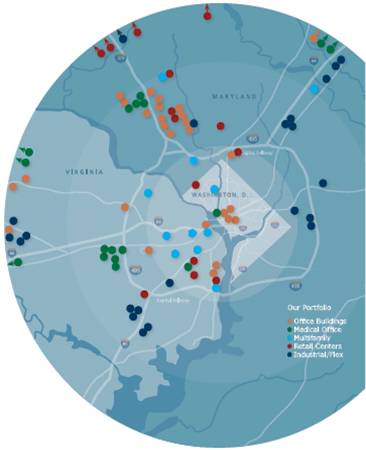
Washington Real Estate Investment Trust (the “Company”) is a self-administered, self-managed, equity real estate investment trust (REIT) investing in income-producing properties in the greater Washington metropolitan region. WRIT is diversified, as it invests in multifamily, retail, industrial/flex, office, and medical office properties.
During second quarter 2008, WRIT focused on improving its portfolio through acquisitions and dispositions, while maintaining its strong balance sheet. This quarter, WRIT acquired a medical office building for a $6.5 million and entered into a purchase agreement to acquire a D.C. office building for $182 million, and disposed of two flex properties for a net book gain of $15.3 million. Also this quarter, WRIT issued $90.5 million of equity and refinanced $81 million of short-term debt with long-term debt at a rate of 5.71% and an 8-year maturity. WRIT’s Board of Trustees appointed Wendelin (Wendy) A. White, Esq. and Terence C. Golden to serve as trustees. WRIT also increased its dividend for the 38th consecutive year. Earlier this year, WRIT increased its borrowing capacity on its unsecured credit facilities to $337 million and refinanced its only debt maturity during 2008.
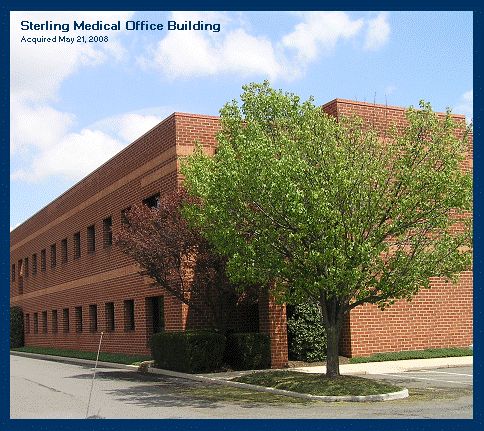
On May 21, 2008, WRIT acquired Sterling Medical Office Building, a 36,000 square foot medical office building located in Sterling, Virginia for $6.5 million. Demand for medical office space in the area is driven by its proximity to Inova Loudoun Hospital and Reston Hospital Center. WRIT expects to achieve a first-year, unleveraged yield of 7.6% on a cash basis and 7.9% on a GAAP basis. The acquisition was funded with cash from operations.
On June 16, 2008, WRIT entered into a purchase agreement to acquire 2445 M Street, a 290,000 square foot office building located in Washington, DC, for approximately $182 million. The property is 100% leased and strategically positioned between Georgetown and the Central Business District in the West End submarket of Washington, DC. WRIT anticipates the closing of the acquisition will take place no later than the fourth quarter of 2008.
On June 6, 2008, WRIT completed the sale of Sullyfield Commerce Center and The Earhart Building, totaling 336,000 square feet for $41.1 million. The industrial/flex properties, located in Chantilly, VA, were acquired in 2001 and 1996, respectively. WRIT achieved a net book gain of $15.3 million on the sale of the properties and a combined 13.0% unlevered internal rate of return during ownership. Proceeds from the sale will be reinvested in a 1031 exchange.
During the last year, WRIT completed several ground-up development projects. In third quarter 2007, WRIT completed base construction on Dulles Station, a 180,000 square foot development project of Class A office space located in Herndon, VA. The building, prominently visible from the Dulles Toll Road, is part of a larger mixed-use development which will include 1,095 multifamily units and 56,000 square feet of retail and restaurant space.
In fourth quarter 2007, WRIT completed construction at Bennett Park. Bennett Park is a ground-up development project in Arlington, VA consisting of high-rise and mid-rise Class A apartment buildings with a total of 224 units and 5,800 square feet of retail space. The property was 55% leased at quarter-end.
In first quarter 2008, WRIT began delivering units at The Clayborne Apartments. The Clayborne is a ground-up development project in Alexandria, VA, adjacent to our 800 South Washington retail property. The project consists of a 74-unit Class A apartment building that will include 2,700 square feet of additional retail space. The property was 36% leased at quarter-end.
1
On May 23, 2008, WRIT raised $90.5 million by issuing 2.6 million common shares at a price of $34.80 per share. WRIT used the net proceeds from the offering to repay borrowings under its lines of credit. On May 29, 2008, WRIT entered into three mortgage loans with an aggregate principal amount of approximately $81 million. The mortgage loans bear interest at a fixed rate of 5.71% per annum through the maturity date of May 31, 2016. WRIT used the net proceeds of the mortgage loans to repay borrowings under its lines of credit. On June 30, 2008, WRIT increased its quarterly dividend 2.4% to $0.4325 per share for its 186th consecutive quarterly dividend at equal or increasing rates.
On May 15, 2008, WRIT announced the Board of Trustees appointed Wendelin (Wendy) A. White, Esq. and Terence C. Golden to serve as trustees. Both trustees have many years experience in real estate and investments. Wendy White is a partner and serves on the Managing Board at Pillsbury Winthrop Shaw Pittman LLP, where she is the head of the firm’s DC real estate group and has practiced law since 1981. Terence Golden has been Chairman of Bailey Capital Corporation, a private investment company in Washington, D.C. since 2000. Prior to 2000, Mr. Golden was President, Chief Executive Officer and a director of Host Marriott Corporation. He also served as the head of the General Services Administration (GSA) from 1985 to 1988 and as Assistant Secretary of the U.S. Department of the Treasury from 1984 to 1985.
WRIT is a self-administered, self-managed, equity real estate investment trust investing in income-producing properties in the greater Washington metro region. WRIT’s dividends have increased every year for 38 consecutive years. WRIT’s FFO per share has increased every year for 35 consecutive years. WRIT owns a diversified portfolio of 90 properties consisting of 14 retail centers, 26 office properties, 17 medical office properties, 22 industrial/flex properties, 11 multi-family properties and land for development. WRIT shares are publicly traded on the New York Stock Exchange (NYSE:WRE).
2
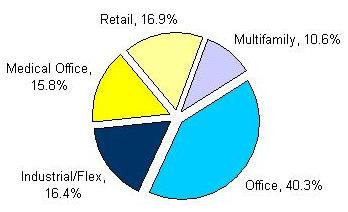
Net Operating Income Contribution by Sector—Second Quarter 2008
With investments in the multifamily, retail, industrial/flex, office and medical office segments, WRIT is uniquely diversified. This balanced portfolio provides stability during market fluctuations in specific property types.
Second Quarter 2008 Acquisition and Purchase Agreement
| Acquired: Sterling Medical Office Building Sterling, VA |
Under Purchase Agreement: 2445 M Street, NW Washington, DC | |
 |
 | |
Certain statements in this press release and the supplemental disclosures attached hereto are “forward-looking statements” within the meaning of the Private Securities Litigation Reform Act of 1995. Such statements involve known and unknown risks, uncertainties and other factors that may cause actual results to differ materially. Such risks, uncertainties and other factors include, but are not limited to, fluctuations in interest rates, availability of raw materials and labor costs, levels of competition, the effect of government regulation, the availability of capital, weather conditions, the timing and pricing of lease transactions and changes in general and local economic and real estate market conditions, and other risks and uncertainties detailed from time to time in our filings with the SEC, including our 2007 Form 10-K. We assume no obligation to update or supplement forward-looking statements that become untrue because of subsequent events.
3
Supplemental Financial and Operating Data
June 30, 2008
| Schedule |
Page | |
| Key Financial Data | ||
| 5 | ||
| 6 | ||
| 7 | ||
| Earnings Before Interest Taxes Depreciation and Amortization (EBITDA) |
8 | |
| Capital Analysis | ||
| 9-10 | ||
| 11 | ||
| Portfolio Analysis | ||
| Core Portfolio Net Operating Income (NOI) Growth & Rental Rate Growth |
12 | |
| 13 | ||
| Core Portfolio Net Operating Income (NOI) Detail for the Quarter |
14-15 | |
| Core Portfolio & Overall Economic Occupancy Levels by Sector |
16 | |
| Tenant Analysis | ||
| 17-18 | ||
| 19 | ||
| 20 | ||
| 21 | ||
| Growth and Strategy | ||
| 22 | ||
| Appendix | ||
| 23-24 | ||
| 25 | ||
Certain statements discussed in this Supplemental regarding anticipated operating results and future events are forward-looking statements within the meaning of the Private Securities Litigation Reform Act of 1995. Although such statements and projections are based upon what we believe to be reasonable assumptions, actual results may differ from those projected. Key factors that could cause actual results to differ materially include changes in the economy, the successful and timely completion of acquisitions, changes in interest rates, leasing activities and other risks associated with the commercial real estate business and as detailed in our filings from time to time with the Securities and Exchange Commission.
4
Consolidated Statements of Operations
(In thousands, except per share data)
(unaudited)
| Three Months Ended | ||||||||||||||||||||
| 06/30/08 | 03/31/08 | 12/31/07 | 09/30/07 | 06/30/07 | ||||||||||||||||
| OPERATING RESULTS |
||||||||||||||||||||
| Real estate rental revenue |
$ | 69,768 | $ | 70,278 | $ | 67,528 | $ | 65,020 | $ | 63,255 | ||||||||||
| Real estate expenses |
(22,803 | ) | (23,133 | ) | (21,271 | ) | (20,395 | ) | (19,542 | ) | ||||||||||
| 46,965 | 47,145 | 46,257 | 44,625 | 43,713 | ||||||||||||||||
| Real estate depreciation and amortization |
(21,198 | ) | (20,525 | ) | (18,998 | ) | (18,019 | ) | (16,632 | ) | ||||||||||
| Income from real estate |
25,767 | 26,620 | 27,259 | 26,606 | 27,081 | |||||||||||||||
| Other income |
220 | 238 | 480 | 357 | 420 | |||||||||||||||
| Other income from life insurance proceeds |
— | — | — | — | — | |||||||||||||||
| Loss on extinguishment of debt |
— | (8,449 | ) | — | — | — | ||||||||||||||
| Interest expense |
(17,582 | ) | (17,664 | ) | (16,400 | ) | (15,824 | ) | (15,298 | ) | ||||||||||
| General and administrative |
(3,111 | ) | (3,080 | ) | (3,675 | ) | (3,174 | ) | (5,367 | ) | ||||||||||
| Income (loss) from continuing operations |
5,294 | (2,335 | ) | 7,664 | 7,965 | 6,836 | ||||||||||||||
| Discontinued operations: |
||||||||||||||||||||
| Income from operations of properties held for sale |
639 | 847 | 778 | 1,403 | 1,501 | |||||||||||||||
| Gain on sale of real estate investment |
15,275 | — | — | 25,022 | — | |||||||||||||||
| Income from discontinued operations |
15,914 | 847 | 778 | 26,425 | 1,501 | |||||||||||||||
| Net Income (loss) |
$ | 21,208 | $ | (1,488 | ) | $ | 8,442 | $ | 34,390 | $ | 8,337 | |||||||||
| Per Share Data |
||||||||||||||||||||
| Net Income |
$ | 0.44 | $ | (0.03 | ) | $ | 0.18 | $ | 0.73 | $ | 0.18 | |||||||||
| Fully diluted weighted average shares outstanding |
48,148 | 46,819 | 46,822 | 46,802 | 45,658 | |||||||||||||||
| Percentage of Revenues: |
||||||||||||||||||||
| Real estate expenses |
32.7 | % | 32.9 | % | 31.5 | % | 31.4 | % | 30.9 | % | ||||||||||
| General and administrative |
4.5 | % | 4.4 | % | 5.4 | % | 4.9 | % | 8.5 | % | ||||||||||
| Ratios: |
||||||||||||||||||||
| EBITDA / Interest expense |
2.5 | x | 2.1 | x(1) | 2.7 | x | 2.7 | x | 2.6 | x | ||||||||||
| Income from continuing operations/Total real estate revenue |
7.6 | % | -3.3 | %(1) | 11.3 | % | 12.3 | % | 10.8 | % | ||||||||||
| Net income/Total real estate revenue |
30.4 | % | -2.1 | %(1) | 12.5 | % | 52.9 | % | 13.2 | % | ||||||||||
Note: Certain prior quarter amounts have been reclassified to conform to the current quarter presentation.
| (1) |
Includes the impact of the loss on extinguishment of debt of $8.4 million in the first quarter of 2008 |
5
(In thousands)
(unaudited)
| June 30, 2008 |
March 31, 2008 |
December 31, 2007 |
September 30, 2007 |
June 30, 2007 |
||||||||||||||||
| Assets |
||||||||||||||||||||
| Land |
$ | 337,680 | $ | 336,710 | $ | 328,951 | $ | 334,484 | $ | 322,733 | ||||||||||
| Income producing property |
1,693,384 | 1,674,319 | 1,635,169 | 1,496,731 | 1,448,874 | |||||||||||||||
| 2,031,064 | 2,011,029 | 1,964,120 | 1,831,215 | 1,771,607 | ||||||||||||||||
| Accumulated depreciation and amortization |
(368,200 | ) | (349,926 | ) | (331,991 | ) | (315,444 | ) | (299,494 | ) | ||||||||||
| Net income producing property |
1,662,864 | 1,661,103 | 1,632,129 | 1,515,771 | 1,472,113 | |||||||||||||||
| Development in progress, including land held for development |
58,760 | 58,784 | 98,321 | 138,093 | 151,393 | |||||||||||||||
| Total real estate held for investment, net |
1,721,624 | 1,719,887 | 1,730,450 | 1,653,864 | 1,623,506 | |||||||||||||||
| Investment in real estate held for sale, net |
— | 23,614 | 23,843 | 23,382 | 52,907 | |||||||||||||||
| Cash and cash equivalents |
12,724 | 12,858 | 21,488 | 9,919 | 8,133 | |||||||||||||||
| Restricted cash |
48,868 | 7,637 | 6,030 | 46,002 | 6,835 | |||||||||||||||
| Rents and other receivables, net of allowance for doubtful accounts |
37,096 | 39,008 | 36,595 | 34,520 | 34,359 | |||||||||||||||
| Prepaid expenses and other assets |
85,129 | 87,515 | 78,517 | 76,689 | 68,179 | |||||||||||||||
| Other assets related to properties sold or held for sale |
— | 1,679 | 1,403 | 1,425 | 3,276 | |||||||||||||||
| Total Assets |
$ | 1,905,441 | $ | 1,892,198 | $ | 1,898,326 | $ | 1,845,801 | $ | 1,797,195 | ||||||||||
| Liabilities and Shareholders’ Equity |
||||||||||||||||||||
| Notes payable |
$ | 918,834 | $ | 918,783 | $ | 879,123 | $ | 879,094 | $ | 879,064 | ||||||||||
| Mortgage notes payable |
331,575 | 251,539 | 252,484 | 253,500 | 254,324 | |||||||||||||||
| Lines of credit/short-term note payable |
15,000 | 174,500 | 192,500 | 128,500 | 95,500 | |||||||||||||||
| Accounts payable and other liabilities |
59,193 | 57,590 | 63,543 | 65,228 | 66,223 | |||||||||||||||
| Advance rents |
8,793 | 9,383 | 9,552 | 6,424 | 6,544 | |||||||||||||||
| Tenant security deposits |
10,436 | 10,462 | 10,487 | 9,961 | 10,262 | |||||||||||||||
| Other liabilities related to properties sold or held for sale |
— | 417 | 317 | 358 | 1,360 | |||||||||||||||
| Total Liabilities |
1,343,831 | 1,422,674 | 1,408,006 | 1,343,065 | 1,313,277 | |||||||||||||||
| Minority interest |
3,791 | 3,786 | 3,776 | 5,593 | 1,776 | |||||||||||||||
| Shareholders’ Equity |
||||||||||||||||||||
| Shares of beneficial interest, $0.01 par value; 100,000 shares authorized |
496 | 468 | 468 | 467 | 467 | |||||||||||||||
| Additional paid-in capital |
653,816 | 563,174 | 561,492 | 560,695 | 560,276 | |||||||||||||||
| Distributions in excess of net income |
(96,873 | ) | (96,660 | ) | (75,416 | ) | (64,019 | ) | (78,601 | ) | ||||||||||
| Accumulated other comprehensive income (loss) |
380 | (1,244 | ) | — | — | — | ||||||||||||||
| Total Shareholders’ Equity |
557,819 | 465,738 | 486,544 | 497,143 | 482,142 | |||||||||||||||
| Total Liabilities and Shareholders’ Equity |
$ | 1,905,441 | $ | 1,892,198 | $ | 1,898,326 | $ | 1,845,801 | $ | 1,797,195 | ||||||||||
| Total Debt / Total Market Capitalization |
0.46:1 | 0.46:1 | 0.47:1 | 0.44:1 | 0.44:1 | |||||||||||||||
Note: Certain prior quarter amounts have been reclassified to conform to the current quarter presentation.
6
Funds From Operations and Funds Available for Distribution
(In thousands, except per share data)
(unaudited)
| Three Months Ended | ||||||||||||||||||||
| 6/30/2008 | 3/31/2008 | 12/31/2007 | 9/30/2007 | 6/30/2007 | ||||||||||||||||
| Funds From Operations(1) |
||||||||||||||||||||
| Net Income (loss) |
$ | 21,208 | $ | (1,488 | ) | $ | 8,442 | $ | 34,390 | $ | 8,337 | |||||||||
| Real estate depreciation and amortization |
21,198 | 20,525 | 18,998 | 18,019 | 16,632 | |||||||||||||||
| Other income from life insurance proceeds |
— | — | — | — | — | |||||||||||||||
| Discontinued operations: |
||||||||||||||||||||
| Gain on sale |
(15,275 | ) | (25,022 | ) | — | |||||||||||||||
| Real estate depreciation and amortization |
— | — | 87 | 266 | 248 | |||||||||||||||
| Funds From Operations (FFO) |
$ | 27,131 | $ | 19,037 | $ | 27,527 | $ | 27,653 | $ | 25,217 | ||||||||||
| FFO per share - basic |
$ | 0.57 | $ | 0.41 | $ | 0.59 | $ | 0.59 | $ | 0.55 | ||||||||||
| FFO per share - fully diluted |
$ | 0.56 | $ | 0.41 | $ | 0.59 | $ | 0.59 | $ | 0.55 | ||||||||||
| FFO per share - fully diluted, excluding loss on extinguishment of debt |
$ | 0.56 | $ | 0.59 | $ | 0.59 | $ | 0.59 | $ | 0.55 | ||||||||||
| Funds Available for Distribution(2) |
||||||||||||||||||||
| Tenant Improvements |
(5,029 | ) | (2,110 | ) | (5,026 | ) | (4,215 | ) | (5,185 | ) | ||||||||||
| External and Internal Leasing Commissions Capitalized |
(1,429 | ) | (2,023 | ) | (1,613 | ) | (1,159 | ) | (1,165 | ) | ||||||||||
| Recurring Capital Improvements |
(3,052 | ) | (2,116 | ) | (3,899 | ) | (2,635 | ) | (3,425 | ) | ||||||||||
| Straight-Line Rent, Net |
(712 | ) | (744 | ) | (957 | ) | (988 | ) | (1,088 | ) | ||||||||||
| Non-real estate depreciation and amortization |
987 | 1,000 | 1,011 | 987 | 824 | |||||||||||||||
| Amortization of lease intangibles, net |
(537 | ) | (506 | ) | (191 | ) | (315 | ) | (280 | ) | ||||||||||
| Amortization and expensing of restricted share and unit compensation |
716 | 699 | 850 | 882 | 1,574 | |||||||||||||||
| Other |
— | — | — | 102 | 1,201 | |||||||||||||||
| Funds Available for Distribution (FAD) |
$ | 18,075 | $ | 13,237 | $ | 17,702 | $ | 20,312 | $ | 17,673 | ||||||||||
| Total Dividends Paid |
$ | 21,376 | $ | 19,724 | $ | 19,723 | $ | 19,716 | $ | 19,716 | ||||||||||
| Average shares - basic |
47,933 | 46,623 | 46,604 | 46,596 | 45,490 | |||||||||||||||
| Average shares - fully diluted |
48,148 | 46,819 | 46,822 | 46,802 | 45,658 | |||||||||||||||
| (1) |
Funds From Operations (“FFO”) – The National Association of Real Estate Investment Trusts, Inc. (“NAREIT”) defines FFO (April, 2002 White Paper) as net income (computed in accordance with generally accepted accounting principles (“GAAP”)) excluding gains (or losses) from sales of property plus real estate depreciation and amortization. We consider FFO to be a standard supplemental measure for equity real estate investment trusts (“REITs”) because it facilitates an understanding of the operating performance of our properties without giving effect to real estate depreciation and amortization, which historically assumes that the value of real estate assets diminishes predictably over time. Since real estate values have instead historically risen or fallen with market conditions, we believe that FFO more accurately provides investors an indication of our ability to incur and service debt, make capital expenditures and fund other needs. FFO is a non-GAAP measure. |
| (2) |
Funds Available for Distribution (“FAD”) is calculated by subtracting from FFO (1) recurring expenditures, tenant improvements and leasing costs, that are capitalized and amortized and are necessary to maintain our properties and revenue stream and (2) straight line rents, then adding (3) non-real estate depreciation and amortization and adding or subtracting the amortization of lease intangibles as appropriate. FAD is included herein, because we consider it to be a measure of a REIT’s ability to incur and service debt and to distribute dividends to its shareholders. FAD is a non-GAAP and non-standardized measure, and may be calculated differently by other REITs. |
7
Earnings Before Interest Taxes Depreciation and Amortization (EBITDA)
(In thousands)
(unaudited)
| Three Months Ended | ||||||||||||||||||||
| 06/30/08 | 03/31/08 | 12/31/07 | 09/30/07 | 06/30/07 | ||||||||||||||||
| EBITDA(1) |
||||||||||||||||||||
| Net income (loss) |
$ | 21,208 | $ | (1,488 | ) | $ | 8,442 | $ | 34,390 | $ | 8,337 | |||||||||
| Add: |
||||||||||||||||||||
| Interest expense |
17,582 | 17,664 | 16,400 | 15,824 | 15,298 | |||||||||||||||
| Real estate depreciation and amortization |
21,198 | 20,525 | 19,085 | 18,285 | 16,880 | |||||||||||||||
| Non-real estate depreciation |
285 | 276 | 277 | 261 | 202 | |||||||||||||||
| Less: |
||||||||||||||||||||
| Gain on sale of real estate |
(15,275 | ) | (25,022 | ) | — | |||||||||||||||
| Other income |
(220 | ) | (238 | ) | (480 | ) | (357 | ) | (420 | ) | ||||||||||
| EBITDA |
$ | 44,778 | $ | 36,739 | $ | 43,724 | $ | 43,381 | $ | 40,297 | ||||||||||
| (1) |
EBITDA is earnings before interest, taxes, depreciation and amortization. We consider EBITDA to be an appropriate supplemental performance measure because it eliminates depreciation, interest and the gain (loss) from property dispositions, which permits investors to view income from operations without the effect of non-cash depreciation or the cost of debt. EBITDA is a non-GAAP measure. |
8
(In thousands, except per share amounts)
| June 30, 2008 |
March 31, 2008 |
December 31, 2007 |
September 30, 2007 |
June 30, 2007 |
||||||||||||||||
| Balances Outstanding |
||||||||||||||||||||
| Secured |
||||||||||||||||||||
| Conventional fixed rate |
$ | 331,575 | $ | 251,539 | $ | 252,484 | $ | 253,500 | $ | 254,323 | ||||||||||
| Secured total |
331,575 | 251,539 | 252,484 | 253,500 | 254,323 | |||||||||||||||
| Unsecured |
||||||||||||||||||||
| Fixed rate bonds and notes |
918,834 | 918,783 | 879,123 | 879,094 | 879,064 | |||||||||||||||
| Credit facility |
15,000 | 174,500 | 192,500 | 128,500 | 95,500 | |||||||||||||||
| Unsecured total |
933,834 | 1,093,283 | 1,071,623 | 1,007,594 | 974,564 | |||||||||||||||
| Total |
$ | 1,265,409 | $ | 1,344,822 | $ | 1,324,107 | $ | 1,261,094 | $ | 1,228,887 | ||||||||||
| Average Interest Rates |
||||||||||||||||||||
| Secured |
||||||||||||||||||||
| Conventional fixed rate |
5.8 | % | 5.8 | % | 5.8 | % | 5.8 | % | 5.8 | % | ||||||||||
| Secured total |
5.8 | % | 5.8 | % | 5.8 | % | 5.8 | % | 5.8 | % | ||||||||||
| Unsecured |
||||||||||||||||||||
| Fixed rate bonds |
5.0 | % | 5.0 | % | 5.2 | % | 5.2 | % | 5.2 | % | ||||||||||
| Credit facilities |
5.1 | % | 5.1 | % | 5.4 | % | 5.9 | % | 5.8 | % | ||||||||||
| Unsecured total |
5.0 | % | 5.0 | % | 5.2 | % | 5.3 | % | 5.3 | % | ||||||||||
| Average |
5.2 | % | 5.2 | % | 5.3 | % | 5.4 | % | 5.4 | % | ||||||||||
Note: The current balance outstanding of the fixed rate bonds and notes is shown net of discounts/premiums in the amount of $1,165,598.
9
Long-Term Debt Analysis
(In thousands, except per share amounts)
Continued from previous page
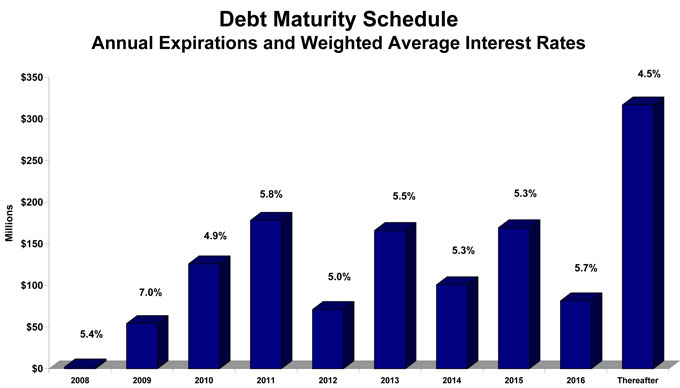
| Future Maturities of Debt | |||||||||||||||
| Year |
Secured Debt | Unsecured Debt | Credit Facilities | Total Debt | Average Interest Rate | ||||||||||
| 2008 |
$ | 2,119 | $ | — | $ | — | $ | 2,119 | 5.4 | % | |||||
| 2009 |
54,285 | — | — | 54,285 | 7.0 | % | |||||||||
| 2010 |
25,973 | 100,000 | — | 125,973 | 4.7 | % | |||||||||
| 2011 |
13,339 | 150,000 | 15,000 | 178,339 | 5.8 | % | |||||||||
| 2012 |
21,088 | 50,000 | — | 71,088 | 5.0 | % | |||||||||
| 2013 |
106,039 | 60,000 | — | 166,039 | 5.5 | % | |||||||||
| 2014 |
884 | 100,000 | — | 100,884 | 5.3 | % | |||||||||
| 2015 |
19,373 | 150,000 | — | 169,373 | 5.3 | % | |||||||||
| 2016 |
81,582 | — | — | 81,582 | 5.7 | % | |||||||||
| Thereafter |
6,893 | 310,000 | — | 316,893 | 4.5 | % | |||||||||
| Total maturities |
$ | 331,575 | $ | 920,000 | $ | 15,000 | $ | 1,266,575 | 5.2 | % | |||||
Weighted average maturity = 8.1 years
10
(In thousands, except per share amounts)
| June 30, 2008 |
March 31, 2008 |
December 31, 2007 |
September 30, 2007 |
June 30, 2007 |
||||||||||||||||
| Market Data |
||||||||||||||||||||
| Shares Outstanding |
49,461 | 46,716 | 46,682 | 46,669 | 46,665 | |||||||||||||||
| Market Price per Share |
$ | 30.05 | $ | 33.42 | $ | 31.41 | $ | 33.18 | $ | 34.00 | ||||||||||
| Equity Market Capitalization |
$ | 1,486,303 | $ | 1,561,249 | $ | 1,466,282 | $ | 1,548,477 | $ | 1,586,610 | ||||||||||
| Total Debt |
$ | 1,265,409 | $ | 1,344,822 | $ | 1,324,107 | $ | 1,261,094 | $ | 1,228,888 | ||||||||||
| Total Market Capitalization |
$ | 2,751,712 | $ | 2,906,071 | $ | 2,790,389 | $ | 2,809,571 | $ | 2,815,498 | ||||||||||
| Total Debt to Market Capitalization |
0.46:1 | 0.46:1 | 0.47:1 | 0.44:1 | 0.44:1 | |||||||||||||||
| Earnings to Fixed Charges(1) |
1.3 | x | 0.8 | x (3) | 1.3 | x | 1.4 | x | 1.3 | x | ||||||||||
| Debt Service Coverage Ratio(2) |
2.4 | x | 1.9 | x (3) | 2.5 | x | 2.6 | x | 2.5 | x | ||||||||||
| Dividend Data |
||||||||||||||||||||
| Total Dividends Paid |
$ | 21,376 | $ | 19,724 | $ | 19,723 | $ | 19,716 | $ | 19,716 | ||||||||||
| Common Dividend per Share |
$ | 0.4325 | $ | 0.4225 | $ | 0.4225 | $ | 0.4225 | $ | 0.4225 | ||||||||||
| Payout Ratio (FFO per share basis) |
77.2 | % | 103.0 | % | 71.6 | % | 71.6 | % | 76.8 | % | ||||||||||
| (1) |
The ratio of earnings to fixed charges is computed by dividing earnings by fixed charges. For this purpose, earnings consist of income from continuing operations plus fixed charges, less capitalized interest. Fixed charges consist of interest expense, including amortized costs of debt issuance, plus interest costs capitalized. |
| (2) |
Debt service coverage ratio is computed by dividing earnings before interest income and expense, depreciation, amortization and gain on sale of real estate by interest expense and principal amortization. |
| (3) |
Includes the impact of the loss on extinguishment of debt of $8.4 million and the write off of related note premium in the first quarter of 2008. |
11
Core Portfolio Net Operating Income (NOI) Growth & Rental Rate Growth
2008 vs. 2007
Cash Basis
| Second Quarter(1) | ||||||
| Sector |
NOI Growth |
Rental Rate Growth |
||||
| Multifamily |
2.1 | % | 1.1 | % | ||
| Office Buildings |
3.6 | % | 2.3 | % | ||
| Medical Office Buildings |
3.5 | % | 2.2 | % | ||
| Retail Centers |
3.3 | % | 3.5 | % | ||
| Industrial / Flex Properties |
-0.3 | % | 3.0 | % | ||
| Overall Core Portfolio |
2.7 | % | 2.4 | % | ||
GAAP Basis
| Second Quarter(1) | ||||||
| Sector |
NOI Growth |
Rental Rate Growth |
||||
| Multifamily |
2.1 | % | 1.1 | % | ||
| Office Buildings |
1.8 | % | 0.7 | % | ||
| Medical Office Buildings |
1.6 | % | 0.6 | % | ||
| Retail Centers |
2.0 | % | 4.1 | % | ||
| Industrial / Flex Properties |
-1.1 | % | 2.0 | % | ||
| Overall Core Portfolio |
1.3 | % | 1.5 | % | ||
| 1 |
Non-core properties were: |
2007 and 2008 sold properties - Maryland Trade Centers I and II, Sullyfield Center and The Earhart Building.
2007 acquisitions - 270 Technology Park, Monument II, 2440 M Street, Woodholme Medical Office Building, Woodholme Center, Ashburn Farm Office Park, CentreMed I & II, and 2000 M Street.
2008 acquisitions - 6100 Columbia Park Road and Sterling Medical Office Building.
12
Core Portfolio Net Operating Income (NOI) Summary
(In thousands)
| Three Months Ended June 30, | |||||||||
| 2008 | 2007 | % Change | |||||||
| Cash Basis: |
|||||||||
| Multifamily |
$ | 5,101 | $ | 4,995 | 2.1 | % | |||
| Office Buildings |
17,085 | 16,490 | 3.6 | % | |||||
| Medical Office Buildings |
5,824 | 5,626 | 3.5 | % | |||||
| Retail Centers |
7,727 | 7,483 | 3.3 | % | |||||
| Industrial/Flex |
7,449 | 7,474 | -0.3 | % | |||||
| $ | 43,186 | $ | 42,068 | 2.7 | % | ||||
| GAAP Basis: |
|||||||||
| Multifamily |
$ | 5,104 | $ | 5,001 | 2.1 | % | |||
| Office Buildings |
17,367 | 17,055 | 1.8 | % | |||||
| Medical Office Buildings |
6,030 | 5,937 | 1.6 | % | |||||
| Retail Centers |
7,930 | 7,773 | 2.0 | % | |||||
| Industrial/Flex |
7,495 | 7,582 | -1.1 | % | |||||
| $ | 43,926 | $ | 43,348 | 1.3 | % | ||||
13
Core Portfolio Net Operating Income (NOI) Detail
(In thousands)
| Three Months Ended June 30, 2008 | ||||||||||||||||||||||||||||
| Multifamily | Office | Medical Office | Retail | Industrial | Corporate and Other |
Total | ||||||||||||||||||||||
| Real estate rental revenue |
||||||||||||||||||||||||||||
| Core Portfolio |
$ | 8,884 | $ | 25,550 | $ | 8,759 | $ | 10,341 | $ | 9,938 | $ | — | $ | 63,472 | ||||||||||||||
| Non-core - acquired and in development 1 |
681 | 3,167 | 2,109 | — | 339 | — | 6,296 | |||||||||||||||||||||
| Total |
9,565 | 28,717 | 10,868 | 10,341 | 10,277 | — | 69,768 | |||||||||||||||||||||
| Real estate expenses |
||||||||||||||||||||||||||||
| Core Portfolio |
3,780 | 8,183 | 2,729 | 2,411 | 2,443 | — | 19,546 | |||||||||||||||||||||
| Non-core - acquired and in development 1 |
812 | 1,627 | 710 | — | 108 | — | 3,257 | |||||||||||||||||||||
| Total |
4,592 | 9,810 | 3,439 | 2,411 | 2,551 | — | 22,803 | |||||||||||||||||||||
| Net Operating Income (NOI) |
||||||||||||||||||||||||||||
| Core Portfolio |
5,104 | 17,367 | 6,030 | 7,930 | 7,495 | — | 43,926 | |||||||||||||||||||||
| Non-core - acquired and in development 1 |
(131 | ) | 1,540 | 1,399 | — | 231 | — | 3,039 | ||||||||||||||||||||
| Total |
$ | 4,973 | $ | 18,907 | $ | 7,429 | $ | 7,930 | $ | 7,726 | $ | — | $ | 46,965 | ||||||||||||||
| Core Portfolio NOI GAAP Basis (from above) |
$ | 5,104 | $ | 17,367 | $ | 6,030 | $ | 7,930 | $ | 7,495 | $ | — | $ | 43,926 | ||||||||||||||
| Straight-line revenue, net for core properties |
(4 | ) | (204 | ) | (92 | ) | (81 | ) | (70 | ) | — | (451 | ) | |||||||||||||||
| FAS 141 Min Rent |
— | (83 | ) | (114 | ) | (125 | ) | 19 | — | (303 | ) | |||||||||||||||||
| Amortization of lease intangibles for core properties |
1 | 5 | — | 3 | 5 | — | 14 | |||||||||||||||||||||
| Core portfolio NOI, Cash Basis |
$ | 5,101 | $ | 17,085 | $ | 5,824 | $ | 7,727 | $ | 7,449 | $ | — | $ | 43,186 | ||||||||||||||
| Reconciliation of NOI to Net Income (loss) |
||||||||||||||||||||||||||||
| Total NOI |
$ | 4,973 | $ | 18,907 | $ | 7,429 | $ | 7,930 | $ | 7,726 | $ | — | $ | 46,965 | ||||||||||||||
| Other income |
— | — | — | — | — | 220 | 220 | |||||||||||||||||||||
| Other income from life insurance proceeds |
— | — | — | — | — | — | — | |||||||||||||||||||||
| Interest expense |
(1,337 | ) | (848 | ) | (1,402 | ) | (334 | ) | (246 | ) | (13,415 | ) | (17,582 | ) | ||||||||||||||
| Depreciation and amortization |
(3,257 | ) | (9,234 | ) | (3,602 | ) | (1,771 | ) | (3,158 | ) | (176 | ) | (21,198 | ) | ||||||||||||||
| General and administrative |
— | — | — | — | — | (3,111 | ) | (3,111 | ) | |||||||||||||||||||
| Discontinued Operations2 |
— | — | — | — | 639 | — | 639 | |||||||||||||||||||||
| Gain on sale of real estate |
— | — | — | — | — | 15,275 | 15,275 | |||||||||||||||||||||
| Loss on extinguishment of debt |
— | — | — | — | — | — | — | |||||||||||||||||||||
| Net Income (loss) |
$ | 379 | $ | 8,825 | $ | 2,425 | $ | 5,825 | $ | 4,961 | $ | (1,207 | ) | $ | 21,208 | |||||||||||||
| 1 |
Non-core acquired and in development properties: |
2007 in development - Bennett Park, Clayborne Apartments and Dulles Station.
2007 acquisitions - 270 Technology Park, Monument II, 2440 M Street, Woodholme Medical Office Building, Woodholme Center, Ashburn Farm Office Park, CentreMed I & II and 2000 M Street.
2008 acquisitions - 6100 Columbia Park Road and Sterling Medical Office Building.
| 2 |
Discontinued operations include: Sold Properties - Sullyfield Center and The Earhart Building. |
14
Core Portfolio Net Operating Income (NOI) Detail
(In thousands)
| Three Months Ended June 30, 2007 | ||||||||||||||||||||||||||||
| Multifamily | Office | Medical Office | Retail | Industrial | Corporate and Other |
Total | ||||||||||||||||||||||
| Real estate rental revenue |
||||||||||||||||||||||||||||
| Core Portfolio |
$ | 8,430 | $ | 25,532 | $ | 8,543 | $ | 10,064 | $ | 9,982 | $ | — | $ | 62,551 | ||||||||||||||
| Non-core - acquired and in development 1 |
— | 176 | 528 | — | — | — | 704 | |||||||||||||||||||||
| Total |
8,430 | 25,708 | 9,071 | 10,064 | 9,982 | — | 63,255 | |||||||||||||||||||||
| Real estate expenses |
||||||||||||||||||||||||||||
| Core Portfolio |
3,429 | 8,477 | 2,606 | 2,291 | 2,400 | — | 19,203 | |||||||||||||||||||||
| Non-core - acquired and in development 1 |
108 | 61 | 170 | — | — | — | 339 | |||||||||||||||||||||
| Total |
3,537 | 8,538 | 2,776 | 2,291 | 2,400 | — | 19,542 | |||||||||||||||||||||
| Net Operating Income (NOI) |
||||||||||||||||||||||||||||
| Core Portfolio |
5,001 | 17,055 | 5,937 | 7,773 | 7,582 | — | 43,348 | |||||||||||||||||||||
| Non-core - acquired and in development 1 |
(108 | ) | 115 | 358 | — | — | — | 365 | ||||||||||||||||||||
| Total |
$ | 4,893 | $ | 17,170 | $ | 6,295 | $ | 7,773 | $ | 7,582 | $ | — | $ | 43,713 | ||||||||||||||
| Core Portfolio NOI GAAP Basis (from above) |
$ | 5,001 | $ | 17,055 | $ | 5,937 | $ | 7,773 | $ | 7,582 | $ | — | $ | 43,348 | ||||||||||||||
| Straight-line revenue, net for core properties |
(7 | ) | (470 | ) | (208 | ) | (151 | ) | (168 | ) | — | (1,004 | ) | |||||||||||||||
| FAS 141 Min Rent |
— | (99 | ) | (103 | ) | (142 | ) | 56 | — | (288 | ) | |||||||||||||||||
| Amortization of lease intangibles for core properties |
1 | 4 | — | 3 | 4 | — | 12 | |||||||||||||||||||||
| Core portfolio NOI, Cash Basis |
$ | 4,995 | $ | 16,490 | $ | 5,626 | $ | 7,483 | $ | 7,474 | $ | — | $ | 42,068 | ||||||||||||||
| Reconciliation of NOI to Net Income |
||||||||||||||||||||||||||||
| Total NOI |
$ | 4,893 | $ | 17,170 | $ | 6,295 | $ | 7,773 | $ | 7,582 | $ | — | $ | 43,713 | ||||||||||||||
| Other income |
— | — | — | — | — | 420 | 420 | |||||||||||||||||||||
| Other income from life insurance proceeds |
— | — | — | — | — | — | — | |||||||||||||||||||||
| Interest expense |
(913 | ) | (862 | ) | (1,172 | ) | (339 | ) | (250 | ) | (11,762 | ) | (15,298 | ) | ||||||||||||||
| Depreciation and amortization |
(1,691 | ) | (7,344 | ) | (2,806 | ) | (1,783 | ) | (2,896 | ) | (112 | ) | (16,632 | ) | ||||||||||||||
| General and administrative |
— | — | — | — | — | (5,367 | ) | (5,367 | ) | |||||||||||||||||||
| Discontinued Operations2 |
— | 1,016 | — | — | 485 | — | 1,501 | |||||||||||||||||||||
| Other income from life insurance proceeds |
— | — | — | — | — | — | — | |||||||||||||||||||||
| Net Income |
$ | 2,289 | $ | 9,980 | $ | 2,317 | $ | 5,651 | $ | 4,921 | $ | (16,821 | ) | $ | 8,337 | |||||||||||||
| 1 |
Non-core acquired and in development properties were: |
2007 in development - Bennett Park, Clayborne Apartments and Dulles Station.
2007 acquisitions - 270 Technology Park, Monument II, 2440 M Street, Woodholme Medical Office Building, Woodholme Center, Ashburn Farm Office Park, CentreMed I & II, and 2000 M Street.
| 2 |
Discontinued operations include: Sold Properties - Maryland Trade Center I and II, Sullyfield Center and The Earhart Building. |
15
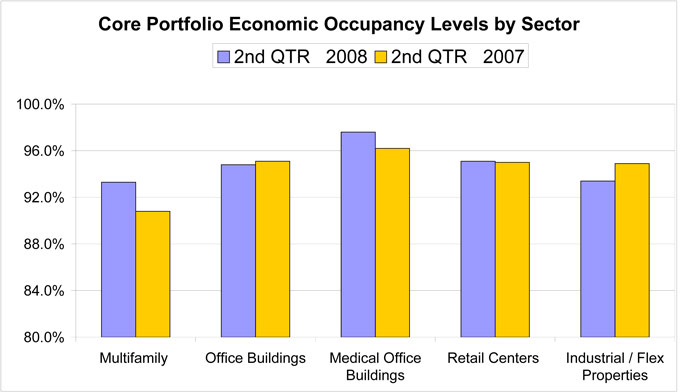
Core Portfolio & Overall Economic Occupancy Levels by Sector
Q2 2008 vs. Q2 2007
GAAP Basis
| Core Portfolio | All Properties | |||||||||||
| Sector |
2nd QTR 2008 | 2nd QTR 2007 | 2nd QTR 2008 | 2nd QTR 2007 | ||||||||
| Multifamily |
93.3 | % | 90.8 | % | 81.0 | % | 90.8 | % | ||||
| Office Buildings |
94.8 | % | 95.1 | % | 94.1 | % | 95.0 | % | ||||
| Medical Office Buildings |
97.6 | % | 96.2 | % | 97.2 | % | 96.3 | % | ||||
| Retail Centers |
95.1 | % | 95.0 | % | 95.1 | % | 95.0 | % | ||||
| Industrial / Flex Properties |
93.4 | % | 94.9 | % | 92.8 | % | 94.0 | % | ||||
| Overall Portfolio |
94.8 | % | 94.5 | % | 92.3 | % | 94.4 | % | ||||
16
Three and Six months ended 6/30/08
| 2nd Quarter 2008 | Year-to-Date | |||||||||||||||
| Gross Leasing Square Footage |
||||||||||||||||
| Office Buildings |
167,751 | 318,114 | ||||||||||||||
| Medical Office Buildings |
47,729 | 60,441 | ||||||||||||||
| Retail Centers |
59,168 | 76,569 | ||||||||||||||
| Industrial Centers |
198,561 | 287,647 | ||||||||||||||
| Total |
473,209 | 742,771 | ||||||||||||||
| Weighted Average Term (yrs) |
||||||||||||||||
| Office Buildings |
4.1 | 4.5 | ||||||||||||||
| Medical Office Buildings |
5.8 | 5.7 | ||||||||||||||
| Retail Centers |
7.0 | 6.5 | ||||||||||||||
| Industrial Centers |
4.2 | 4.3 | ||||||||||||||
| Total |
4.7 | 4.7 | ||||||||||||||
| GAAP | CASH | GAAP | CASH | |||||||||||||
| Rental Rate Increases: |
||||||||||||||||
| Rate on expiring leases |
||||||||||||||||
| Office Buildings |
$ | 25.08 | $ | 26.32 | $ | 28.45 | $ | 29.55 | ||||||||
| Medical Office Buildings |
30.21 | 32.80 | 30.03 | 32.23 | ||||||||||||
| Retail Centers |
20.01 | 21.13 | 20.61 | 21.85 | ||||||||||||
| Industrial Centers |
8.67 | 8.86 | 10.79 | 11.05 | ||||||||||||
| Total |
$ | 18.08 | $ | 19.00 | $ | 20.93 | $ | 21.81 | ||||||||
| Rate on new and renewal leases |
||||||||||||||||
| Office Buildings |
$ | 28.67 | $ | 27.48 | $ | 33.10 | $ | 31.64 | ||||||||
| Medical Office Buildings |
38.72 | 36.18 | 37.84 | 35.39 | ||||||||||||
| Retail Centers |
25.68 | 23.38 | 26.15 | 23.96 | ||||||||||||
| Industrial Centers |
9.65 | 9.14 | 11.86 | 11.17 | ||||||||||||
| Total |
$ | 21.33 | $ | 20.15 | $ | 24.54 | $ | 23.23 | ||||||||
| Percentage Increase |
||||||||||||||||
| Office Buildings |
14.30 | % | 4.42 | % | 16.33 | % | 7.10 | % | ||||||||
| Medical Office Buildings |
28.19 | % | 10.32 | % | 26.03 | % | 9.78 | % | ||||||||
| Retail Centers |
28.33 | % | 10.65 | % | 26.84 | % | 9.70 | % | ||||||||
| Industrial Centers |
11.26 | % | 3.15 | % | 9.92 | % | 1.12 | % | ||||||||
| Total |
17.97 | % | 6.07 | % | 17.25 | % | 6.52 | % | ||||||||
17
Commercial Leasing Summary
Continued from previous page
Three and Six months ended 6/30/08
| 2nd Quarter 2008 | Year-to-Date | |||||||||||
| Total Dollars | Dollars per Square Foot |
Total Dollars | Dollars per Square Foot | |||||||||
| Tenant Improvements |
||||||||||||
| Office Buildings |
$ | 1,053,486 | $ | 6.28 | $ | 2,230,365 | $ | 7.01 | ||||
| Medical Office Buildings |
871,444 | 18.26 | 979,239 | 16.20 | ||||||||
| Retail Centers |
15,500 | 0.26 | 15,500 | 0.20 | ||||||||
| Industrial Centers |
154,800 | 0.78 | 482,675 | 1.68 | ||||||||
| Subtotal |
$ | 2,095,230 | $ | 4.43 | $ | 3,707,779 | $ | 4.99 | ||||
| Total Dollars | Dollars per Square Foot |
Total Dollars | Dollars per Square Foot | |||||||||
| Leasing Costs |
||||||||||||
| Office Buildings |
$ | 766,730 | $ | 4.57 | $ | 1,844,326 | $ | 5.80 | ||||
| Medical Office Buildings |
405,958 | 8.51 | 457,340 | 7.57 | ||||||||
| Retail Centers |
177,167 | 2.99 | 202,317 | 2.64 | ||||||||
| Industrial Centers |
379,320 | 1.91 | 546,600 | 1.90 | ||||||||
| Subtotal |
$ | 1,729,175 | $ | 3.65 | $ | 3,050,583 | $ | 4.11 | ||||
| Total Dollars | Dollars per Square Foot |
Total Dollars | Dollars per Square Foot | |||||||||
| Tenant Improvements and Leasing Costs |
||||||||||||
| Office Buildings |
$ | 1,820,216 | $ | 10.85 | $ | 4,074,691 | $ | 12.81 | ||||
| Medical Office Buildings |
1,277,402 | 26.76 | 1,436,579 | 23.77 | ||||||||
| Retail Centers |
192,667 | 3.26 | 217,817 | 2.84 | ||||||||
| Industrial Centers |
534,120 | 2.69 | 1,029,275 | 3.58 | ||||||||
| Total |
$ | 3,824,405 | $ | 8.08 | $ | 6,758,362 | $ | 9.10 | ||||
18
10 Largest Tenants - Based on Annualized Rent
June 30, 2008
| Tenant |
Number of Buildings |
Weighted Average Remaining Lease Term in Months |
Percentage of Aggregate Portfolio Annualized Rent |
Aggregate Rentable Square Feet |
Percentage of Aggregate Occupied Square Feet |
|||||||
| World Bank |
1 | 41 | 4.42 | % | 210,354 | 2.17 | % | |||||
| Sunrise Assisted Living, Inc. |
1 | 63 | 2.57 | % | 184,202 | 1.90 | % | |||||
| General Services Administration |
8 | 20 | 2.04 | % | 256,038 | 2.64 | % | |||||
| URS Corporation |
1 | 58 | 1.42 | % | 97,208 | 1.00 | % | |||||
| INOVA Health System Hospital |
6 | 33 | 1.38 | % | 82,193 | 0.85 | % | |||||
| Lafarge North America, Inc. |
1 | 25 | 1.35 | % | 80,610 | 0.83 | % | |||||
| George Washington University |
2 | 92 | 1.18 | % | 77,538 | 0.80 | % | |||||
| IQ Solutions, Inc. |
1 | 35 | 1.02 | % | 57,452 | 0.59 | % | |||||
| Science Applications Int’l Corporation |
1 | 60 | 0.96 | % | 80,561 | 0.83 | % | |||||
| Sun Microsystems, Inc. |
1 | 42 | 0.94 | % | 65,443 | 0.67 | % | |||||
| Total/Weighted Average |
44 | 17.28 | % | 1,191,599 | 12.28 | % | ||||||
19
June 30, 2008
| Industry Classification (NAICS) |
Annualized Base Rental Revenue |
Percentage of Aggregate Annualized Rent |
Aggregate Rentable Square Feet |
Percentage of Aggregate Square Feet |
|||||||
| Professional, Scientific and Technical Services |
$ | 45,292,161 | 22.51 | % | 1,904,377 | 19.64 | % | ||||
| Ambulatory Health Care Services |
38,348,426 | 19.06 | % | 1,312,968 | 13.54 | % | |||||
| Credit Intermediation and Related Activities |
15,336,976 | 7.62 | % | 425,367 | 4.39 | % | |||||
| Executive, Legislative & Other General Government |
8,361,882 | 4.16 | % | 423,309 | 4.37 | % | |||||
| Religious, Grantmaking, Civic, Professional |
6,122,311 | 3.04 | % | 198,850 | 2.05 | % | |||||
| Nursing and Residential Care Facilities |
5,720,577 | 2.84 | % | 209,671 | 2.16 | % | |||||
| Food Services and Drinking Places |
5,509,807 | 2.74 | % | 219,267 | 2.26 | % | |||||
| Educational Services |
5,449,240 | 2.71 | % | 215,932 | 2.23 | % | |||||
| Administrative and Support Services |
5,411,670 | 2.69 | % | 380,279 | 3.92 | % | |||||
| Food and Beverage Stores |
4,070,248 | 2.02 | % | 254,796 | 2.63 | % | |||||
| Miscellaneous Store Retailers |
3,599,474 | 1.79 | % | 264,199 | 2.73 | % | |||||
| Merchant Wholesalers-Durable Goods |
3,559,757 | 1.77 | % | 376,104 | 3.88 | % | |||||
| Furniture and Home Furnishing Stores |
3,529,257 | 1.75 | % | 226,581 | 2.34 | % | |||||
| Specialty Trade Contractors |
3,465,049 | 1.72 | % | 378,951 | 3.91 | % | |||||
| Nonmetallic Mineral Product Manufacturing |
3,082,484 | 1.53 | % | 119,474 | 1.23 | % | |||||
| Broadcasting (except Internet) |
3,005,968 | 1.49 | % | 87,939 | 0.91 | % | |||||
| Personal and Laundry Services |
2,837,818 | 1.41 | % | 130,697 | 1.35 | % | |||||
| Health & Personal Care Services |
2,288,278 | 1.14 | % | 79,701 | 0.82 | % | |||||
| Clothing & Clothing Accessories Stores |
2,286,345 | 1.14 | % | 143,648 | 1.48 | % | |||||
| Real Estate |
2,199,898 | 1.09 | % | 84,424 | 0.87 | % | |||||
| Merchant Wholesalers-Non Durable Goods |
2,020,207 | 1.00 | % | 221,355 | 2.28 | % | |||||
| Amusement, Gambling and Recreation industries |
1,951,127 | 0.97 | % | 142,780 | 1.47 | % | |||||
| Miscellaneous Manufacturing |
1,868,793 | 0.93 | % | 196,837 | 2.03 | % | |||||
| Hospitals |
1,843,305 | 0.92 | % | 60,457 | 0.62 | % | |||||
| Construction of Buildings |
1,662,546 | 0.83 | % | 111,142 | 1.15 | % | |||||
| Sporting Goods/Books/Hobby/Music Stores |
1,633,033 | 0.81 | % | 122,058 | 1.26 | % | |||||
| Insurance Carriers and Related Activities |
1,544,289 | 0.77 | % | 71,305 | 0.74 | % | |||||
| General Merchandise Stores |
1,514,754 | 0.75 | % | 216,330 | 2.23 | % | |||||
| Telecommunications |
1,298,165 | 0.65 | % | 48,757 | 0.50 | % | |||||
| Other |
16,386,146 | 8.15 | % | 1,068,515 | 11.01 | % | |||||
| Total |
$ | 201,199,991 | 100.00 | % | 9,696,070 | 100.00 | % | ||||
20
June 30, 2008
| Year |
Number of Leases |
Rentable Square Feet |
Percent of Rentable Square Feet |
Annualized Rent * |
Average Rental Rate |
Percent of Annualized Rent * |
||||||||||
| Office: |
||||||||||||||||
| 2008 |
44 | 142,791 | 4.17 | % | $ | 4,013,881 | $ | 28.11 | 4.03 | % | ||||||
| 2009 |
109 | 427,954 | 12.51 | % | 12,088,158 | 28.25 | 12.13 | % | ||||||||
| 2010 |
108 | 780,043 | 22.80 | % | 23,730,668 | 30.42 | 23.82 | % | ||||||||
| 2011 |
90 | 545,895 | 15.96 | % | 16,887,014 | 30.93 | 16.95 | % | ||||||||
| 2012 |
50 | 316,184 | 9.24 | % | 8,886,923 | 28.11 | 8.92 | % | ||||||||
| 2013 and thereafter |
109 | 1,208,681 | 35.32 | % | 34,023,157 | 28.15 | 34.15 | % | ||||||||
| 510 | 3,421,548 | 100.00 | % | $ | 99,629,801 | $ | 29.12 | 100.00 | % | |||||||
| Medical Office: |
||||||||||||||||
| 2008 |
21 | 48,662 | 4.22 | % | $ | 1,538,173 | $ | 31.61 | 4.26 | % | ||||||
| 2009 |
42 | 102,332 | 8.87 | % | 3,114,168 | 30.43 | 8.62 | % | ||||||||
| 2010 |
54 | 185,224 | 16.06 | % | 5,943,127 | 32.09 | 16.45 | % | ||||||||
| 2011 |
60 | 198,395 | 17.20 | % | 6,296,199 | 31.74 | 17.42 | % | ||||||||
| 2012 |
41 | 141,375 | 12.26 | % | 4,666,844 | 33.01 | 12.91 | % | ||||||||
| 2013 and thereafter |
104 | 477,336 | 41.39 | % | 14,579,274 | 30.54 | 40.34 | % | ||||||||
| 322 | 1,153,324 | 100.00 | % | $ | 36,137,785 | $ | 31.33 | 100.00 | % | |||||||
| Retail: |
||||||||||||||||
| 2008 |
17 | 130,160 | 7.01 | % | $ | 936,833 | $ | 7.20 | 2.90 | % | ||||||
| 2009 |
48 | 158,440 | 8.53 | % | 3,410,312 | 21.52 | 10.57 | % | ||||||||
| 2010 |
53 | 309,244 | 16.65 | % | 5,429,445 | 17.56 | 16.83 | % | ||||||||
| 2011 |
31 | 156,346 | 8.42 | % | 2,819,384 | 18.03 | 8.74 | % | ||||||||
| 2012 |
39 | 168,906 | 9.10 | % | 3,291,940 | 19.49 | 10.20 | % | ||||||||
| 2013 and thereafter |
100 | 933,927 | 50.29 | % | 16,375,149 | 17.53 | 50.76 | % | ||||||||
| 288 | 1,857,023 | 100.00 | % | $ | 32,263,063 | $ | 17.37 | 100.00 | % | |||||||
| Industrial: |
||||||||||||||||
| 2008 |
35 | 277,291 | 8.50 | % | $ | 2,955,133 | $ | 10.66 | 8.91 | % | ||||||
| 2009 |
52 | 530,040 | 16.24 | % | 4,878,129 | 9.20 | 14.71 | % | ||||||||
| 2010 |
53 | 382,795 | 11.73 | % | 4,396,002 | 11.48 | 13.25 | % | ||||||||
| 2011 |
46 | 483,979 | 14.83 | % | 4,029,321 | 8.33 | 12.15 | % | ||||||||
| 2012 |
27 | 424,661 | 13.01 | % | 4,460,304 | 10.50 | 13.45 | % | ||||||||
| 2013 and thereafter |
54 | 1,165,409 | 35.69 | % | 12,450,453 | 10.68 | 37.53 | % | ||||||||
| 267 | 3,264,175 | 100.00 | % | $ | 33,169,342 | $ | 10.16 | 100.00 | % | |||||||
| Total: |
||||||||||||||||
| 2008 |
117 | 598,904 | 6.18 | % | $ | 9,444,020 | $ | 15.77 | 4.69 | % | ||||||
| 2009 |
251 | 1,218,766 | 12.57 | % | 23,490,767 | 19.27 | 11.68 | % | ||||||||
| 2010 |
268 | 1,657,306 | 17.09 | % | 39,499,242 | 23.83 | 19.63 | % | ||||||||
| 2011 |
227 | 1,384,615 | 14.28 | % | 30,031,918 | 21.69 | 14.93 | % | ||||||||
| 2012 |
157 | 1,051,126 | 10.84 | % | 21,306,011 | 20.27 | 10.59 | % | ||||||||
| 2013 and thereafter |
367 | 3,785,353 | 39.04 | % | 77,428,033 | 20.45 | 38.48 | % | ||||||||
| 1,387 | 9,696,070 | 100.00 | % | $ | 201,199,991 | $ | 20.75 | 100.00 | % | |||||||
| * | Annualized Rent is as of June 30, 2008 rental revenue (cash basis) multiplied by 12. |
21
2008 Acquisition and Disposition Summary
as of June 30, 2008
($’s in thousands)
Acquisition Summary
| Acquisition Date |
Square Feet |
Leased Percentage at Acquisition |
June 30, 2008 Leased Percentage |
Investment | ||||||||||||
| 6100 Columbia Park Road |
Landover, MD | February 22, 2008 | 150,000 | 78 | % | 100 | % | $ | 11,200 | |||||||
| Sterling Medical Office Building1 |
Sterling, VA | May 21, 2008 | 36,000 | 100 | % | 100 | % | $ | 6,500 | |||||||
| Total |
186,000 | $ | 17,700 | |||||||||||||
| Disposition Summary | ||||||||||||||||
| Disposition Date |
Property Type |
Square Feet |
Sale Price | GAAP Gain | ||||||||||||
| Sullyfield Center/The Earhart Building |
Chantilly, VA | June 6, 2008 | Industrial | 336,000 | $ | 41,100 | $ | 15,300 | ||||||||
| 1 |
The sellers of Sterling Medical Office Building agreed to lease 37% of the building’s space for a period of 12-18 months. |
22
June 30, 2008
| PROPERTIES |
LOCATION |
YEAR ACQUIRED | YEAR CONSTRUCTED | NET RENTABLE SQUARE FEET* | ||||
| Office Buildings |
||||||||
| 1901 Pennsylvania Avenue |
Washington, DC | 1977 | 1960 | 97,000 | ||||
| 51 Monroe Street |
Rockville, MD | 1979 | 1975 | 210,000 | ||||
| 515 King Street |
Alexandria, VA | 1992 | 1966 | 76,000 | ||||
| The Lexington Building |
Rockville, MD | 1993 | 1970 | 46,000 | ||||
| The Saratoga Building |
Rockville, MD | 1993 | 1977 | 58,000 | ||||
| Brandywine Center |
Rockville, MD | 1993 | 1969 | 35,000 | ||||
| 6110 Executive Boulevard |
Rockville, MD | 1995 | 1971 | 198,000 | ||||
| 1220 19th Street |
Washington, DC | 1995 | 1976 | 102,000 | ||||
| 1600 Wilson Boulevard |
Arlington, VA | 1997 | 1973 | 166,000 | ||||
| 7900 Westpark Drive |
McLean, VA | 1997 | 1972/1986/1999 | 523,000 | ||||
| 600 Jefferson Plaza |
Rockville, MD | 1999 | 1985 | 112,000 | ||||
| 1700 Research Boulevard |
Rockville, MD | 1999 | 1982 | 101,000 | ||||
| Parklawn Plaza |
Rockville, MD | 1999 | 1986 | 40,000 | ||||
| Wayne Plaza |
Silver Spring, MD | 2000 | 1970 | 91,000 | ||||
| Courthouse Square |
Alexandria, VA | 2000 | 1979 | 113,000 | ||||
| One Central Plaza |
Rockville, MD | 2001 | 1974 | 267,000 | ||||
| The Atrium Building |
Rockville, MD | 2002 | 1980 | 80,000 | ||||
| 1776 G Street |
Washington, DC | 2003 | 1979 | 263,000 | ||||
| Albemarle Point |
Chantilly, VA | 2005 | 2001 | 89,000 | ||||
| 6565 Arlington Blvd |
Falls Church, VA | 2006 | 1967/1998 | 140,000 | ||||
| West Gude Drive |
Rockville, MD | 2006 | 1984/1986/1988 | 289,000 | ||||
| The Ridges |
Gaithersburg, MD | 2006 | 1990 | 104,000 | ||||
| The Crescent |
Gaithersburg, MD | 2006 | 1989 | 49,000 | ||||
| Monument II |
Herndon, VA | 2007 | 2000 | 205,000 | ||||
| Woodholme Center |
Pikesville, MD | 2007 | 1989 | 73,000 | ||||
| 2000 M Street |
Washington, DC | 2007 | 1971 | 227,000 | ||||
| Subtotal |
3,754,000 | |||||||
| Medical Office Buildings |
||||||||
| Woodburn Medical Park I |
Annandale, VA | 1998 | 1984 | 71,000 | ||||
| Woodburn Medical Park II |
Annandale, VA | 1998 | 1988 | 96,000 | ||||
| Prosperity Medical Center I |
Merrifield, VA | 2003 | 2000 | 92,000 | ||||
| Prosperity Medical Center II |
Merrifield, VA | 2003 | 2001 | 88,000 | ||||
| Prosperity Medical Center III |
Merrifield, VA | 2003 | 2002 | 75,000 | ||||
| Shady Grove Medical Village II |
Rockville, MD | 2004 | 1999 | 66,000 | ||||
| 8301 Arlington Boulevard |
Fairfax, VA | 2004 | 1965 | 49,000 | ||||
| Alexandria Professional Center |
Alexandria, VA | 2006 | 1968 | 113,000 | ||||
| 9707 Medical Center Drive |
Rockville, MD | 2006 | 1994 | 38,000 | ||||
| 15001 Shady Grove Road |
Rockville, MD | 2006 | 1999 | 51,000 | ||||
| Plumtree Medical Center |
Bel Air, MD | 2006 | 1991 | 33,000 | ||||
| 15005 Shady Grove Road |
Rockville, MD | 2006 | 2002 | 52,000 | ||||
| 2440 M Street |
Washington, DC | 2007 | 1986/2006 | 110,000 | ||||
| Woodholme Medical Office Building |
Pikesville, MD | 2007 | 1996 | 125,000 | ||||
| Ashburn Office Park |
Ashburn, VA | 2007 | 1998/2000/2002 | 75,000 | ||||
| CentreMed I & II |
Centreville, VA | 2007 | 1998 | 52,000 | ||||
| Sterling Medical Office Building |
Sterling, VA | 2008 | 1986/2000 | 36,000 | ||||
| Subtotal |
1,222,000 | |||||||
| Retail Centers |
||||||||
| Takoma Park |
Takoma Park, MD | 1963 | 1962 | 51,000 | ||||
| Westminster |
Westminster, MD | 1972 | 1969 | 151,000 | ||||
| Concord Centre |
Springfield, VA | 1973 | 1960 | 76,000 | ||||
| Wheaton Park |
Wheaton, MD | 1977 | 1967 | 72,000 | ||||
| Bradlee |
Alexandria, VA | 1984 | 1955 | 168,000 | ||||
| Chevy Chase Metro Plaza |
Washington, DC | 1985 | 1975 | 49,000 | ||||
| Montgomery Village Center |
Gaithersburg, MD | 1992 | 1969 | 198,000 | ||||
| Shoppes of Foxchase1 |
Alexandria, VA | 1994 | 1960 | 134,000 | ||||
| Frederick County Square |
Frederick, MD | 1995 | 1973 | 227,000 | ||||
| 800 S. Washington Street |
Alexandria, VA | 1998/2003 | 1955/1959 | 44,000 | ||||
| Centre at Hagerstown |
Hagerstown, MD | 2002 | 2000 | 332,000 | ||||
| Frederick Crossing |
Frederick, MD | 2005 | 1999/2003 | 295,000 | ||||
| Randolph Shopping Center |
Rockville, MD | 2006 | 1972 | 82,000 | ||||
| Montrose Shopping Center |
Rockville, MD | 2006 | 1970 | 143,000 | ||||
| Subtotal |
2,022,000 | |||||||
| 1 |
Development on approximately 60,000 square feet of the center was completed in December 2006. |
23
Schedule of Properties (Cont.)
June 30, 2008
| PROPERTIES |
LOCATION |
YEAR ACQUIRED | YEAR CONSTRUCTED | NET RENTABLE SQUARE FEET* | ||||
| Multifamily Buildings * / # units |
||||||||
| 3801 Connecticut Avenue / 307 |
Washington, DC | 1963 | 1951 | 179,000 | ||||
| Roosevelt Towers / 191 |
Falls Church, VA | 1965 | 1964 | 170,000 | ||||
| Country Club Towers / 227 |
Arlington, VA | 1969 | 1965 | 163,000 | ||||
| Park Adams / 200 |
Arlington, VA | 1969 | 1959 | 173,000 | ||||
| Munson Hill Towers / 279 |
Falls Church, VA | 1970 | 1963 | 259,000 | ||||
| The Ashby at McLean / 253 |
McLean, VA | 1996 | 1982 | 252,000 | ||||
| Walker House Apartments / 212 |
Gaithersburg, MD | 1996 | 1971/20032 | 159,000 | ||||
| Bethesda Hill Apartments / 195 |
Bethesda, MD | 1997 | 1986 | 226,000 | ||||
| Avondale / 237 |
Laurel, MD | 1999 | 1987 | 170,000 | ||||
| Bennett Park / 224 |
Arlington, VA | 2007 | 2007 | 268,000 | ||||
| Clayborne / 74 |
Alexandria, VA | 2008 | 2008 | 87,000 | ||||
| Subtotal (2,399 units) |
2,106,000 | |||||||
| Industrial Distribution / Flex Properties |
||||||||
| Fullerton Business Center |
Springfield, VA | 1985 | 1980 | 104,000 | ||||
| Charleston Business Center |
Rockville, MD | 1993 | 1973 | 85,000 | ||||
| Tech 100 Industrial Park |
Elkridge, MD | 1995 | 1990 | 166,000 | ||||
| Crossroads Distribution Center |
Elkridge, MD | 1995 | 1987 | 85,000 | ||||
| The Alban Business Center |
Springfield, VA | 1996 | 1981/1982 | 87,000 | ||||
| Ammendale Technology Park I |
Beltsville, MD | 1997 | 1985 | 167,000 | ||||
| Ammendale Technology Park II |
Beltsville, MD | 1997 | 1986 | 107,000 | ||||
| Pickett Industrial Park |
Alexandria, VA | 1997 | 1973 | 246,000 | ||||
| Northern Virginia Industrial Park |
Lorton, VA | 1998 | 1968/1991 | 787,000 | ||||
| 8900 Telegraph Road |
Lorton, VA | 1998 | 1985 | 32,000 | ||||
| Dulles South IV |
Chantilly, VA | 1999 | 1988 | 83,000 | ||||
| Sully Square |
Chantilly, VA | 1999 | 1986 | 95,000 | ||||
| Amvax |
Beltsville, MD | 1999 | 1986 | 31,000 | ||||
| Fullerton Industrial Center |
Springfield, VA | 2003 | 1980 | 137,000 | ||||
| 8880 Gorman Road |
Laurel, MD | 2004 | 2000 | 141,000 | ||||
| Dulles Business Park Portfolio |
Chantilly, VA | 2004/2005 | 1999-2005 | 324,000 | ||||
| Albemarle Point |
Chantilly, VA | 2005 | 2001/2003/2005 | 207,000 | ||||
| Hampton Overlook |
Capital Heights, MD | 2006 | 1989 | 134,000 | ||||
| Hampton South |
Capital Heights, MD | 2006 | 1989/2005 | 168,000 | ||||
| 9950 Business Parkway |
Lanham, MD | 2006 | 2005 | 102,000 | ||||
| 270 Technology Park |
Frederick, MD | 2007 | 1986-1987 | 157,000 | ||||
| 6100 Columbia Park Road |
Landover, MD | 2008 | 1969 | 150,000 | ||||
| Subtotal |
3,595,000 | |||||||
| TOTAL |
12,699,000 | |||||||
| * | Multifamily buildings are presented in gross square feet. |
| 2 |
A 16 unit addition referred to as The Gardens at Walker House was completed in October 2003. |
24
June 30, 2008
Annualized base rent (ABR) is calculated as monthly base rent (cash basis) per the lease, as of the reporting period, multiplied by 12.
Debt to total market capitalization is total debt from the balance sheet divided by the sum of total debt from the balance sheet plus the market value of shares outstanding at the end of the period.
EBITDA (a non-GAAP measure) is earnings before interest, taxes, depreciation and amortization.
Ratio of earnings to fixed charges is computed by dividing earnings by fixed charges. For this purpose, earnings consist of income from continuing operations (or net income if there are no discontinued operations) plus fixed charges, less capitalized interest. Fixed charges consist of interest expense, including amortized costs of debt issuance, plus interest costs capitalized.
Debt service coverage ratio is computed by dividing earnings before interest income and expense, depreciation, amortization and gain on sale of real estate by interest expense and principal amortization.
Funds from operations (FFO) - The National Association of Real Estate Investment Trusts, Inc. (NAREIT) defines FFO (April, 2002 White Paper) as net income (computed in accordance with generally accepted accounting principles (GAAP)) excluding gains (or losses) from sales of property plus real estate depreciation and amortization. FFO is a non-GAAP measure.
Funds Available for Distribution (FAD), a non-GAAP measure, is calculated by subtracting from FFO recurring expenditures, tenant improvements and leasing costs, that are capitalized and amortized and are necessary to maintain our properties and revenue stream and straight line rents, then adding non-real estate depreciation and amortization and adding or subtracting amortization of lease intangibles, as appropriate.
Recurring capital expenditures represents non-accretive building improvements and leasing costs required to maintain current revenues. Recurring capital expenditures do not include acquisition capital that was taken into consideration when underwriting the purchase of a building or which are incurred to bring a building up to “operating standard.”
Rent increases on renewals and rollovers are calculated as the difference, weighted by square feet, of the net ABR due the first month after a term commencement date and the net ABR due the last month prior to the termination date of the former tenant’s term.
Core portfolio properties include all properties that were owned for the entirety of the current and prior year reporting periods.
Core portfolio net operating income (NOI) growth is the change in the NOI of the core portfolio properties from the prior reporting period to the current reporting period.
25