
Third Quarter 2011
Supplemental Operating and Financial Data
for the Quarter Ended
September 30, 2011
|
|
|
| Contact: |
|
6110 Executive Boulevard |
| William T. Camp |
|
Suite 800 |
| Executive Vice President and |
|
Rockville, MD 20852 |
| Chief Financial Officer |
|
(301) 984-9400 |
| E-mail: bcamp@writ.com |
|
(301) 984-9610 fax |

Washington Real Estate Investment Trust (“WRIT”) is a self-administered, self-managed, equity real estate
investment trust investing in income-producing properties in the greater Washington metro region. WRIT is diversified, as it invests in office, medical office, retail, and multifamily properties and land for development.
In the third quarter of 2011, WRIT acquired three assets totaling 767,000 square feet and $233 million: Olney Village Center, Braddock Metro Center and
John Marshall II.
WRIT acquired Olney Village Center, a 199,000 square foot grocery-anchored shopping center in Olney, Maryland for $58.0
million. The property is anchored by Shoppers Food Warehouse and is 98.7% leased to 32 tenants, including national retailers T.J. Maxx, HomeGoods, and SunTrust Bank. The center was built in 1979 and underwent a major renovation in 2003. WRIT assumed
a $22.6 million mortgage bearing interest at 6.37% per annum and maturing in 2023 and funded the remaining balance of $35.4 million using available cash and its line of credit. WRIT expects to achieve a first year unleveraged yield of 6.7% on a
cash basis.
WRIT acquired Braddock Metro Center, a 345,000 square foot office campus on the Metro in Alexandria, Virginia, for $101 million.
The campus consists of four office buildings and a two-level underground parking garage and is located in the northwest quadrant of Old Town Alexandria, immediately adjacent to the Braddock Road Metro Station (Yellow and Blue lines), one stop from
Reagan National Airport. The properties were built in 1985 and are 92% leased to 13 office tenants including associations and government contractors. WRIT funded the acquisition with cash proceeds from its recent sale transactions of the industrial
portfolio. WRIT expects to achieve a first year unleveraged yield of 6.9% on a cash basis.
WRIT acquired John Marshall II, a nine story,
223,000 square foot office building situated at the Tysons Central 7 Metro Station in Tysons Corner, Virginia, for $73.5 million. The property is 100% leased to Booz Allen Hamilton Inc. through January 2016 and serves as its worldwide headquarters.
It was built in 1996 and renovated in 2010 and is located at 8283 Greensboro Drive. The Tysons Central 7 Metro Station is one of four metro stations currently under construction that will serve Tysons Corner upon the Dulles Corridor Metrorail’s
anticipated completion in 2013. WRIT assumed a $54.1 million mortgage bearing interest at 5.79% per annum and maturing in 2016. WRIT funded the remaining balance of $19.4 million using proceeds from the recent sales of its industrial assets and
its line of credit and expects to achieve a first year unleveraged yield of 6.7% on a cash basis.
In the third quarter as well as subsequent
to quarter end, WRIT completed four separate sale transactions involving an aggregate of approximately 2.6 million square feet of its industrial portfolio along with two office assets. The aggregate sales proceeds for the four transactions were
$280.3 million. The first sale transaction included 8880 Gorman Road, Alban Business Center, Dulles South IV, Fullerton Business Center, and Hampton Overlook. The second transaction included Northern Virginia Industrial Park I and Pickett Industrial
Park. The third transaction included 270 Technology Park, 8900 Telegraph Road, 9950 Business Parkway, Albemarle Point, Fullerton Industrial Center, Hampton South, and Sully Square, as well as the Albemarle Point and Crescent office buildings. The
fourth transaction included Northern Virginia Industrial Park II. The buyers are affiliates of a joint venture between AREA Property Partners (AREA) and the Adler Group (Adler).
WRIT’s remaining two industrial properties, 6100 Columbia Park Road and Dulles Business Park, are under one additional sale contract with AREA/Adler which is projected to close on or about
November 1, 2011 for approximately $69.7 million. The aggregate sales proceeds for the entire industrial portfolio are $350 million.
WRIT signed commercial leases for 242,000 square feet with an average lease term of 4.7 years. The average rental rate increase on new and renewal leases
was 11.7% on a GAAP basis and 2.6% on a cash basis. Commercial tenant improvement costs were $14.90 per square foot and leasing costs were $9.54 per square foot for the quarter.

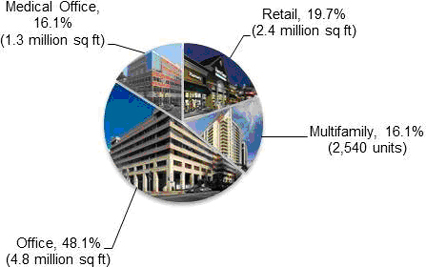
As of September 30, 2011, WRIT owned a diversified portfolio of 74 properties totaling approximately
10 million square feet of commercial space and 2,540 residential units, and land held for development. These 74 properties consist of 26 office properties, 3 industrial/flex properties, 18 medical office properties, 16 retail centers and 11
multifamily properties. WRIT shares are publicly traded on the New York Stock Exchange (NYSE:WRE).
With investments in the office, medical
office, retail and multifamily segments, WRIT is uniquely diversified. This balanced portfolio provides stability during market fluctuations in specific property types.
Net Operating Income Contribution by Sector
| * |
Excludes discontinued operations: |
Held for sale and sold properties: Industrial Portfolio; The Crescent and Albemarle office buildings
Certain statements in our earnings release and on our conference call are “forward-looking statements” within the meaning of the Private Securities Litigation Reform Act of 1995. Such statements
involve known and unknown risks, uncertainties, and other factors that may cause actual results to differ materially. Such risks, uncertainties and other factors include, but are not limited to, the potential for federal government budget
reductions, changes in general and local economic and real estate market conditions, the timing and pricing of lease transactions, the effect of the current credit and financial market conditions, the availability and cost of capital, fluctuations
in interest rates, tenants’ financial conditions, levels of competition, the effect of government regulation, the impact of newly adopted accounting principles, and other risks and uncertainties detailed from time to time in our filings with
the SEC, including our 2010 Form 10-K and third quarter 2011 Form 10-Q. We assume no obligation to update or supplement forward-looking statements that become untrue because of subsequent events.

|
|
|
|
|
| Schedule |
|
Page |
|
|
|
| Key Financial Data |
|
|
|
|
| Consolidated Statements of Operations |
|
|
4 |
|
| Consolidated Balance Sheets |
|
|
5 |
|
| Funds From Operations and Funds Available for Distribution |
|
|
6 |
|
| Adjusted Earnings Before Interest Taxes Depreciation and Amortization (EBITDA) |
|
|
7 |
|
|
|
| Capital Analysis |
|
|
|
|
| Long-Term Debt Analysis |
|
|
8-9 |
|
| Debt Covenant Compliance |
|
|
10 |
|
| Capital Analysis |
|
|
11 |
|
|
|
| Portfolio Analysis |
|
|
|
|
| Same-Store Portfolio Net Operating Income (NOI) Growth & Rental Rate Growth |
|
|
12 |
|
| Same-Store Portfolio Net Operating Income (NOI) Summary |
|
|
13 |
|
| Same-Store Portfolio Net Operating Income (NOI) Detail for the Quarter |
|
|
14-15 |
|
| Net Operating Income (NOI) by Region |
|
|
16 |
|
| Same-Store Portfolio & Overall Physical Occupancy Levels by Sector |
|
|
17 |
|
| Same-Store Portfolio & Overall Economic Occupancy Levels by Sector |
|
|
18 |
|
| Tenant Analysis |
|
|
|
|
| Commercial Leasing Summary |
|
|
19-20 |
|
| 10 Largest Tenants - Based on Annualized Base Rent |
|
|
21 |
|
| Industry Diversification |
|
|
22 |
|
| Lease expirations as of September 30, 2011 |
|
|
23 |
|
|
|
| Growth and Strategy |
|
|
|
|
| 2011 Acquisition and Disposition Summary |
|
|
24 |
|
|
|
| Appendix |
|
|
|
|
| Schedule of Properties |
|
|
25-26 |
|
| Supplemental Definitions |
|
|
27 |
|

|
|
|
|
|
|
|
|
|
|
|
|
|
|
|
|
|
|
|
|
|
| |
|
Three Months Ended |
|
| |
|
9/30/2011 |
|
|
6/30/2011 |
|
|
3/31/2011 |
|
|
12/31/2010 |
|
|
9/30/2010 |
|
| OPERATING RESULTS |
|
|
|
|
|
|
|
|
|
|
|
|
|
|
|
|
|
|
|
|
|
|
|
|
|
|
| Real estate rental revenue |
|
$ |
71,931 |
|
|
$ |
71,684 |
|
|
$ |
69,204 |
|
|
$ |
65,364 |
|
|
$ |
65,032 |
|
| Real estate expenses |
|
|
(24,070 |
) |
|
|
(23,801 |
) |
|
|
(23,253 |
) |
|
|
(21,033 |
) |
|
|
(21,912 |
) |
|
|
|
|
|
|
|
|
|
|
|
|
|
|
|
|
|
|
|
|
|
|
|
|
47,861 |
|
|
|
47,883 |
|
|
|
45,951 |
|
|
|
44,331 |
|
|
|
43,120 |
|
|
|
|
|
|
|
| Real estate depreciation and amortization |
|
|
(23,479 |
) |
|
|
(22,526 |
) |
|
|
(21,894 |
) |
|
|
(20,492 |
) |
|
|
(20,224 |
) |
|
|
|
|
|
|
|
|
|
|
|
|
|
|
|
|
|
|
|
|
|
| Income from real estate |
|
|
24,382 |
|
|
|
25,357 |
|
|
|
24,057 |
|
|
|
23,839 |
|
|
|
22,896 |
|
|
|
|
|
|
|
| Other income |
|
|
270 |
|
|
|
310 |
|
|
|
306 |
|
|
|
318 |
|
|
|
289 |
|
| Acquisition costs |
|
|
(1,600 |
) |
|
|
(322 |
) |
|
|
(1,649 |
) |
|
|
(709 |
) |
|
|
— |
|
| Gain from non-disposal activities |
|
|
— |
|
|
|
— |
|
|
|
— |
|
|
|
3 |
|
|
|
4 |
|
| Gain (loss) on extinguishment of debt |
|
|
— |
|
|
|
— |
|
|
|
— |
|
|
|
(8,896 |
) |
|
|
(238 |
) |
| Interest expense |
|
|
(16,508 |
) |
|
|
(16,865 |
) |
|
|
(16,893 |
) |
|
|
(17,567 |
) |
|
|
(16,717 |
) |
| General and administrative |
|
|
(3,837 |
) |
|
|
(4,049 |
) |
|
|
(3,702 |
) |
|
|
(3,951 |
) |
|
|
(3,141 |
) |
|
|
|
|
|
|
|
|
|
|
|
|
|
|
|
|
|
|
|
|
|
| Income (loss) from continuing operations |
|
|
2,707 |
|
|
|
4,431 |
|
|
|
2,119 |
|
|
|
(6,963 |
) |
|
|
3,093 |
|
| Discontinued operations: |
|
|
|
|
|
|
|
|
|
|
|
|
|
|
|
|
|
|
|
|
| Income (loss) from operations of properties sold or held for sale |
|
|
3,655 |
|
|
|
3,298 |
|
|
|
2,569 |
|
|
|
3,921 |
|
|
|
3,565 |
|
| Income tax benefit (expense) |
|
|
35 |
|
|
|
(1,173 |
) |
|
|
— |
|
|
|
— |
|
|
|
— |
|
| Gain on sale of real estate |
|
|
56,639 |
|
|
|
— |
|
|
|
— |
|
|
|
13,657 |
|
|
|
— |
|
|
|
|
|
|
|
|
|
|
|
|
|
|
|
|
|
|
|
|
|
|
| Income from discontinued operations |
|
|
60,329 |
|
|
|
2,125 |
|
|
|
2,569 |
|
|
|
17,578 |
|
|
|
3,565 |
|
|
|
|
|
|
|
| Net income |
|
|
63,036 |
|
|
|
6,556 |
|
|
|
4,688 |
|
|
|
10,615 |
|
|
|
6,658 |
|
| Less: Net income from noncontrolling interests |
|
|
(28 |
) |
|
|
(34 |
) |
|
|
(23 |
) |
|
|
(24 |
) |
|
|
(33 |
) |
|
|
|
|
|
|
|
|
|
|
|
|
|
|
|
|
|
|
|
|
|
| Net income attributable to the controlling interests |
|
$ |
63,008 |
|
|
$ |
6,522 |
|
|
$ |
4,665 |
|
|
$ |
10,591 |
|
|
$ |
6,625 |
|
|
|
|
|
|
|
|
|
|
|
|
|
|
|
|
|
|
|
|
|
|
|
|
|
|
|
|
| Per Share Data |
|
|
|
|
|
|
|
|
|
|
|
|
|
|
|
|
|
|
|
|
| Net income attributable to the controlling interests |
|
$ |
0.95 |
|
|
$ |
0.10 |
|
|
$ |
0.07 |
|
|
$ |
0.16 |
|
|
$ |
0.10 |
|
|
|
|
|
|
|
| Fully diluted weighted average shares outstanding |
|
|
66,064 |
|
|
|
65,989 |
|
|
|
65,907 |
|
|
|
64,536 |
|
|
|
63,055 |
|
|
|
|
|
|
|
| Percentage of Revenues: |
|
|
|
|
|
|
|
|
|
|
|
|
|
|
|
|
|
|
|
|
| Real estate expenses |
|
|
33.5 |
% |
|
|
33.2 |
% |
|
|
33.6 |
% |
|
|
32.2 |
% |
|
|
33.7 |
% |
| General and administrative |
|
|
5.3 |
% |
|
|
5.6 |
% |
|
|
5.3 |
% |
|
|
6.0 |
% |
|
|
4.8 |
% |
|
|
|
|
|
|
| Ratios: |
|
|
|
|
|
|
|
|
|
|
|
|
|
|
|
|
|
|
|
|
| Adjusted EBITDA / Interest expense |
|
|
2.9x |
|
|
|
3.0x |
|
|
|
2.8x |
|
|
|
2.7x |
|
|
|
2.8x |
|
| Income from continuing operations attributable to the controlling interest/Total real estate revenue |
|
|
3.8 |
% |
|
|
6.2 |
% |
|
|
3.1 |
% |
|
|
(10.7 |
)% |
|
|
4.8 |
% |
| Net income attributable to the controlling interest/Total real estate revenue |
|
|
87.6 |
% |
|
|
9.1 |
% |
|
|
6.7 |
% |
|
|
16.2 |
% |
|
|
10.2 |
% |
Note: Certain prior quarter amounts have been reclassified to conform to the current quarter presentation.
4

|
|
|
|
|
|
|
|
|
|
|
|
|
|
|
|
|
|
|
|
|
| |
|
9/30/2011 |
|
|
6/30/2011 |
|
|
3/31/2011 |
|
|
12/31/2010 |
|
|
9/30/2010 |
|
| Assets |
|
|
|
|
|
|
|
|
|
|
|
|
|
|
|
|
|
|
|
|
| Land |
|
$ |
472,812 |
|
|
$ |
424,647 |
|
|
$ |
424,647 |
|
|
$ |
381,338 |
|
|
$ |
352,522 |
|
| Income producing property |
|
|
1,924,526 |
|
|
|
1,754,493 |
|
|
|
1,744,993 |
|
|
|
1,670,598 |
|
|
|
1,608,413 |
|
|
|
|
|
|
|
|
|
|
|
|
|
|
|
|
|
|
|
|
|
|
|
|
|
2,397,338 |
|
|
|
2,179,140 |
|
|
|
2,169,640 |
|
|
|
2,051,936 |
|
|
|
1,960,935 |
|
| Accumulated depreciation and amortization |
|
|
(516,319 |
) |
|
|
(497,738 |
) |
|
|
(479,090 |
) |
|
|
(460,678 |
) |
|
|
(443,077 |
) |
|
|
|
|
|
|
|
|
|
|
|
|
|
|
|
|
|
|
|
|
|
| Net income producing property |
|
|
1,881,019 |
|
|
|
1,681,402 |
|
|
|
1,690,550 |
|
|
|
1,591,258 |
|
|
|
1,517,858 |
|
| Development in progress, including land held for development |
|
|
39,735 |
|
|
|
39,413 |
|
|
|
26,263 |
|
|
|
26,240 |
|
|
|
26,103 |
|
|
|
|
|
|
|
|
|
|
|
|
|
|
|
|
|
|
|
|
|
|
| Total real estate held for investment, net |
|
|
1,920,754 |
|
|
|
1,720,815 |
|
|
|
1,716,813 |
|
|
|
1,617,498 |
|
|
|
1,543,961 |
|
|
|
|
|
|
|
| Investment in real estate held for sale, net |
|
|
69,990 |
|
|
|
240,437 |
|
|
|
284,052 |
|
|
|
286,842 |
|
|
|
322,227 |
|
| Cash and cash equivalents |
|
|
40,751 |
|
|
|
42,886 |
|
|
|
12,480 |
|
|
|
78,767 |
|
|
|
262,413 |
|
| Restricted cash |
|
|
23,267 |
|
|
|
22,311 |
|
|
|
23,083 |
|
|
|
20,486 |
|
|
|
18,767 |
|
| Rents and other receivables, net of allowance for doubtful accounts |
|
|
52,396 |
|
|
|
48,472 |
|
|
|
46,864 |
|
|
|
44,280 |
|
|
|
43,814 |
|
| Prepaid expenses and other assets |
|
|
125,689 |
|
|
|
99,356 |
|
|
|
104,093 |
|
|
|
92,040 |
|
|
|
88,020 |
|
| Other assets related to properties sold or held for sale |
|
|
3,505 |
|
|
|
12,899 |
|
|
|
28,827 |
|
|
|
27,968 |
|
|
|
31,777 |
|
|
|
|
|
|
|
|
|
|
|
|
|
|
|
|
|
|
|
|
|
|
| Total assets |
|
$ |
2,236,352 |
|
|
$ |
2,187,176 |
|
|
$ |
2,216,212 |
|
|
$ |
2,167,881 |
|
|
$ |
2,310,979 |
|
|
|
|
|
|
|
|
|
|
|
|
|
|
|
|
|
|
|
|
|
|
|
|
|
|
|
|
| Liabilities and Equity |
|
|
|
|
|
|
|
|
|
|
|
|
|
|
|
|
|
|
|
|
| Notes payable |
|
$ |
657,378 |
|
|
$ |
659,934 |
|
|
$ |
753,692 |
|
|
$ |
753,587 |
|
|
$ |
930,201 |
|
| Mortgage notes payable |
|
|
428,909 |
|
|
|
360,493 |
|
|
|
361,189 |
|
|
|
361,860 |
|
|
|
362,632 |
|
| Lines of credit/short-term note payable |
|
|
193,000 |
|
|
|
245,000 |
|
|
|
160,000 |
|
|
|
100,000 |
|
|
|
100,000 |
|
| Accounts payable and other liabilities |
|
|
55,879 |
|
|
|
54,101 |
|
|
|
57,040 |
|
|
|
49,138 |
|
|
|
51,280 |
|
| Advance rents |
|
|
13,393 |
|
|
|
12,372 |
|
|
|
11,549 |
|
|
|
11,099 |
|
|
|
9,478 |
|
| Tenant security deposits |
|
|
8,751 |
|
|
|
8,027 |
|
|
|
8,024 |
|
|
|
7,390 |
|
|
|
7,376 |
|
|
|
|
|
|
|
| Other liabilities related to properties sold or held for sale |
|
|
19,229 |
|
|
|
24,528 |
|
|
|
24,902 |
|
|
|
23,949 |
|
|
|
25,152 |
|
|
|
|
|
|
|
|
|
|
|
|
|
|
|
|
|
|
|
|
|
|
| Total Liabilities |
|
|
1,376,539 |
|
|
|
1,364,455 |
|
|
|
1,376,396 |
|
|
|
1,307,023 |
|
|
|
1,486,119 |
|
|
|
|
|
|
|
|
|
|
|
|
|
|
|
|
|
|
|
|
|
|
|
|
|
|
|
|
| Equity |
|
|
|
|
|
|
|
|
|
|
|
|
|
|
|
|
|
|
|
|
| Shares of beneficial interest, $0.01 par value; 100,000 shares authorized |
|
|
661 |
|
|
|
661 |
|
|
|
660 |
|
|
|
659 |
|
|
|
642 |
|
| Additional paid-in capital |
|
|
1,136,240 |
|
|
|
1,133,823 |
|
|
|
1,130,297 |
|
|
|
1,127,825 |
|
|
|
1,074,308 |
|
| Distributions in excess of net income |
|
|
(281,930 |
) |
|
|
(316,134 |
) |
|
|
(293,860 |
) |
|
|
(269,935 |
) |
|
|
(251,964 |
) |
| Accumulated other comprehensive income (loss) |
|
|
(160 |
) |
|
|
(636 |
) |
|
|
(1,057 |
) |
|
|
(1,469 |
) |
|
|
(1,906 |
) |
|
|
|
|
|
|
|
|
|
|
|
|
|
|
|
|
|
|
|
|
|
| Total shareholders’ equity |
|
|
854,811 |
|
|
|
817,714 |
|
|
|
836,040 |
|
|
|
857,080 |
|
|
|
821,080 |
|
| Noncontrolling interests in subsidiaries |
|
|
5,002 |
|
|
|
5,007 |
|
|
|
3,776 |
|
|
|
3,778 |
|
|
|
3,780 |
|
|
|
|
|
|
|
|
|
|
|
|
|
|
|
|
|
|
|
|
|
|
| Total equity |
|
|
859,813 |
|
|
|
822,721 |
|
|
|
839,816 |
|
|
|
860,858 |
|
|
|
824,860 |
|
|
|
|
|
|
|
|
|
|
|
|
|
|
|
|
|
|
|
|
|
|
|
|
|
|
|
|
| Total liabilities and equity |
|
$ |
2,236,352 |
|
|
$ |
2,187,176 |
|
|
$ |
2,216,212 |
|
|
$ |
2,167,881 |
|
|
$ |
2,310,979 |
|
|
|
|
|
|
|
|
|
|
|
|
|
|
|
|
|
|
|
|
|
|
|
|
|
|
|
|
| Total Debt / Total Market Capitalization |
|
|
0.41:1 |
|
|
|
0.37:1 |
|
|
|
0.39:1 |
|
|
|
0.38:1 |
|
|
|
0.41:1 |
|
|
|
|
|
|
|
|
|
|
|
|
|
|
|
|
|
|
|
|
|
|
Note: Certain prior quarter amounts have been reclassified to conform to the current quarter presentation.
5

|
|
|
|
|
|
|
|
|
|
|
|
|
|
|
|
|
|
|
|
|
| |
|
Three Months Ended |
|
| |
|
9/30/2011 |
|
|
6/30/2011 |
|
|
3/31/2011 |
|
|
12/31/2010 |
|
|
9/30/2010 |
|
| Funds from operations(1) |
|
|
|
|
|
|
|
|
|
|
|
|
|
|
|
|
|
|
|
|
| Net income (loss) attributable to the controlling interests |
|
$ |
63,008 |
|
|
$ |
6,522 |
|
|
$ |
4,665 |
|
|
$ |
10,591 |
|
|
$ |
6,625 |
|
| Real estate depreciation and amortization |
|
|
23,479 |
|
|
|
22,526 |
|
|
|
21,894 |
|
|
|
20,492 |
|
|
|
20,224 |
|
| Gain from non-disposal activities |
|
|
— |
|
|
|
— |
|
|
|
— |
|
|
|
(3 |
) |
|
|
(4 |
) |
| Discontinued operations: |
|
|
|
|
|
|
|
|
|
|
|
|
|
|
|
|
|
|
|
|
| Gain on sale of real estate |
|
|
(56,639 |
) |
|
|
— |
|
|
|
— |
|
|
|
(13,657 |
) |
|
|
— |
|
| Income tax expense (benefit) |
|
|
(35 |
) |
|
|
1,173 |
|
|
|
— |
|
|
|
— |
|
|
|
— |
|
| Real estate depreciation and amortization |
|
|
943 |
|
|
|
2,933 |
|
|
|
3,355 |
|
|
|
3,699 |
|
|
|
4,054 |
|
|
|
|
|
|
|
|
|
|
|
|
|
|
|
|
|
|
|
|
|
|
| Funds from operations (FFO) |
|
$ |
30,756 |
|
|
$ |
33,154 |
|
|
$ |
29,914 |
|
|
$ |
21,122 |
|
|
$ |
30,899 |
|
|
|
|
|
|
|
|
|
|
|
|
|
|
|
|
|
|
|
|
|
|
| Loss (gain) on extinguishment of debt |
|
|
— |
|
|
|
— |
|
|
|
— |
|
|
|
8,896 |
|
|
|
238 |
|
| Real estate impairment |
|
|
— |
|
|
|
— |
|
|
|
599 |
|
|
|
— |
|
|
|
— |
|
| Acquisition costs |
|
|
1,600 |
|
|
|
322 |
|
|
|
1,649 |
|
|
|
709 |
|
|
|
(12 |
) |
|
|
|
|
|
|
|
|
|
|
|
|
|
|
|
|
|
|
|
|
|
| Core FFO
(1) |
|
$ |
32,356 |
|
|
$ |
33,476 |
|
|
$ |
32,162 |
|
|
$ |
30,727 |
|
|
$ |
31,125 |
|
|
|
|
|
|
|
|
|
|
|
|
|
|
|
|
|
|
|
|
|
|
|
|
|
|
|
|
| Allocation to participating securities(2) |
|
|
(385 |
) |
|
|
(38 |
) |
|
|
(46 |
) |
|
|
(47 |
) |
|
|
(21 |
) |
|
|
|
|
|
|
| FFO per share - basic |
|
$ |
0.46 |
|
|
$ |
0.50 |
|
|
$ |
0.45 |
|
|
$ |
0.33 |
|
|
$ |
0.49 |
|
| FFO per share - fully diluted |
|
$ |
0.46 |
|
|
$ |
0.50 |
|
|
$ |
0.45 |
|
|
$ |
0.33 |
|
|
$ |
0.49 |
|
|
|
|
|
|
|
| Core FFO per share - fully diluted |
|
$ |
0.48 |
|
|
$ |
0.51 |
|
|
$ |
0.49 |
|
|
$ |
0.48 |
|
|
$ |
0.49 |
|
|
|
|
|
|
|
| Funds available for distribution(1) |
|
|
|
|
|
|
|
|
|
|
|
|
|
|
|
|
|
|
|
|
| FFO |
|
$ |
30,756 |
|
|
$ |
33,154 |
|
|
$ |
29,914 |
|
|
$ |
21,122 |
|
|
$ |
30,899 |
|
| Non-cash (gain)/loss on extinguishment of debt |
|
|
— |
|
|
|
— |
|
|
|
— |
|
|
|
2,922 |
|
|
|
238 |
|
| Tenant improvements |
|
|
(2,469 |
) |
|
|
(1,950 |
) |
|
|
(2,370 |
) |
|
|
(6,373 |
) |
|
|
(2,863 |
) |
| Leasing commissions and incentives |
|
|
(3,859 |
) |
|
|
(1,116 |
) |
|
|
(2,232 |
) |
|
|
(2,089 |
) |
|
|
(3,387 |
) |
| Recurring capital improvements |
|
|
(2,148 |
) |
|
|
(3,072 |
) |
|
|
(691 |
) |
|
|
(1,698 |
) |
|
|
(1,377 |
) |
| Straight-line rent, net |
|
|
(715 |
) |
|
|
(586 |
) |
|
|
(657 |
) |
|
|
(951 |
) |
|
|
(1,099 |
) |
| Non-cash fair value interest expense |
|
|
145 |
|
|
|
191 |
|
|
|
179 |
|
|
|
345 |
|
|
|
760 |
|
| Non-real estate depreciation and amortization |
|
|
1,126 |
|
|
|
888 |
|
|
|
874 |
|
|
|
889 |
|
|
|
1,094 |
|
| Amortization of lease intangibles, net |
|
|
(329 |
) |
|
|
(413 |
) |
|
|
(278 |
) |
|
|
(437 |
) |
|
|
(413 |
) |
| Amortization and expensing of restricted share and unit compensation |
|
|
1,376 |
|
|
|
1,488 |
|
|
|
1,257 |
|
|
|
1,553 |
|
|
|
1,311 |
|
| Real estate impairment |
|
|
— |
|
|
|
— |
|
|
|
599 |
|
|
|
— |
|
|
|
— |
|
|
|
|
|
|
|
|
|
|
|
|
|
|
|
|
|
|
|
|
|
|
| Funds available for distribution (FAD) |
|
$ |
23,883 |
|
|
$ |
28,584 |
|
|
$ |
26,595 |
|
|
$ |
15,283 |
|
|
$ |
25,163 |
|
|
|
|
|
|
|
|
|
|
|
|
|
|
|
|
|
|
|
|
|
|
| Cash loss (gain) on extinguishment of debt |
|
|
— |
|
|
|
— |
|
|
|
— |
|
|
|
5,974 |
|
|
|
— |
|
| Acquisition costs |
|
|
1,600 |
|
|
|
322 |
|
|
|
1,649 |
|
|
|
709 |
|
|
|
(12 |
) |
|
|
|
|
|
|
|
|
|
|
|
|
|
|
|
|
|
|
|
|
|
| Core FAD
(1) |
|
$ |
25,483 |
|
|
$ |
28,906 |
|
|
$ |
28,244 |
|
|
$ |
21,966 |
|
|
$ |
25,151 |
|
|
|
|
|
|
|
|
|
|
|
|
|
|
|
|
|
|
|
|
|
|
|
|
|
|
|
|
| Allocation to participating securities(2) |
|
|
(385 |
) |
|
|
(38 |
) |
|
|
(46 |
) |
|
|
(47 |
) |
|
|
(21 |
) |
|
|
|
|
|
|
| FAD per share - basic |
|
$ |
0.36 |
|
|
$ |
0.43 |
|
|
$ |
0.40 |
|
|
$ |
0.24 |
|
|
$ |
0.40 |
|
| FAD per share - fully diluted |
|
$ |
0.36 |
|
|
$ |
0.43 |
|
|
$ |
0.40 |
|
|
$ |
0.24 |
|
|
$ |
0.40 |
|
|
|
|
|
|
|
| Core FAD per share - fully diluted |
|
$ |
0.38 |
|
|
$ |
0.44 |
|
|
$ |
0.43 |
|
|
$ |
0.34 |
|
|
$ |
0.40 |
|
|
|
|
|
|
|
| Common dividend per share |
|
$ |
0.4338 |
|
|
$ |
0.4338 |
|
|
$ |
0.4338 |
|
|
$ |
0.4338 |
|
|
$ |
0.4325 |
|
|
|
|
|
|
|
| Average shares - basic |
|
|
66,017 |
|
|
|
65,954 |
|
|
|
65,885 |
|
|
|
64,536 |
|
|
|
62,894 |
|
| Average shares - fully diluted |
|
|
66,064 |
|
|
|
65,989 |
|
|
|
65,907 |
|
|
|
64,536 |
|
|
|
63,055 |
|
| (1) |
See
“Supplemental Definitions” on page 27 of this supplemental for the definitions of FFO, Core FFO, FAD and Core FAD. |
| (2) |
Adjustment to the numerators for FFO, Core FFO, FAD and Core FAD per share calculations when applying the two-class method for calculating EPS.
|
6

|
|
|
|
|
|
|
|
|
|
|
|
|
|
|
|
|
|
|
|
|
| |
|
Three Months Ended |
|
| |
|
9/30/2011 |
|
|
6/30/2011 |
|
|
3/31/2011 |
|
|
12/31/2010 |
|
|
9/30/2010 |
|
| Adjusted EBITDA(1) |
|
|
|
|
|
|
|
|
|
|
|
|
|
|
|
|
|
|
|
|
|
|
|
|
|
|
| Net income attributable to the controlling interests |
|
$ |
63,008 |
|
|
$ |
6,522 |
|
|
$ |
4,665 |
|
|
$ |
10,591 |
|
|
$ |
6,625 |
|
| Add: |
|
|
|
|
|
|
|
|
|
|
|
|
|
|
|
|
|
|
|
|
| Interest expense, including discontinued operations |
|
|
16,739 |
|
|
|
17,097 |
|
|
|
17,126 |
|
|
|
17,801 |
|
|
|
17,100 |
|
| Real estate depreciation and amortization, including discontinued operations |
|
|
24,422 |
|
|
|
25,459 |
|
|
|
25,249 |
|
|
|
24,191 |
|
|
|
24,278 |
|
| Income tax expense (benefit) |
|
|
(27 |
) |
|
|
1,173 |
|
|
|
— |
|
|
|
— |
|
|
|
— |
|
| Real estate impairment |
|
|
— |
|
|
|
— |
|
|
|
599 |
|
|
|
— |
|
|
|
— |
|
| Non-real estate depreciation |
|
|
243 |
|
|
|
248 |
|
|
|
268 |
|
|
|
279 |
|
|
|
277 |
|
| Less: |
|
|
|
|
|
|
|
|
|
|
|
|
|
|
|
|
|
|
|
|
| Gain on sale of real estate |
|
|
(56,639 |
) |
|
|
— |
|
|
|
— |
|
|
|
(13,657 |
) |
|
|
— |
|
| Loss (gain) on extinguishment of debt |
|
|
— |
|
|
|
— |
|
|
|
— |
|
|
|
8,896 |
|
|
|
238 |
|
| Gain from non-disposal activities |
|
|
— |
|
|
|
— |
|
|
|
— |
|
|
|
(3 |
) |
|
|
(4 |
) |
|
|
|
|
|
|
|
|
|
|
|
|
|
|
|
|
|
|
|
|
|
|
|
|
|
|
|
| Adjusted EBITDA |
|
$ |
47,746 |
|
|
$ |
50,499 |
|
|
$ |
47,907 |
|
|
$ |
48,098 |
|
|
$ |
48,514 |
|
|
|
|
|
|
|
|
|
|
|
|
|
|
|
|
|
|
|
|
|
|
| (1) |
Adjusted EBITDA is earnings before interest expense, taxes, depreciation, amortization, gain on sale of real estate, gain/loss on extinguishment of debt and gain from
non-disposal activities. We consider Adjusted EBITDA to be an appropriate supplemental performance measure because it permits investors to view income from operations without the effect of depreciation, the cost of debt or non-operating gains and
losses. Adjusted EBITDA is a non-GAAP measure. |
7

|
|
|
|
|
|
|
|
|
|
|
|
|
|
|
|
|
|
|
|
|
| |
|
9/30/2011 |
|
|
6/30/2011 |
|
|
3/31/2011 |
|
|
12/31/2010 |
|
|
9/30/2010 |
|
| Balances Outstanding |
|
|
|
|
|
|
|
|
|
|
|
|
|
|
|
|
|
|
|
|
|
|
|
|
|
|
| Secured |
|
|
|
|
|
|
|
|
|
|
|
|
|
|
|
|
|
|
|
|
| Conventional fixed rate(1) |
|
$ |
446,715 |
|
|
$ |
378,469 |
|
|
$ |
379,333 |
|
|
$ |
380,171 |
|
|
$ |
381,109 |
|
|
|
|
|
|
|
|
|
|
|
|
|
|
|
|
|
|
|
|
|
|
| Secured total |
|
|
446,715 |
|
|
|
378,469 |
|
|
|
379,333 |
|
|
|
380,171 |
|
|
|
381,109 |
|
|
|
|
|
|
|
|
|
|
|
|
|
|
|
|
|
|
|
|
|
|
| Unsecured |
|
|
|
|
|
|
|
|
|
|
|
|
|
|
|
|
|
|
|
|
| Fixed rate bonds and notes |
|
|
657,378 |
|
|
|
659,934 |
|
|
|
753,692 |
|
|
|
753,587 |
|
|
|
930,201 |
|
| Credit facility |
|
|
193,000 |
|
|
|
245,000 |
|
|
|
160,000 |
|
|
|
100,000 |
|
|
|
100,000 |
|
|
|
|
|
|
|
|
|
|
|
|
|
|
|
|
|
|
|
|
|
|
| Unsecured total |
|
|
850,378 |
|
|
|
904,934 |
|
|
|
913,692 |
|
|
|
853,587 |
|
|
|
1,030,201 |
|
|
|
|
|
|
|
|
|
|
|
|
|
|
|
|
|
|
|
|
|
|
| Total |
|
$ |
1,297,093 |
|
|
$ |
1,283,403 |
|
|
$ |
1,293,025 |
|
|
$ |
1,233,758 |
|
|
$ |
1,411,310 |
|
|
|
|
|
|
|
|
|
|
|
|
|
|
|
|
|
|
|
|
|
|
|
|
|
|
|
|
| Average Interest Rates |
|
|
|
|
|
|
|
|
|
|
|
|
|
|
|
|
|
|
|
|
|
|
|
|
|
|
| Secured |
|
|
|
|
|
|
|
|
|
|
|
|
|
|
|
|
|
|
|
|
| Conventional fixed rate |
|
|
5.9 |
% |
|
|
5.9 |
% |
|
|
5.9 |
% |
|
|
5.9 |
% |
|
|
5.9 |
% |
|
|
|
|
|
|
|
|
|
|
|
|
|
|
|
|
|
|
|
|
|
| Secured total |
|
|
5.9 |
% |
|
|
5.9 |
% |
|
|
5.9 |
% |
|
|
5.9 |
% |
|
|
5.9 |
% |
|
|
|
|
|
|
|
|
|
|
|
|
|
|
|
|
|
|
|
|
|
| Unsecured |
|
|
|
|
|
|
|
|
|
|
|
|
|
|
|
|
|
|
|
|
| Fixed rate bonds |
|
|
5.4 |
% |
|
|
5.4 |
% |
|
|
5.4 |
% |
|
|
5.4 |
% |
|
|
5.5 |
% |
| Credit facilities(2) |
|
|
2.1 |
% |
|
|
1.4 |
% |
|
|
1.8 |
% |
|
|
2.5 |
% |
|
|
2.5 |
% |
|
|
|
|
|
|
|
|
|
|
|
|
|
|
|
|
|
|
|
|
|
| Unsecured total |
|
|
4.6 |
% |
|
|
4.3 |
% |
|
|
4.8 |
% |
|
|
5.1 |
% |
|
|
5.2 |
% |
|
|
|
|
|
|
|
|
|
|
|
|
|
|
|
|
|
|
|
|
|
| Average |
|
|
5.1 |
% |
|
|
4.8 |
% |
|
|
5.1 |
% |
|
|
5.4 |
% |
|
|
5.4 |
% |
|
|
|
|
|
|
|
|
|
|
|
|
|
|
|
|
|
|
|
|
|
Note: The current balances outstanding of the secured and unsecured fixed rate bonds and notes are shown net of
discounts/premiums in the amount of $4.4 million and $2.6 million, respectively.
| (1) |
Balances include the mortgage notes secured by Dulles Business Park, a property which held for sale as of September 30, 2011, and has been
reclassified to “Other liabilities related to properties sold or held for sale.” We repaid this mortgage note on October 7, 2011. |
| (2) |
On December 1, 2009, we borrowed $100.0 million on our lines of credit in order to prepay a $100.0 million term loan. From February 20, 2010
through June 30, 2011, an interest rate swap effectively fixed the interest rate at 2.525%. From July 1, 2011 through November 1, 2011, the interest rate swap effectively fixes the interest rate at 2.845%.
|
8

|
|
|
|
|
|
|
|
|
|
|
|
|
|
|
|
|
|
|
|
|
| |
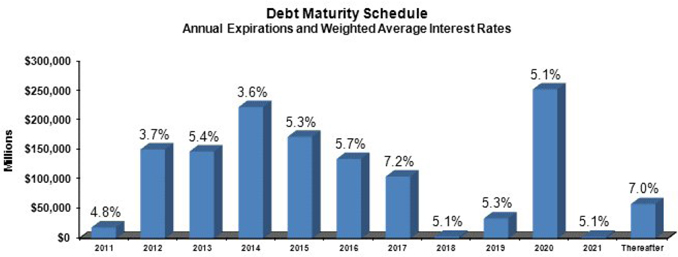
|
Future Maturities of Debt |
|
| Year |
|
Secured Debt |
|
|
Unsecured
Debt |
|
|
Credit
Facilities |
|
|
Total Debt |
|
|
Average Interest
Rate |
|
| 2011 |
|
$ |
18,952 |
(1) |
|
$ |
— |
|
|
|
— |
|
|
$ |
18,952 |
|
|
|
4.8 |
% |
| 2012 |
|
|
27,000 |
|
|
|
50,000 |
|
|
|
74,000 |
|
|
|
151,000 |
|
|
|
3.7 |
% |
| 2013 |
|
|
87,580 |
|
|
|
60,000 |
|
|
|
— |
|
|
|
147,580 |
|
|
|
5.4 |
% |
| 2014 |
|
|
3,724 |
|
|
|
100,000 |
|
|
|
119,000 |
|
|
|
222,724 |
|
|
|
3.6 |
% |
| 2015 |
|
|
22,390 |
|
|
|
150,000 |
|
|
|
— |
|
|
|
172,390 |
|
|
|
5.3 |
% |
| 2016 |
|
|
134,943 |
|
|
|
— |
|
|
|
— |
|
|
|
134,943 |
|
|
|
5.7 |
% |
| 2017 |
|
|
104,953 |
|
|
|
— |
|
|
|
— |
|
|
|
104,953 |
|
|
|
7.2 |
% |
| 2018 |
|
|
3,277 |
|
|
|
— |
|
|
|
— |
|
|
|
3,277 |
|
|
|
5.1 |
% |
| 2019 |
|
|
34,060 |
|
|
|
— |
|
|
|
— |
|
|
|
34,060 |
|
|
|
5.3 |
% |
| 2020 |
|
|
2,818 |
|
|
|
250,000 |
|
|
|
— |
|
|
|
252,818 |
|
|
|
5.1 |
% |
| 2021 |
|
|
2,997 |
|
|
|
— |
|
|
|
— |
|
|
|
2,997 |
|
|
|
5.1 |
% |
| Thereafter |
|
|
8,443 |
|
|
|
50,000 |
|
|
|
— |
|
|
|
58,443 |
|
|
|
7.0 |
% |
|
|
|
|
|
|
|
|
|
|
|
|
|
|
|
|
|
|
|
|
|
| Total maturities |
|
$ |
451,137 |
|
|
$ |
660,000 |
|
|
$ |
193,000 |
|
|
$ |
1,304,137 |
|
|
|
5.1 |
% |
|
|
|
|
|
|
|
|
|
|
|
|
|
|
|
|
|
|
|
|
|
Weighted average maturity = 5.0 years
| (1) |
WRIT prepaid the remaining principal on the Dulles Business Park mortgages subsequent to the end of Q3 2011. |
9

|
|
|
|
|
|
|
|
|
|
|
|
|
|
|
|
|
|
|
|
|
|
|
|
|
| |
|
Unsecured Notes Payable |
|
|
Unsecured Line of Credit #1
($75.0 million) |
|
|
Unsecured Line of Credit #2
($400.0 million) |
|
| |
|
Quarter Ended
September 30,
2011 |
|
|
Covenant |
|
|
Quarter Ended
September 30,
2011 |
|
|
Covenant |
|
|
Quarter Ended
September 30,
2011 |
|
|
Covenant |
|
| % of Total Indebtedness to Total Assets(1) |
|
|
43.7 |
% |
|
|
£ 65.0 |
% |
|
|
N/A |
|
|
|
N/A |
|
|
|
N/A |
|
|
|
N/A |
|
| Ratio of Income Available for Debt Service to Annual Debt Service |
|
|
2.9 |
|
|
|
³ 1.5 |
|
|
|
N/A |
|
|
|
N/A |
|
|
|
N/A |
|
|
|
N/A |
|
| % of Secured Indebtedness to Total Assets(1) |
|
|
14.6 |
% |
|
|
£ 40.0 |
% |
|
|
N/A |
|
|
|
N/A |
|
|
|
N/A |
|
|
|
N/A |
|
| Ratio of Total Unencumbered Assets(2) to Total Unsecured Indebtedness |
|
|
2.5 |
|
|
|
³ 1.5 |
|
|
|
N/A |
|
|
|
N/A |
|
|
|
N/A |
|
|
|
N/A |
|
| Tangible Net Worth(3) |
|
|
N/A |
|
|
|
N/A |
|
|
|
$1.1 billion |
|
|
|
³ $808.6 million |
|
|
$ |
820.6 million |
|
|
|
³ $671.9 million |
|
| % of Total Liabilities to Gross Asset Value(5) |
|
|
N/A |
|
|
|
N/A |
|
|
|
53.6 |
% |
|
|
£ 60.0 |
% |
|
|
52.1 |
% |
|
|
£ 60.0 |
% |
| % of Secured Indebtedness to Gross Asset Value(5) |
|
|
N/A |
|
|
|
N/A |
|
|
|
16.7 |
% |
|
|
£ 35.0 |
% |
|
|
16.2 |
% |
|
|
£ 35.0 |
% |
| Ratio of EBITDA(4) to Fixed Charges(6) |
|
|
N/A |
|
|
|
N/A |
|
|
|
2.59 |
|
|
|
³ 1.75 |
|
|
|
2.59 |
|
|
|
³ 1.50 |
|
| Ratio of Unencumbered Pool Value(8) to Unsecured Indebtedness |
|
|
N/A |
|
|
|
N/A |
|
|
|
2.44 |
|
|
|
³ 1.67 |
|
|
|
2.41 |
|
|
|
³ 1.67 |
|
| Ratio of Unencumbered Net Operating Income to Unsecured Interest Expense |
|
|
N/A |
|
|
|
N/A |
|
|
|
N/A |
|
|
|
N/A |
|
|
|
3.43 |
|
|
|
³ 2.00 |
|
| % of Development in Progress to Gross Asset Value(5) |
|
|
N/A |
|
|
|
N/A |
|
|
|
1.5 |
% |
|
|
£ 30.0 |
% |
|
|
N/A |
|
|
|
N/A |
|
| % of Non-Wholly Owned Assets(7) to Gross Asset Value(5) |
|
|
N/A |
|
|
|
N/A |
|
|
|
1.8 |
% |
|
|
£ 15.0 |
% |
|
|
N/A |
|
|
|
N/A |
|
| Ratio of Investments(9) to Gross Asset Value(5) |
|
|
N/A |
|
|
|
N/A |
|
|
|
N/A |
|
|
|
N/A |
|
|
|
1.5 |
% |
|
|
£ 15.0 |
% |
| (1) |
Total Assets is calculated by applying a capitalization rate of 7.50% to the EBITDA(4) from the last four consecutive quarters, excluding EBITDA from acquired, disposed, and non-stabilized development
properties. |
| (2) |
Total Unencumbered Assets is calculated by applying a capitalization rate of 7.50% to the
EBITDA(4) from unencumbered properties from the last four
consecutive quarters, excluding EBITDA from acquired, disposed, and non-stabilized development properties. |
| (3) |
Tangible Net Worth is defined as shareholders equity less accumulated depreciation at the commitment start date plus current accumulated depreciation.
|
| (4) |
EBITDA is defined in our debt covenants as earnings before minority interests, depreciation, amortization, interest expense, income tax expense, and
extraordinary and nonrecurring gains and losses. |
| (5) |
Gross Asset Value is calculated by applying a capitalization rate to the annualized EBITDA(4) from the most recently ended quarter, excluding EBITDA from disposed properties and current quarter acquisitions. To
this amount, the purchase price of current quarter acquisitions, cash and cash equivalents and development in progress is added. |
| (6) |
Fixed Charges consist of interest expense, principal payments, ground lease payments and replacement reserve payments. |
| (7) |
Non-Wholly Owned Assets is calculated by applying a capitalization rate of 7.50% to the
EBITDA(4) from properties subject to a joint operating
agreement (i.e. NVIP I&II). We add to this amount the development in progress subject to a joint operating agreement (i.e. 4661 Kenmore Avenue). |
| (8) |
Unencumbered Pool Value is calculated by applying a capitalization rate of 7.75% to the net operating income from unencumbered properties owned for the
entire quarter. To this we add the purchase price of unencumbered acquisitions during the current quarter and, for Unsecured Line of Credit #1 only, development in progress. |
| (9) |
Investments is defined as development in progress, including land held for development, plus budgeted development costs upon commencement of
construction, if any. |
10

|
|
|
|
|
|
|
|
|
|
|
|
|
|
|
|
|
|
|
|
|
| |
|
9/30/2011 |
|
|
6/30/2011 |
|
|
3/31/2011 |
|
|
12/31/2010 |
|
|
9/30/2010 |
|
| Market Data |
|
|
|
|
|
|
|
|
|
|
|
|
|
|
|
|
|
|
|
|
|
|
|
|
|
|
| Shares Outstanding |
|
|
66,066 |
|
|
|
66,017 |
|
|
|
65,941 |
|
|
|
65,870 |
|
|
|
64,093 |
|
| Market Price per Share |
|
$ |
28.18 |
|
|
$ |
32.52 |
|
|
$ |
31.09 |
|
|
$ |
30.99 |
|
|
$ |
31.73 |
|
| Equity Market Capitalization |
|
$ |
1,861,740 |
|
|
$ |
2,146,873 |
|
|
$ |
2,050,106 |
|
|
$ |
2,041,311 |
|
|
$ |
2,033,671 |
|
|
|
|
|
|
|
| Total Debt (1) |
|
$ |
1,297,093 |
|
|
$ |
1,283,403 |
|
|
$ |
1,293,025 |
|
|
$ |
1,233,758 |
|
|
$ |
1,411,310 |
|
|
|
|
|
|
|
| Total Market Capitalization |
|
$ |
3,158,833 |
|
|
$ |
3,430,276 |
|
|
$ |
3,343,131 |
|
|
$ |
3,275,069 |
|
|
$ |
3,444,981 |
|
|
|
|
|
|
|
| Total Debt to Market Capitalization |
|
|
0.41:1 |
|
|
|
0.37:1 |
|
|
|
0.39:1 |
|
|
|
0.38:1 |
|
|
|
0.41:1 |
|
|
|
|
|
|
|
|
|
|
|
|
|
|
|
|
|
|
|
|
|
|
|
|
|
|
|
|
| Earnings to Fixed Charges(2) |
|
|
1.1x |
|
|
|
1.3x |
|
|
|
1.1x |
|
|
|
0.6x |
|
|
|
1.2x |
|
| Debt Service Coverage Ratio(3) |
|
|
2.7x |
|
|
|
2.8x |
|
|
|
2.6x |
|
|
|
2.5x |
|
|
|
2.7x |
|
|
|
|
|
|
|
| Dividend Data |
|
|
|
|
|
|
|
|
|
|
|
|
|
|
|
|
|
|
|
|
|
|
|
|
|
|
| Total Dividends Paid |
|
$ |
28,641 |
|
|
$ |
28,621 |
|
|
$ |
28,587 |
|
|
$ |
28,438 |
|
|
$ |
27,485 |
|
| Common Dividend per Share |
|
$ |
0.43 |
|
|
$ |
0.43 |
|
|
$ |
0.43 |
|
|
$ |
0.43 |
|
|
$ |
0.43 |
|
| Payout Ratio (Core FFO per share basis) |
|
|
90.4 |
% |
|
|
85.0 |
% |
|
|
88.5 |
% |
|
|
90.4 |
% |
|
|
88.3 |
% |
| Payout Ratio (Core FAD per share basis) |
|
|
114.1 |
% |
|
|
98.6 |
% |
|
|
100.9 |
% |
|
|
127.6 |
% |
|
|
108.1 |
% |
| Payout Ratio (FAD per share basis) |
|
|
120.5 |
% |
|
|
100.9 |
% |
|
|
108.4 |
% |
|
|
180.7 |
% |
|
|
108.1 |
% |
| (1) |
“Total
Debt” balance includes a $17.8 million mortgage notes payable secured by Dulles Business Park, that has been reclassified to “Other liabilities related to properties sold or held for sale”. We repaid this mortgage note on
October 7, 2011. |
| (2) |
The ratio of
earnings to fixed charges is computed by dividing earnings by fixed charges. For this purpose, earnings consist of income from continuing operations attributable to the controlling interests plus fixed charges, less capitalized interest. Fixed
charges consist of interest expense, including amortized costs of debt issuance, plus interest costs capitalized. |
| (3) |
Debt service
coverage ratio is computed by dividing Adjusted EBITDA (see page 7) by interest expense and principal amortization. |
11

|
|
|
|
|
|
|
|
|
|
|
|
|
|
|
|
|
| |
|
Third Quarter(1) |
|
|
Year to Date(2) |
|
| |
|
NOI Growth |
|
|
Rental Rate
Growth |
|
|
NOI Growth |
|
|
Rental Rate
Growth |
|
| Cash Basis: |
|
|
|
|
|
|
|
|
|
|
|
|
|
|
|
|
| Multifamily |
|
|
1.2 |
% |
|
|
4.4 |
% |
|
|
6.9 |
% |
|
|
3.8 |
% |
| Office Buildings |
|
|
4.4 |
% |
|
|
2.0 |
% |
|
|
2.1 |
% |
|
|
2.2 |
% |
| Medical Office Buildings |
|
|
1.4 |
% |
|
|
3.1 |
% |
|
|
1.2 |
% |
|
|
3.3 |
% |
| Retail Centers |
|
|
(3.2 |
)% |
|
|
1.0 |
% |
|
|
(3.6 |
)% |
|
|
1.1 |
% |
|
|
|
|
|
| Overall Same-Store Portfolio |
|
|
1.9 |
% |
|
|
2.5 |
% |
|
|
1.7 |
% |
|
|
2.5 |
% |
|
|
|
| |
|
Third Quarter(1) |
|
|
Year to Date(2) |
|
| |
|
NOI Growth |
|
|
Rental Rate
Growth |
|
|
NOI Growth |
|
|
Rental Rate
Growth |
|
| GAAP Basis: |
|
|
|
|
|
|
|
|
|
|
|
|
|
|
|
|
| Multifamily |
|
|
1.0 |
% |
|
|
4.3 |
% |
|
|
6.7 |
% |
|
|
3.8 |
% |
| Office Buildings |
|
|
1.3 |
% |
|
|
1.0 |
% |
|
|
(0.5 |
)% |
|
|
1.1 |
% |
| Medical Office Buildings |
|
|
2.4 |
% |
|
|
3.2 |
% |
|
|
1.8 |
% |
|
|
3.6 |
% |
| Retail Centers |
|
|
(3.4 |
)% |
|
|
0.9 |
% |
|
|
(3.5 |
)% |
|
|
1.2 |
% |
|
|
|
|
|
| Overall Same-Store Portfolio |
|
|
0.6 |
% |
|
|
2.0 |
% |
|
|
0.6 |
% |
|
|
2.1 |
% |
| (1) |
Non same-store properties were: |
Acquisitions:
Office - 1140 Connecticut Avenue, 1227 25th Street, Braddock Metro
Center and John Marshall II.
Retail - Gateway Overlook, Olney Village Center.
Medical Office - Lansdowne Medical Office Building.
Held for sale and sold properties:
Office - Dulles Station, Phase I.
Industrial/Office - Industrial Portfolio (see page 27 of this Supplement).
| (2) |
Non same-store
properties were: |
Acquisitions:
Office - Quantico Corporate Center, 1140 Connecticut Avenue, 1227 25th Street, Braddock Metro Center and John Marshall II.
Retail - Gateway Overlook, Olney Village Center.
Medical Office - Lansdowne
Medical Office Building.
Held for sale and sold properties:
Office - Parklawn Plaza, Lexington, Saratoga, Ridges, and Dulles Station, Phase I.
Industrial/Office - Charleston, Ammendale I & II, Amvax, and the Industrial Portfolio (see page 27 of this Supplement).
12

|
|
|
|
|
|
|
|
|
|
|
|
|
| |
|
Three Months Ended September 30, |
|
| |
|
2011 |
|
|
2010 |
|
|
% Change |
|
|
|
|
|
| Cash Basis: |
|
|
|
|
|
|
|
|
|
|
|
|
| Multifamily |
|
$ |
7,519 |
|
|
$ |
7,432 |
|
|
|
1.2 |
% |
| Office Buildings |
|
|
20,108 |
|
|
|
19,261 |
|
|
|
4.4 |
% |
| Medical Office Buildings |
|
|
7,376 |
|
|
|
7,272 |
|
|
|
1.4 |
% |
| Retail Centers |
|
|
7,455 |
|
|
|
7,698 |
|
|
|
(3.2 |
)% |
|
|
|
|
|
|
|
|
|
|
|
|
|
|
|
$ |
42,458 |
|
|
$ |
41,663 |
|
|
|
1.9 |
% |
|
|
|
|
|
|
|
|
|
|
|
|
|
|
|
|
|
| GAAP Basis: |
|
|
|
|
|
|
|
|
|
|
|
|
| Multifamily |
|
$ |
7,714 |
|
|
$ |
7,636 |
|
|
|
1.0 |
% |
| Office Buildings |
|
|
20,558 |
|
|
|
20,289 |
|
|
|
1.3 |
% |
| Medical Office Buildings |
|
|
7,658 |
|
|
|
7,480 |
|
|
|
2.4 |
% |
| Retail Centers |
|
|
7,570 |
|
|
|
7,837 |
|
|
|
(3.4 |
)% |
|
|
|
|
|
|
|
|
|
|
|
|
|
|
|
$ |
43,500 |
|
|
$ |
43,242 |
|
|
|
0.6 |
% |
|
|
|
|
|
|
|
|
|
|
|
|
|
13

|
|
|
|
|
|
|
|
|
|
|
|
|
|
|
|
|
|
|
|
|
|
|
|
|
|
|
|
|
| |
|
Three Months Ended September 30, 2011 |
|
| |
|
Multifamily |
|
|
Office |
|
|
Medical
Office |
|
|
Retail |
|
|
Industrial/Flex |
|
|
Corporate
and Other |
|
|
Total |
|
| Real estate rental revenue |
|
|
|
|
|
|
|
|
|
|
|
|
|
|
|
|
|
|
|
|
|
|
|
|
|
|
|
|
| Same-store portfolio |
|
$ |
12,871 |
|
|
$ |
31,306 |
|
|
$ |
11,167 |
|
|
$ |
10,139 |
|
|
$ |
— |
|
|
|
— |
|
|
$ |
65,483 |
|
| Non same-store - acquired and in development(1) |
|
|
— |
|
|
|
3,903 |
|
|
|
184 |
|
|
|
2,361 |
|
|
|
— |
|
|
|
— |
|
|
|
6,448 |
|
|
|
|
|
|
|
|
|
|
|
|
|
|
|
|
|
|
|
|
|
|
|
|
|
|
|
|
|
|
| Total |
|
|
12,871 |
|
|
|
35,209 |
|
|
|
11,351 |
|
|
|
12,500 |
|
|
|
— |
|
|
|
— |
|
|
|
71,931 |
|
|
|
|
|
|
|
|
|
| Real estate expenses |
|
|
|
|
|
|
|
|
|
|
|
|
|
|
|
|
|
|
|
|
|
|
|
|
|
|
|
|
| Same-store portfolio |
|
|
5,157 |
|
|
|
10,748 |
|
|
|
3,509 |
|
|
|
2,569 |
|
|
|
— |
|
|
|
— |
|
|
|
21,983 |
|
| Non same-store - acquired and in development(1) |
|
|
— |
|
|
|
1,442 |
|
|
|
147 |
|
|
|
498 |
|
|
|
— |
|
|
|
— |
|
|
|
2,087 |
|
|
|
|
|
|
|
|
|
|
|
|
|
|
|
|
|
|
|
|
|
|
|
|
|
|
|
|
|
|
| Total |
|
|
5,157 |
|
|
|
12,190 |
|
|
|
3,656 |
|
|
|
3,067 |
|
|
|
— |
|
|
|
— |
|
|
|
24,070 |
|
|
|
|
|
|
|
|
|
| Net Operating Income (NOI) |
|
|
|
|
|
|
|
|
|
|
|
|
|
|
|
|
|
|
|
|
|
|
|
|
|
|
|
|
| Same-store portfolio |
|
|
7,714 |
|
|
|
20,558 |
|
|
|
7,658 |
|
|
|
7,570 |
|
|
|
— |
|
|
|
— |
|
|
|
43,500 |
|
| Non same-store - acquired and in development(1) |
|
|
— |
|
|
|
2,461 |
|
|
|
37 |
|
|
|
1,863 |
|
|
|
— |
|
|
|
— |
|
|
|
4,361 |
|
|
|
|
|
|
|
|
|
|
|
|
|
|
|
|
|
|
|
|
|
|
|
|
|
|
|
|
|
|
| Total |
|
$ |
7,714 |
|
|
$ |
23,019 |
|
|
$ |
7,695 |
|
|
$ |
9,433 |
|
|
$ |
— |
|
|
|
— |
|
|
$ |
47,861 |
|
|
|
|
|
|
|
|
|
|
|
|
|
|
|
|
|
|
|
|
|
|
|
|
|
|
|
|
|
|
|
|
|
|
|
|
|
|
| Same-store portfolio NOI GAAP basis (from above) |
|
$ |
7,714 |
|
|
$ |
20,558 |
|
|
$ |
7,658 |
|
|
$ |
7,570 |
|
|
$ |
— |
|
|
|
— |
|
|
$ |
43,500 |
|
| Straight-line revenue, net for same-store properties |
|
|
(3 |
) |
|
|
(295 |
) |
|
|
(196 |
) |
|
|
(57 |
) |
|
|
— |
|
|
|
— |
|
|
|
(551 |
) |
| FAS 141 Min Rent |
|
|
(192 |
) |
|
|
(274 |
) |
|
|
(96 |
) |
|
|
(77 |
) |
|
|
— |
|
|
|
— |
|
|
|
(639 |
) |
| Amortization of lease intangibles for same-store properties |
|
|
— |
|
|
|
119 |
|
|
|
10 |
|
|
|
19 |
|
|
|
— |
|
|
|
— |
|
|
|
148 |
|
|
|
|
|
|
|
|
|
|
|
|
|
|
|
|
|
|
|
|
|
|
|
|
|
|
|
|
|
|
| Same-store portfolio NOI, cash basis |
|
$ |
7,519 |
|
|
$ |
20,108 |
|
|
$ |
7,376 |
|
|
$ |
7,455 |
|
|
$ |
— |
|
|
|
— |
|
|
$ |
42,458 |
|
|
|
|
|
|
|
|
|
|
|
|
|
|
|
|
|
|
|
|
|
|
|
|
|
|
|
|
|
|
|
|
|
|
|
|
|
|
| Reconciliation of NOI to net income |
|
|
|
|
|
|
|
|
|
|
|
|
|
|
|
|
|
|
|
|
|
|
|
|
|
|
|
|
| Total NOI |
|
$ |
7,714 |
|
|
$ |
23,019 |
|
|
$ |
7,695 |
|
|
$ |
9,433 |
|
|
$ |
— |
|
|
|
— |
|
|
$ |
47,861 |
|
| Other income |
|
|
— |
|
|
|
— |
|
|
|
— |
|
|
|
— |
|
|
|
— |
|
|
|
270 |
|
|
|
270 |
|
| Acquisition costs |
|
|
— |
|
|
|
— |
|
|
|
— |
|
|
|
— |
|
|
|
— |
|
|
|
(1,600 |
) |
|
|
(1,600 |
) |
| Interest expense |
|
|
(1,719 |
) |
|
|
(2,405 |
) |
|
|
(1,251 |
) |
|
|
(420 |
) |
|
|
— |
|
|
|
(10,713 |
) |
|
|
(16,508 |
) |
| Depreciation and amortization |
|
|
(3,175 |
) |
|
|
(12,772 |
) |
|
|
(3,828 |
) |
|
|
(3,170 |
) |
|
|
— |
|
|
|
(534 |
) |
|
|
(23,479 |
) |
| General and administrative |
|
|
— |
|
|
|
— |
|
|
|
— |
|
|
|
— |
|
|
|
— |
|
|
|
(3,837 |
) |
|
|
(3,837 |
) |
| Discontinued operations(2) |
|
|
— |
|
|
|
330 |
|
|
|
— |
|
|
|
— |
|
|
|
3,325 |
|
|
|
— |
|
|
|
3,655 |
|
| Income tax benefit (expense) |
|
|
— |
|
|
|
— |
|
|
|
— |
|
|
|
— |
|
|
|
— |
|
|
|
35 |
|
|
|
35 |
|
| Gain on sale of real estate |
|
|
— |
|
|
|
— |
|
|
|
— |
|
|
|
— |
|
|
|
— |
|
|
|
56,639 |
|
|
|
56,639 |
|
|
|
|
|
|
|
|
|
|
|
|
|
|
|
|
|
|
|
|
|
|
|
|
|
|
|
|
|
|
| Net Income |
|
|
2,820 |
|
|
|
8,172 |
|
|
|
2,616 |
|
|
|
5,843 |
|
|
|
3,325 |
|
|
|
40,260 |
|
|
|
63,036 |
|
| Net income attributable to noncontrolling interests |
|
|
— |
|
|
|
— |
|
|
|
— |
|
|
|
— |
|
|
|
— |
|
|
|
(28 |
) |
|
|
(28 |
) |
|
|
|
|
|
|
|
|
|
|
|
|
|
|
|
|
|
|
|
|
|
|
|
|
|
|
|
|
|
| Net income attributable to the controlling interests |
|
$ |
2,820 |
|
|
$ |
8,172 |
|
|
$ |
2,616 |
|
|
$ |
5,843 |
|
|
$ |
3,325 |
|
|
$ |
40,232 |
|
|
$ |
63,008 |
|
|
|
|
|
|
|
|
|
|
|
|
|
|
|
|
|
|
|
|
|
|
|
|
|
|
|
|
|
|
| (1) |
Non same-store properties were: |
Acquisitions:
Office - 1140 Connecticut Avenue, 1227 25th Street, Braddock Metro
Center and John Marshall II.
Retail - Gateway Overlook.
Medical Office - Lansdowne Medical Office Building.
| (2) |
Discontinued operations included the following held for sale and sold properties: |
Office - Dulles Station, Phase I.
Industrial/Office - Industrial Portfolio (see page 27 of this Supplement).
14

|
|
|
|
|
|
|
|
|
|
|
|
|
|
|
|
|
|
|
|
|
|
|
|
|
|
|
|
|
| |
|
Three Months Ended September 30, 2010 |
|
| |
|
Multifamily |
|
|
Office |
|
|
Medical
Office |
|
|
Retail |
|
|
Industrial/Flex |
|
|
Corporate
and Other |
|
|
Total |
|
| Real estate rental revenue |
|
|
|
|
|
|
|
|
|
|
|
|
|
|
|
|
|
|
|
|
|
|
|
|
|
|
|
|
| Same-store portfolio |
|
$ |
12,434 |
|
|
$ |
31,740 |
|
|
$ |
10,979 |
|
|
$ |
9,865 |
|
|
$ |
— |
|
|
|
— |
|
|
$ |
65,018 |
|
| Non same-store - acquired and in development(1) |
|
|
— |
|
|
|
— |
|
|
|
14 |
|
|
|
— |
|
|
|
— |
|
|
|
— |
|
|
|
14 |
|
|
|
|
|
|
|
|
|
|
|
|
|
|
|
|
|
|
|
|
|
|
|
|
|
|
|
|
|
|
| Total |
|
|
12,434 |
|
|
|
31,740 |
|
|
|
10,993 |
|
|
|
9,865 |
|
|
|
— |
|
|
|
— |
|
|
|
65,032 |
|
|
|
|
|
|
|
|
|
| Real estate expenses |
|
|
|
|
|
|
|
|
|
|
|
|
|
|
|
|
|
|
|
|
|
|
|
|
|
|
|
|
| Same-store portfolio |
|
|
4,798 |
|
|
|
11,451 |
|
|
|
3,499 |
|
|
|
2,028 |
|
|
|
— |
|
|
|
— |
|
|
|
21,776 |
|
| Non same-store - acquired and in development(1) |
|
|
— |
|
|
|
— |
|
|
|
136 |
|
|
|
— |
|
|
|
— |
|
|
|
— |
|
|
|
136 |
|
|
|
|
|
|
|
|
|
|
|
|
|
|
|
|
|
|
|
|
|
|
|
|
|
|
|
|
|
|
| Total |
|
|
4,798 |
|
|
|
11,451 |
|
|
|
3,635 |
|
|
|
2,028 |
|
|
|
— |
|
|
|
— |
|
|
|
21,912 |
|
|
|
|
|
|
|
|
|
| Net Operating Income (NOI) |
|
|
|
|
|
|
|
|
|
|
|
|
|
|
|
|
|
|
|
|
|
|
|
|
|
|
|
|
| Same-store portfolio |
|
|
7,636 |
|
|
|
20,289 |
|
|
|
7,480 |
|
|
|
7,837 |
|
|
|
— |
|
|
|
— |
|
|
|
43,242 |
|
| Non same-store - acquired and in development(1) |
|
|
— |
|
|
|
— |
|
|
|
(122 |
) |
|
|
— |
|
|
|
— |
|
|
|
— |
|
|
|
(122 |
) |
|
|
|
|
|
|
|
|
|
|
|
|
|
|
|
|
|
|
|
|
|
|
|
|
|
|
|
|
|
| Total |
|
$ |
7,636 |
|
|
$ |
20,289 |
|
|
$ |
7,358 |
|
|
$ |
7,837 |
|
|
$ |
— |
|
|
|
— |
|
|
$ |
43,120 |
|
|
|
|
|
|
|
|
|
|
|
|
|
|
|
|
|
|
|
|
|
|
|
|
|
|
|
|
|
|
|
|
|
|
|
|
|
|
| Same-store portfolio NOI GAAP basis (from above) |
|
$ |
7,636 |
|
|
$ |
20,289 |
|
|
$ |
7,480 |
|
|
$ |
7,837 |
|
|
$ |
— |
|
|
|
— |
|
|
$ |
43,242 |
|
| Straight-line revenue, net for same-store properties |
|
|
(12 |
) |
|
|
(691 |
) |
|
|
(121 |
) |
|
|
(71 |
) |
|
|
— |
|
|
|
— |
|
|
|
(895 |
) |
| FAS 141 Min Rent |
|
|
(192 |
) |
|
|
(321 |
) |
|
|
(98 |
) |
|
|
(79 |
) |
|
|
— |
|
|
|
— |
|
|
|
(690 |
) |
| Amortization of lease intangibles for same-store properties |
|
|
— |
|
|
|
(16 |
) |
|
|
11 |
|
|
|
11 |
|
|
|
— |
|
|
|
— |
|
|
|
6 |
|
|
|
|
|
|
|
|
|
|
|
|
|
|
|
|
|
|
|
|
|
|
|
|
|
|
|
|
|
|
| Same-store portfolio NOI, cash basis |
|
$ |
7,432 |
|
|
$ |
19,261 |
|
|
$ |
7,272 |
|
|
$ |
7,698 |
|
|
$ |
— |
|
|
|
— |
|
|
$ |
41,663 |
|
|
|
|
|
|
|
|
|
|
|
|
|
|
|
|
|
|
|
|
|
|
|
|
|
|
|
|
|
|
|
|
|
|
|
|
|
|
| Reconciliation of NOI to net income |
|
|
|
|
|
|
|
|
|
|
|
|
|
|
|
|
|
|
|
|
|
|
|
|
|
|
|
|
| Total NOI |
|
$ |
7,636 |
|
|
$ |
20,289 |
|
|
$ |
7,358 |
|
|
$ |
7,837 |
|
|
$ |
— |
|
|
|
— |
|
|
$ |
43,120 |
|
| Other income |
|
|
— |
|
|
|
— |
|
|
|
— |
|
|
|
— |
|
|
|
— |
|
|
|
289 |
|
|
|
289 |
|
| Acquisition costs |
|
|
— |
|
|
|
— |
|
|
|
— |
|
|
|
— |
|
|
|
— |
|
|
|
— |
|
|
|
— |
|
| Interest expense |
|
|
(1,726 |
) |
|
|
(2,278 |
) |
|
|
(1,354 |
) |
|
|
(324 |
) |
|
|
— |
|
|
|
(11,035 |
) |
|
|
(16,717 |
) |
| Depreciation and amortization |
|
|
(3,435 |
) |
|
|
(10,894 |
) |
|
|
(3,804 |
) |
|
|
(1,771 |
) |
|
|
— |
|
|
|
(320 |
) |
|
|
(20,224 |
) |
| General and administrative |
|
|
— |
|
|
|
— |
|
|
|
— |
|
|
|
— |
|
|
|
— |
|
|
|
(3,141 |
) |
|
|
(3,141 |
) |
| Loss on extinguishment of debt |
|
|
— |
|
|
|
— |
|
|
|
— |
|
|
|
— |
|
|
|
— |
|
|
|
(238 |
) |
|
|
(238 |
) |
| Gain from non-disposal activities |
|
|
— |
|
|
|
— |
|
|
|
— |
|
|
|
— |
|
|
|
— |
|
|
|
4 |
|
|
|
4 |
|
| Discontinued operations(2) |
|
|
— |
|
|
|
456 |
|
|
|
— |
|
|
|
— |
|
|
|
3,109 |
|
|
|
— |
|
|
|
3,565 |
|
| Gain on sale of real estate |
|
|
— |
|
|
|
— |
|
|
|
— |
|
|
|
— |
|
|
|
— |
|
|
|
— |
|
|
|
— |
|
|
|
|
|
|
|
|
|
|
|
|
|
|
|
|
|
|
|
|
|
|
|
|
|
|
|
|
|
|
| Net income |
|
|
2,475 |
|
|
|
7,573 |
|
|
|
2,200 |
|
|
|
5,742 |
|
|
|
3,109 |
|
|
|
(14,441 |
) |
|
|
6,658 |
|
| Net income attributable to noncontrolling interests |
|
|
— |
|
|
|
— |
|
|
|
— |
|
|
|
— |
|
|
|
— |
|
|
|
(33 |
) |
|
|
(33 |
) |
|
|
|
|
|
|
|
|
|
|
|
|
|
|
|
|
|
|
|
|
|
|
|
|
|
|
|
|
|
| Net income attributable to the controlling interests |
|
$ |
2,475 |
|
|
$ |
7,573 |
|
|
$ |
2,200 |
|
|
$ |
5,742 |
|
|
$ |
3,109 |
|
|
$ |
(14,474 |
) |
|
$ |
6,625 |
|
|
|
|
|
|
|
|
|
|
|
|
|
|
|
|
|
|
|
|
|
|
|
|
|
|
|
|
|
|
| (1) |
Non same-store properties were: |
Acquisitions:
Medical Office - Lansdowne Medical Office Building.
| (2) |
Discontinued operations included the following held for sale and sold properties: |
Office - Dulles Station, Phase I and the Ridges.
Industrial/Office - Ammendale I & II, Amvax and the Industrial Portfolio (see page 27 of this Supplement).
15

WRIT Portfolio
Maryland/Virginia/DC
|
|
|
|
|
|
|
|
|
| |
|
Percentage of
Q3 2011 GAAP NOI |
|
|
Percentage of
YTD 2011 GAAP NOI |
|
| DC |
|
|
|
|
|
|
|
|
| Multifamily |
|
|
4.0 |
% |
|
|
4.0 |
% |
| Office |
|
|
19.1 |
% |
|
|
19.8 |
% |
| Medical Office |
|
|
1.8 |
% |
|
|
1.9 |
% |
| Retail |
|
|
0.7 |
% |
|
|
0.7 |
% |
|
|
|
|
|
|
|
|
|
|
|
|
25.6 |
% |
|
|
26.4 |
% |
|
|
|
| Maryland |
|
|
|
|
|
|
|
|
| Multifamily |
|
|
2.3 |
% |
|
|
2.5 |
% |
| Office |
|
|
12.6 |
% |
|
|
12.7 |
% |
| Medical Office |
|
|
4.5 |
% |
|
|
4.6 |
% |
| Retail |
|
|
12.9 |
% |
|
|
12.1 |
% |
|
|
|
|
|
|
|
|
|
|
|
|
32.3 |
% |
|
|
31.9 |
% |
|
|
|
| Virginia |
|
|
|
|
|
|
|
|
| Multifamily |
|
|
9.8 |
% |
|
|
9.9 |
% |
| Office |
|
|
16.5 |
% |
|
|
15.9 |
% |
| Medical Office |
|
|
9.7 |
% |
|
|
9.9 |
% |
| Retail |
|
|
6.1 |
% |
|
|
6.0 |
% |
|
|
|
|
|
|
|
|
|
|
|
|
42.1 |
% |
|
|
41.7 |
% |
|
|
|
| Total Portfolio |
|
|
100.0 |
% |
|
|
100.0 |
% |
WRIT Portfolio
Inside & Outside the Beltway
|
|
|
|
|
|
|
|
|
| |
|
Percentage of
Q3 2011 GAAP NOI |
|
|
Percentage of
YTD 2011 GAAP NOI |
|
| Inside the Beltway |
|
|
|
|
|
|
|
|
| Multifamily |
|
|
15.3 |
% |
|
|
15.5 |
% |
| Office |
|
|
26.8 |
% |
|
|
26.6 |
% |
| Medical Office |
|
|
3.2 |
% |
|
|
3.2 |
% |
| Retail |
|
|
6.8 |
% |
|
|
6.7 |
% |
|
|
|
|
|
|
|
|
|
|
|
|
52.1 |
% |
|
|
52.0 |
% |
|
|
|
| Outside the Beltway |
|
|
|
|
|
|
|
|
| Multifamily |
|
|
0.8 |
% |
|
|
0.9 |
% |
| Office |
|
|
21.3 |
% |
|
|
21.8 |
% |
| Medical Office |
|
|
12.9 |
% |
|
|
13.2 |
% |
| Retail |
|
|
12.9 |
% |
|
|
12.1 |
% |
|
|
|
|
|
|
|
|
|
|
|
|
47.9 |
% |
|
|
48.0 |
% |
|
|
|
| Total Portfolio |
|
|
100.0 |
% |
|
|
100.0 |
% |
16

|
|
|
|
|
|
|
|
|
|
|
|
|
|
|
|
|
|
|
|
|
| |
|
Physical Occupancy - Same-Store Properties (1) |
|
| Sector |
|
9/30/2011 |
|
|
6/30/2011 |
|
|
3/31/2011 |
|
|
12/31/2010 |
|
|
9/30/2010 |
|
|
|
|
|
|
|
| Multifamily |
|
|
94.0 |
% |
|
|
95.6 |
% |
|
|
95.3 |
% |
|
|
95.7 |
% |
|
|
96.4 |
% |
| Office Buildings |
|
|
88.1 |
% |
|
|
88.4 |
% |
|
|
89.3 |
% |
|
|
89.4 |
% |
|
|
89.4 |
% |
| Medical Office |
|
|
91.3 |
% |
|
|
91.7 |
% |
|
|
93.5 |
% |
|
|
93.8 |
% |
|
|
93.3 |
% |
| Retail Centers |
|
|
91.8 |
% |
|
|
92.3 |
% |
|
|
92.2 |
% |
|
|
92.5 |
% |
|
|
92.2 |
% |
| Industrial / Flex |
|
|
— |
% |
|
|
— |
% |
|
|
— |
% |
|
|
— |
% |
|
|
— |
% |
|
|
|
|
|
|
|
|
|
|
|
|
|
|
|
|
|
|
|
|
|
|
|
|
|
|
|
| Overall Portfolio |
|
|
90.7 |
% |
|
|
91.3 |
% |
|
|
91.8 |
% |
|
|
92.1 |
% |
|
|
92.1 |
% |
|
|
| |
|
Physical Occupancy - All Properties |
|
| Sector |
|
9/30/2011 |
|
|
6/30/2011 |
|
|
3/31/2011 |
|
|
12/31/2010 |
|
|
9/30/2010 |
|
|
|
|
|
|
|
| Multifamily |
|
|
94.0 |
% |
|
|
95.6 |
% |
|
|
95.3 |
% |
|
|
95.7 |
% |
|
|
96.4 |
% |
| Office Buildings |
|
|
88.6 |
% |
|
|
88.1 |
% |
|
|
89.1 |
% |
|
|
89.4 |
% |
|
|
89.6 |
% |
| Medical Office |
|
|
87.2 |
% |
|
|
87.3 |
% |
|
|
88.3 |
% |
|
|
88.5 |
% |
|
|
87.8 |
% |
| Retail Centers |
|
|
92.3 |
% |
|
|
92.0 |
% |
|
|
92.0 |
% |
|
|
92.1 |
% |
|
|
92.2 |
% |
| Industrial / Flex |
|
|
75.4 |
% |
|
|
78.4 |
% |
|
|
80.2 |
% |
|
|
78.6 |
% |
|
|
79.5 |
% |
|
|
|
|
|
|
|
|
|
|
|
|
|
|
|
|
|
|
|
|
|
|
|
|
|
|
|
| Overall Portfolio |
|
|
89.0 |
% |
|
|
87.7 |
% |
|
|
88.5 |
% |
|
|
88.3 |
% |
|
|
88.4 |
% |
| (1) |
Non same-store properties were: |
Acquisitions:
Office - 1140 Connecticut Avenue, 1227 25th Street, Braddock Metro
Center and John Marshall II.
Retail - Gateway Overlook, Olney Village Center.
Medical Office - Lansdowne Medical Office Building.
Held for sale and sold properties:
Office - Dulles Station, Phase I and the
Ridges.
Industrial/Office - Ammendale I & II, Amvax and the Industrial Portfolio (see page 27 of this Supplement).
17

|
|
|
|
|
|
|
|
|
|
|
|
|
|
|
|
|
|
|
|
|
| |
|
Economic Occupancy - Same-Store Properties(1) |
|
| Sector |
|
9/30/2011 |
|
|
6/30/2011 |
|
|
3/31/2011 |
|
|
12/31/2010 |
|
|
9/30/2010 |
|
|
|
|
|
|
|
| Multifamily |
|
|
94.1 |
% |
|
|
94.9 |
% |
|
|
94.8 |
% |
|
|
95.5 |
% |
|
|
95.6 |
% |
| Office Buildings |
|
|
89.2 |
% |
|
|
90.2 |
% |
|
|
90.3 |
% |
|
|
89.7 |
% |
|
|
89.9 |
% |
| Medical Office Buildings |
|
|
92.8 |
% |
|
|
94.0 |
% |
|
|
94.2 |
% |
|
|
94.5 |
% |
|
|
94.8 |
% |
| Retail Centers |
|
|
92.0 |
% |
|
|
92.3 |
% |
|
|
92.3 |
% |
|
|
91.4 |
% |
|
|
91.7 |
% |
| Industrial / Flex |
|
|
— |
% |
|
|
— |
% |
|
|
— |
% |
|
|
— |
% |
|
|
— |
% |
|
|
|
|
|
|
|
|
|
|
|
|
|
|
|
|
|
|
|
|
|
|
|
|
|
|
|
| Overall Portfolio |
|
|
91.2 |
% |
|
|
92.1 |
% |
|
|
92.1 |
% |
|
|
91.9 |
% |
|
|
92.1 |
% |
|
|
| |
|
Economic Occupancy - All Properties |
|
| Sector |
|
9/30/2011 |
|
|
6/30/2011 |
|
|
3/31/2011 |
|
|
12/31/2010 |
|
|
9/30/2010 |
|
|
|
|
|
|
|
| Multifamily |
|
|
94.1 |
% |
|
|
94.9 |
% |
|
|
94.8 |
% |
|
|
95.5 |
% |
|
|
95.6 |
% |
| Office Buildings |
|
|
88.5 |
% |
|
|
89.7 |
% |
|
|
90.7 |
% |
|
|
90.0 |
% |
|
|
90.1 |
% |
| Medical Office Buildings |
|
|
89.9 |
% |
|
|
90.5 |
% |
|
|
90.5 |
% |
|
|
90.3 |
% |
|
|
90.3 |
% |
| Retail Centers |
|
|
92.3 |
% |
|
|
92.3 |
% |
|
|
92.0 |
% |
|
|
91.4 |
% |
|
|
91.7 |
% |
| Industrial / Flex |
|
|
80.8 |
% |
|
|
81.9 |
% |
|
|
81.4 |
% |
|
|
81.9 |
% |
|
|
83.0 |
% |
|
|
|
|
|
|
|
|
|
|
|
|
|
|
|
|
|
|
|
|
|
|
|
|
|
|
|
| Overall Portfolio |
|
|
89.5 |
% |
|
|
90.2 |
% |
|
|
90.5 |
% |
|
|
90.2 |
% |
|
|
90.3 |
% |
| (1) |
Non same-store properties were: |
Acquisitions:
Office - 1140 Connecticut Avenue, 1227 25th Street, Braddock Metro
Center and John Marshall II.
Retail - Gateway Overlook, Olney Village Center.
Medical Office - Lansdowne Medical Office Building.
Held for sale and sold properties:
Office - Dulles Station, Phase I and the
Ridges.
Industrial/Office - Ammendale I & II, Amvax and the Industrial Portfolio (see page 27 of this Supplement).
18

|
|
|
|
|
|
|
|
|
|
|
|
|
|
|
|
|
|
|
|
|
| |
|
3rd Quarter 2011 |
|
|
2nd Quarter 2011 |
|
|
1st Quarter 2011 |
|
|
4th Quarter 2010 |
|
|
3rd Quarter 2010 |
|
| Gross Leasing Square Footage |
|
|
|
|
|
|
|
|
|
|
|
|
|
|
|
|
|
|
|
|
|
|
|
|
|
|
| Office Buildings |
|
|
152,900 |
|
|
|
160,318 |
|
|
|
138,083 |
|
|
|
125,367 |
|
|
|
103,428 |
|
| Medical Office Buildings |
|
|
29,070 |
|
|
|
61,374 |
|
|
|
43,355 |
|
|
|
7,136 |
|
|
|
70,426 |
|
| Retail Centers |
|
|
59,910 |
|
|
|
38,482 |
|
|
|
78,669 |
|
|
|
97,055 |
|
|
|
52,501 |
|
|
|
|
|
|
|
|
|
|
|
|
|
|
|
|
|
|
|
|
|
|
| Total |
|
|
241,880 |
|
|
|
260,174 |
|
|
|
260,107 |
|
|
|
229,558 |
|
|
|
226,355 |
|
|
|
|
|
|
|
|
|
|
|
|
|
|
|
|
|
|
|
|
|
|
| Weighted Average Term (yrs) |
|
|
|
|
|
|
|
|
|
|
|
|
|
|
|
|
|
|
|
|
|
|
|
|
|
|
| Office Buildings |
|
|
4.3 |
|
|
|
7.5 |
|
|
|
3.6 |
|
|
|
5.4 |
|
|
|
4.4 |
|
| Medical Office Buildings |
|
|
4.9 |
|
|
|
5.5 |
|
|
|
6.0 |
|
|
|
3.9 |
|
|
|
5.4 |
|
| Retail Centers |
|
|
5.9 |
|
|
|
8.2 |
|
|
|
4.5 |
|
|
|
8.4 |
|
|
|
6.5 |
|
|
|
|
|
|
|
|
|
|
|
|
|
|
|
|
|
|
|
|
|
|
| Total |
|
|
4.7 |
|
|
|
7.1 |
|
|
|
4.3 |
|
|
|
6.6 |
|
|
|
5.2 |
|
|
|
|
|
|
|
|
|
|
|
|
|
|
|
|
|
|
|
|
|
|
|
|
|
|
|
|
|
|
|
|
|
|
|
|
|
|
|
|
|
|
|
|
|
|
|
|
|
|
|
|
|
|
|
|
|
|
|
|
|
|
|
| |
|
GAAP |
|
|
CASH |
|
|
GAAP |
|
|
CASH |
|
|
GAAP |
|
|
CASH |
|
|
GAAP |
|
|
CASH |
|
|
GAAP |
|
|
CASH |
|
| Rental Rate Increases: |
|
|
|
|
|
|
|
|
|
|
|
|
|
|
|
|
|
|
|
|
|
|
|
|
|
|
|
|
|
|
|
|
|
|
|
|
|
|
|
|
| Rate on expiring leases |
|
|
|
|
|
|
|
|
|
|
|
|
|
|
|
|
|
|
|
|
|
|
|
|
|
|
|
|
|
|
|
|
|
|
|
|
|
|
|
|
|
|
|
|
|
|
|
|
|
|
|
| Office Buildings |
|
$ |
36.04 |
|
|
$ |
37.87 |
|
|
$ |
25.59 |
|
|
$ |
26.66 |
|
|
$ |
31.41 |
|
|
$ |
32.26 |
|
|
$ |
28.72 |
|
|
$ |
30.30 |
|
|
$ |
27.63 |
|
|
$ |
28.50 |
|
| Medical Office Buildings |
|
|
34.63 |
|
|
|
36.79 |
|
|
|
30.74 |
|
|
|
32.36 |
|
|
|
32.91 |
|
|
|
34.90 |
|
|
|
35.53 |
|
|
|
37.37 |
|
|
|
30.40 |
|
|
|
32.62 |
|
| Retail Centers |
|
|
14.14 |
|
|
|
17.39 |
|
|
|
23.67 |
|
|
|
24.20 |
|
|
|
15.64 |
|
|
|
15.91 |
|
|
|
15.50 |
|
|
|
16.13 |
|
|
|
26.01 |
|
|
|
26.71 |
|
|
|
|
|
|
|
|
|
|
|
|
|
|
|
|
|
|
|
|
|
|
|
|
|
|
|
|
|
|
|
|
|
|
|
|
|
|
|
|
|
|
| Total |
|
$ |
30.19 |
|
|
$ |
32.41 |
|
|
$ |
26.53 |
|
|
$ |
27.65 |
|
|
$ |
26.89 |
|
|
$ |
27.76 |
|
|
$ |
23.34 |
|
|
$ |
24.53 |
|
|
$ |
28.12 |
|
|
$ |
29.36 |
|
|
|
|
|
|
|
|
|
|
|
|
|
|
|
|
|
|
|
|
|
|
|
|
|
|
|
|
|
|
|
|
|
|
|
|
|
|
|
|
|
|
|
|
|
|
|
|
|
|
|
|
|
| Rate on new leases |
|
|
|
|
|
|
|
|
|
|
|
|
|
|
|
|
|
|
|
|
|
|
|
|
|
|
|
|
|
|
|
|
|
|
|
|
|
|
|
|
|
|
|
|
|
|
|
|
|
|
|
| Office Buildings |
|
$ |
39.53 |
|
|
$ |
37.76 |
|
|
$ |
29.06 |
|
|
$ |
26.64 |
|
|
$ |
30.97 |
|
|
$ |
29.91 |
|
|
$ |
31.39 |
|
|
$ |
29.41 |
|
|
$ |
28.32 |
|
|
$ |
27.09 |
|
| Medical Office Buildings |
|
|
37.76 |
|
|
|
35.79 |
|
|
|
36.13 |
|
|
|
33.64 |
|
|
|
37.24 |
|
|
|
34.76 |
|
|
|
37.41 |
|
|
|
36.05 |
|
|
|
34.94 |
|
|
|
32.78 |
|
| Retail Centers |
|
|
18.56 |
|
|
|
21.96 |
|
|
|
25.88 |
|
|
|
24.34 |
|
|
|
16.48 |
|
|
|
16.30 |
|
|
|
21.79 |
|
|
|
20.41 |
|
|
|
30.57 |
|
|
|
29.36 |
|
|
|
|
|
|
|
|
|
|
|
|
|
|
|
|
|
|
|
|
|
|
|
|
|
|
|
|
|
|
|
|
|
|
|
|
|
|
|
|
|
|
| Total |
|
$ |
33.71 |
|
|
$ |
33.24 |
|
|
$ |
30.25 |
|
|
$ |
27.96 |
|
|
$ |
27.63 |
|
|
$ |
26.60 |
|
|
$ |
27.52 |
|
|
$ |
25.81 |
|
|
$ |
30.90 |
|
|
$ |
29.39 |
|
|
|
|
|
|
|
|
|
|
|
|
|
|
|
|
|
|
|
|
|
|
|
|
|
|
|
|
|
|
|
|
|
|
|
|
|
|
|
|
|
|
|
|
|
|
|
|
|
|
|
|
|
| Percentage Increase |
|
|
|
|
|
|
|
|
|
|
|
|
|
|
|
|
|
|
|
|
|
|
|
|
|
|
|
|
|
|
|
|
|
|
|
|
|
|
|
|
|
|
|
|
|
|
|
|
|
|
|
| Office Buildings |
|
|
9.69 |
% |
|
|
(0.30 |
)% |
|
|
13.58 |
% |
|
|
(0.10 |
)% |
|
|
(1.40 |
)% |
|
|
(7.30 |
)% |
|
|
9.31 |
% |
|
|
(2.93 |
)% |
|
|
2.48 |
% |
|
|
(4.93 |
)% |
| Medical Office Buildings |
|
|
9.04 |
% |
|
|
(2.70 |
)% |
|
|
17.51 |
% |
|
|
3.96 |
% |
|
|
13.14 |
% |
|
|
(0.41 |
)% |
|
|
5.28 |
% |
|
|
(3.53 |
)% |
|
|
14.95 |
% |
|
|
0.51 |
% |
| Retail Centers |
|
|
31.29 |
% |
|
|
26.25 |
% |
|
|
9.34 |
% |
|
|
0.60 |
% |
|
|
5.39 |
% |
|
|
2.42 |
% |
|
|
40.57 |
% |
|
|
26.50 |
% |
|
|
17.51 |
% |
|
|
9.91 |
% |
|
|
|
|
|
|
|
|
|
|
|
|
|
|
|
|
|
|
|
|
|
|
|
|
|
|
|
|
|
|
|
|
|
|
|
|
|
|
|
|
|
| Total |
|
|
11.66 |
% |
|
|
2.56 |
% |
|
|
14.06 |
% |
|
|
1.13 |
% |
|
|
2.76 |
% |
|
|
(4.17 |
)% |
|
|
17.90 |
% |
|
|
5.22 |
% |
|
|
9.90 |
% |
|
|
0.08 |
% |
|
|
|
|
|
|
|
|
|
|
|
|
|
|
|
|
|
|
|
|
|
|
|
|
|
|
|
|
|
|
|
|
|
|
|
|
|
|
|
|
|
19

|
|
|
|
|
|
|
|
|
|
|
|
|
|
|
|
|
|
|
|
|
|
|
|
|
|
|
|
|
|
|
|
|
|
|
|
|
|
|
|
|
| |
|
3rd Quarter 2011 |
|
|
2nd Quarter 2011 |
|
|
1st Quarter 2011 |
|
|
4th Quarter 2010 |
|
|
3rd Quarter 2010 |
|
| |
|
Total Dollars |
|
|
Dollars per
Square Foot |
|
|
Total Dollars |
|
|
Dollars per
Square Foot |
|
|
Total Dollars |
|
|
Dollars per
Square Foot |
|
|
Total Dollars |
|
|
Dollars per
Square Foot |
|
|
Total Dollars |
|
|
Dollars per
Square Foot |
|
| Tenant Improvements |
|
|
|
|
|
|
|
|
|
|
|
|
|
|
|
|
|
|
|
|
|
|
|
|
|
|
|
|
|
|
|
|
|
|
|
|
|
|
|
|
|
|
|
|
|
|
|
|
|
|
|
| Office Buildings |
|
$ |
2,067,782 |
|
|
$ |
13.52 |
|
|
$ |
3,019,025 |
|
|
$ |
18.83 |
|
|
$ |
535,261 |
|
|
$ |
3.88 |
|
|
$ |
2,461,268 |
|
|
$ |
19.63 |
|
|
$ |
1,296,474 |
|
|
$ |
12.54 |
|
|
|
|
|
|
|
|
|
|
|
|
| Medical Office Buildings |
|
|
112,145 |
|
|
|
3.86 |
|
|
|
893,785 |
|
|
|
14.56 |
|
|
|
384,334 |
|
|
|
8.86 |
|
|
|
86,937 |
|
|
|
12.18 |
|
|
|
859,927 |
|
|
|
12.21 |
|
|
|
|
|
|
|
|
|
|
|
|
| Retail Centers |
|
|
1,424,151 |
|
|
|
23.77 |
|
|
|
265,135 |
|
|
|
6.89 |
|
|
|
— |
|
|
|
— |
|
|
|
288,110 |
|
|
|
2.97 |
|
|
|
22,500 |
|
|
|
0.43 |
|
|
|
|
|
|
|
|
|
|
|
|
|
|
|
|
|
|
|
|
|
|
|
|
|
|
|
|
|
|
|
|
|
|
|
|
|
|
|
|
|
|
|
|
|
|
|
|
|
|
|
|
|
| Subtotal |
|
$ |
3,604,078 |
|
|
$ |
14.90 |
|
|
$ |
4,177,945 |
|
|
$ |
16.06 |
|
|
$ |
919,595 |
|
|
$ |
3.54 |
|
|
$ |
2,836,315 |
|
|
$ |
12.36 |
|
|
$ |
2,178,901 |
|
|
$ |
9.63 |
|
|
|
|
|
|
|
|
|
|
|
|
|
|
|
|
|
|
|
|
|
|
|
|
|
|
|
|
|
|
|
|
|
|
|
|
|
|
|
|
|
|
|
|
|
|
|
|
|
|
|
|
|
| Leasing Costs |
|
|
|
|
|
|
|
|
|
|
|
|
|
|
|
|
|
|
|
|
|
|
|
|
|
|
|
|
|
|
|
|
|
|
|
|
|
|
|
|
|
|
|
|
|
|
|
|
|
|
|
| Office Buildings |
|
$ |
1,596,565 |
|
|
$ |
10.44 |
|
|
$ |
2,189,912 |
|
|
$ |
13.66 |
|
|
$ |
582,007 |
|
|
$ |
4.21 |
|
|
$ |
1,478,762 |
|
|
$ |
11.80 |
|
|
$ |
771,853 |
|
|
$ |
7.46 |
|
|
|
|
|
|
|
|
|
|
|
|
| Medical Office Buildings |
|
|
206,298 |
|
|
|
7.10 |
|
|
|
716,648 |
|
|
|
11.68 |
|
|
|
530,073 |
|
|
|
12.23 |
|
|
|
21,352 |
|
|
|
2.99 |
|
|
|
372,579 |
|
|
|
5.29 |
|
|
|
|
|
|
|
|
|
|
|
|
| Retail Centers |
|
|
504,673 |
|
|
|
8.42 |
|
|
|
269,557 |
|
|
|
7.00 |
|
|
|
77,260 |
|
|
|
0.98 |
|
|
|
416,203 |
|
|
|
4.29 |
|
|
|
120,544 |
|
|
|
2.30 |
|
|
|
|
|
|
|
|
|
|
|
|
|
|
|
|
|
|
|
|
|
|
|
|
|
|
|
|
|
|
|
|
|
|
|
|
|
|
|
|
|
|
|
|
|
|
|
|
|
|
|
|
|
| Subtotal |
|
$ |
2,307,536 |
|
|
$ |
9.54 |
|
|
$ |
3,176,117 |
|
|
$ |
12.21 |
|
|
$ |
1,189,340 |
|
|
$ |
4.57 |
|
|
$ |
1,916,317 |
|
|
$ |
8.35 |
|
|
$ |
1,264,976 |
|
|
$ |
5.59 |
|
|
|
|
|
|
|
|
|
|
|
|
|
|
|
|
|
|
|
|
|
|
|
|
|
|
|
|
|
|
|
|
|
|
|
|
|
|
|
|
|
|
|
|
|
|
|
|
|
|
|
|
|
| Tenant Improvements and Leasing Costs |
|
|
|
|
|
|
|
|
|
|
|
|
|
|
|
|
|
|
|
|
|
|
|
|
|
|
|
|
|
|
|
|
|
|
|
|
|
|
|
|
|
|
|
|
|
|
|
|
|
|
|
| Office Buildings |
|
$ |
3,664,347 |
|
|
$ |
23.96 |
|
|
$ |
5,208,937 |
|
|
$ |
32.49 |
|
|
$ |
1,117,268 |
|
|
$ |
8.09 |
|
|
$ |
3,940,030 |
|
|
$ |
31.43 |
|
|
$ |
2,068,327 |
|
|
$ |
20.00 |
|
|
|
|
|
|
|
|
|
|
|
|
| Medical Office Buildings |
|
|
318,443 |
|
|
|
10.96 |
|
|
|
1,610,433 |
|
|
|
26.24 |
|
|
|
914,407 |
|
|
|
21.09 |
|
|
|
108,289 |
|
|
|
15.17 |
|
|
|
1,232,506 |
|
|
|
17.50 |
|
|
|
|
|
|
|
|
|
|
|
|
| Retail Centers |
|
|
1,928,824 |
|
|
|
32.19 |
|
|
|
534,692 |
|
|
|
13.89 |
|
|
|
77,260 |
|
|
|
0.98 |
|
|
|
704,313 |
|
|
|
7.26 |
|
|
|
143,044 |
|
|
|
2.73 |
|
|
|
|
|
|
|
|
|
|
|
|
|
|
|
|
|
|
|
|
|
|
|
|
|
|
|
|
|
|
|
|
|
|
|
|
|
|
|
|
|
|
|
|
|
|
|
|
|
|
|
|
|
| Total |
|
$ |
5,911,614 |
|
|
$ |
24.44 |
|
|
$ |
7,354,062 |
|
|
$ |
28.27 |
|
|
$ |
2,108,935 |
|
|
$ |
8.11 |
|
|
$ |
4,752,632 |
|
|
$ |
20.71 |
|
|
$ |
3,443,877 |
|
|
$ |
15.22 |
|
|
|
|
|
|
|
|
|
|
|
|
|
|
|
|
|
|
|
|
|
|
|
|
|
|
|
|
|
|
|
|
|
|
|
|
|
|
|
|
|
|
20

|
|
|
|
|
|
|
|
|
|
|
|
|
|
|
|
|
|
|
|
|
| Tenant |
|
Number of
Buildings |
|
|
Weighted
Average
Remaining
Lease Term in
Months |
|
|
Percentage of
Aggregate
Portfolio
Annualized
Rent |
|
|
Aggregate
Rentable
Square Feet |
|
|
Percentage of
Aggregate
Occupied
Square Feet |
|
|
|
|
|
|
|
| World Bank |
|
|
1 |
|
|
|
45 |
|
|
|
4.96 |
% |
|
|
210,354 |
|
|
|
2.86 |
% |
| General Services Administration |
|
|
6 |
|
|
|
35 |
|
|
|
3.04 |
% |
|
|
177,530 |
|
|
|
2.41 |
% |
| Advisory Board Company |
|
|
1 |
|
|
|
92 |
|
|
|
2.86 |
% |
|
|
180,925 |
|
|
|
2.46 |
% |
| L-3 Services, Inc. |
|
|
1 |
|
|
|
72 |
|
|
|
2.32 |
% |
|
|
147,468 |
|
|
|
2.00 |
% |
| Booz Allen Hamilton, Inc. |
|
|
1 |
|
|
|
52 |
|
|
|
2.27 |
% |
|
|
222,989 |
|
|
|
3.03 |
% |
| Patton Boggs LLP |
|
|
1 |
|
|
|
67 |
|
|
|
2.03 |
% |
|
|
110,566 |
|
|
|
1.50 |
% |
| INOVA Health System |
|
|
7 |
|
|
|
44 |
|
|
|
2.00 |
% |
|
|
113,174 |
|
|
|
1.54 |
% |
| Sunrise Assisted Living, Inc. |
|
|
1 |
|
|
|
24 |
|
|
|
1.63 |
% |
|
|
115,289 |
|
|
|
1.57 |
% |
| Children’s Hospital |
|
|
3 |
|
|
|
85 |
|
|
|
1.25 |
% |
|
|
77,858 |
|
|
|
1.06 |
% |
| General Dynamics |
|
|
2 |
|
|
|
33 |
|
|
|
1.17 |
% |
|
|
88,359 |
|
|
|
1.20 |
% |
|
|
|
|
|
|
|
|
|
|
|
|
|
|
|
|
|
|
|
|
|
| Total/Weighted Average |
|
|
|
|
|
|
55 |
|
|
|
23.53 |
% |
|
|
1,444,512 |
|
|
|
19.63 |
% |
|
|
|
|
|
|
|
|
|
|
|
|
|
|
|
|
|
|
|
|
|
21

|
|
|
|
|
|
|
|
|
|
|
|
|
|
|
|
|
| Industry Classification (NAICS) |
|
Annualized
Base Rental
Revenue |
|
|
Percentage
of
Aggregate
Annualized
Rent
|
|
|
Aggregate
Rentable
Square Feet |
|
|
Percentage of
Aggregate
Square Feet |
|
|
|
|
|
|
| Professional, Scientific, and Technical Services |
|
$ |
70,936,239 |
|
|
|
32.96 |
% |
|
|
2,309,557 |
|
|
|
31.11 |
% |
| Ambulatory Health Care Services |
|
|
39,130,938 |
|
|
|
18.18 |
% |
|
|
1,145,381 |
|
|
|
15.43 |
% |
| Credit Intermediation and Related Activities |
|
|
16,002,437 |
|
|
|
7.44 |
% |
|
|
315,901 |
|
|
|
4.26 |
% |
| Executive, Legislative, and Other General Government Support |
|
|
8,126,219 |
|
|
|
3.78 |
% |
|
|
296,620 |
|
|
|
4.00 |
% |
| Food Services and Drinking Places |
|
|
7,615,934 |
|
|
|
3.54 |
% |
|
|
247,274 |
|
|
|
3.33 |
% |
| Religious, Grantmaking, Civic, Professional, and Similar Organizations |
|
|
7,436,940 |
|
|
|
3.46 |
% |
|
|
216,227 |
|
|
|
2.91 |
% |
| Food and Beverage Stores |
|
|
5,471,508 |
|
|
|
2.54 |
% |
|
|
317,729 |
|
|
|
4.28 |
% |
| Educational Services |
|
|
4,781,622 |
|
|
|
2.22 |
% |
|
|
162,966 |
|
|
|
2.20 |
% |
| Nursing and Residential Care Facilities |
|
|
4,144,413 |
|
|
|
1.93 |
% |
|
|
117,500 |
|
|
|
1.58 |
% |
| Miscellaneous Store Retailers |
|
|
3,313,888 |
|
|
|
1.54 |
% |
|
|
180,823 |
|
|
|
2.44 |
% |
| Health and Personal Care Stores |
|
|
3,219,022 |
|
|
|
1.50 |
% |
|
|
99,307 |
|
|
|
1.34 |
% |
| Clothing and Clothing Accessories Stores |
|
|
3,173,125 |
|
|
|
1.47 |
% |
|
|
166,413 |
|
|
|
2.24 |
% |
| Furniture and Home Furnishings Stores |
|
|
3,131,393 |
|
|
|
1.46 |
% |
|
|
151,826 |
|
|
|
2.05 |
% |
| Broadcasting (except Internet) |
|
|
3,002,952 |
|
|
|
1.40 |
% |
|
|
86,333 |
|
|
|
1.16 |
% |
| Administrative and Support Services |
|
|
2,790,659 |
|
|
|
1.30 |
% |
|
|
85,687 |
|
|
|
1.15 |
% |
| Electronics and Appliance Stores |
|
|
2,546,306 |
|
|
|
1.18 |
% |
|
|
157,155 |
|
|
|
2.12 |
% |
| Personal and Laundry Services |
|
|
2,482,855 |
|
|
|
1.15 |
% |
|
|
83,191 |
|
|
|
1.12 |
% |
| Hospitals |
|
|
2,441,411 |
|
|
|
1.13 |
% |
|
|
70,909 |
|
|
|
0.96 |
% |
| Sporting Goods, Hobby, Book, and Music Stores |
|
|
2,432,301 |
|
|
|
1.13 |
% |
|
|
156,134 |
|
|
|
2.10 |
% |
| Real Estate |
|
|
1,723,959 |
|
|
|
0.80 |
% |
|
|
60,495 |
|
|
|
0.82 |
% |
| General Merchandise Stores |
|
|
1,672,527 |
|
|
|
0.78 |
% |
|
|
209,452 |
|
|
|
2.82 |
% |
| Amusement, Gambling, and Recreation Industries |
|
|
1,224,485 |
|
|
|
0.57 |
% |
|
|
75,446 |
|
|
|
1.02 |
% |
| Transportation Equipment Manufacturing |
|
|
1,211,231 |
|
|
|
0.56 |
% |
|
|
39,989 |
|
|
|
0.54 |
% |
| Computer and Electronic Product Manufacturing |
|
|
1,144,504 |
|
|
|
0.53 |
% |
|
|
40,684 |
|
|
|
0.55 |
% |
| Printing and Related Support Activities |
|
|
1,115,972 |
|
|
|
0.52 |
% |
|
|
48,775 |
|
|
|
0.66 |
% |
| Insurance Carriers and Related Activities |
|
|
1,014,707 |
|
|
|
0.47 |
% |
|
|
38,181 |
|
|
|
0.51 |
% |
| Management of Companies and Enterprises |
|
|
963,518 |
|
|
|
0.45 |
% |
|
|
45,864 |
|
|
|
0.62 |
% |
| Securities, Commodity Contracts, Other Financial Investments & Related Activities |
|
|
856,417 |
|
|
|
0.40 |
% |
|
|
32,893 |
|
|
|
0.44 |
% |
| Publishing Industries (except Internet) |
|
|
758,589 |
|
|
|
0.35 |
% |
|
|
24,415 |
|
|
|
0.33 |
% |
| Merchant Wholesalers, Durable Goods |
|
|
622,499 |
|
|
|
0.29 |
% |
|
|
38,619 |
|
|
|
0.52 |
% |
|
|
|
|
|
| Building Material and Garden Equipment and Supplies Dealers |
|
|
546,917 |
|
|
|
0.25 |
% |
|
|
28,059 |
|
|
|
0.38 |
% |
| Other |
|
|
10,183,858 |
|
|
|
4.72 |
% |
|
|
374,735 |
|
|
|
5.01 |
% |
|
|
|
|
|
|
|
|
|
|
|
|
|
|
|
|
|
| Total |
|
$ |
215,219,345 |
|
|
|
100.00 |
% |
|
|
7,424,540 |
|
|
|
100.00 |
% |
|
|
|
|
|
|
|
|
|
|
|
|
|
|
|
|
|
22

|
|
|
|
|
|
|
|
|
|
|
|
|
|
|
|
|
|
|
|
|
|
|
|
|
| Year |
|
Number of
Leases |
|
|
Rentable
Square Feet |
|
|
Percent of
Rentable
Square Feet |
|
|
Annualized
Rent * |
|
|
Average
Rental
Rate |
|
|
Percent of
Annualized
Rent * |
|
| Office: |
|
|
|
|
|
|
|
|
|
|
|
|
|
|
|
|
| 2011 |
|
|
36 |
|
|
|
196,957 |
|
|
|
4.66 |
% |
|
$ |
6,350,812 |
|
|
$ |
32.24 |
|
|
|
4.17 |
% |
| 2012 |
|
|
101 |
|
|
|
444,718 |
|
|
|
10.52 |
% |
|
|
14,489,160 |
|
|
|
32.58 |
|
|
|
9.52 |
% |
| 2013 |
|
|
90 |
|
|
|
470,914 |
|
|
|
11.14 |
% |
|
|
15,109,944 |
|
|
|
32.09 |
|
|
|
9.93 |
% |
| 2014 |
|
|
89 |
|
|
|
753,110 |
|
|
|
17.82 |
% |
|
|
26,007,477 |
|
|
|
34.53 |
|
|
|
17.09 |
% |
| 2015 |
|
|
73 |
|
|
|
524,483 |
|
|
|
12.41 |
% |
|
|
21,670,615 |
|
|
|
41.32 |
|
|
|
14.24 |
% |
| 2016 and thereafter |
|
|
190 |
|
|
|
1,836,220 |
|
|
|
43.45 |
% |
|
|
68,519,990 |
|
|
|
37.32 |
|
|
|
45.05 |
% |
|
|
|
|
|
|
|
|
|
|
|
|
|
|
|
|
|
|
|
|
|
|
|
|
|
|
|
|
579 |
|
|
|
4,226,402 |
|
|
|
100.00 |
% |
|
$ |
152,147,998 |
|
|
$ |
36.00 |
|
|
|
100.00 |
% |
|
|
|
|
|
|
|
|
|
|
|
|
|
|
|
|
|
|
|
|
|
|
|
|
|
|
|
|
|
|
| Medical Office: |
|
|
|
|
|
|
|
|
|
|
|
|
|
|
|
|
| 2011 |
|
|
15 |
|
|
|
28,849 |
|
|
|
2.54 |
% |
|
$ |
1,009,190 |
|
|
$ |
34.98 |
|
|
|
2.25 |
% |
| 2012 |
|
|
52 |
|
|
|
176,279 |
|
|
|
15.51 |
% |
|
|
6,477,693 |
|
|
|
36.75 |
|
|
|
14.47 |
% |
| 2013 |
|
|
58 |
|
|
|
174,273 |
|
|
|
15.34 |
% |
|
|
6,152,384 |
|
|
|
35.30 |
|
|
|
13.75 |
% |
| 2014 |
|
|
44 |
|
|
|
125,241 |
|
|
|
11.02 |
% |
|
|
4,869,724 |
|
|
|
38.88 |
|
|
|
10.88 |
% |
| 2015 |
|
|
29 |
|
|
|
97,754 |
|
|
|
8.60 |
% |
|
|
3,708,132 |
|
|
|
37.93 |
|
|
|
8.29 |
% |
| 2016 and thereafter |
|
|
132 |
|
|
|
533,845 |
|
|
|
46.99 |
% |
|
|
22,538,378 |
|
|
|
42.22 |
|
|
|
50.36 |
% |
|
|
|
|
|
|
|
|
|
|
|
|
|
|
|
|
|
|
|
|
|
|
|
|
|
|
|
|
330 |
|
|
|
1,136,241 |
|
|
|
100.00 |
% |
|
$ |
44,755,501 |
|
|
$ |
39.39 |
|
|
|
100.00 |
% |
|
|
|
|
|
|
|
|
|
|
|
|
|
|
|
|
|
|
|
|
|
|
|
|
|
|
|
|
|
|
| Retail: |
|
|
|
|
|
|
|
|
|
|
|
|
|
|
|
|
| 2011 |
|
|
14 |
|
|
|
27,871 |
|
|
|
1.32 |
% |
|
$ |
675,725 |
|
|
$ |
24.24 |
|
|
|
1.47 |
% |
| 2012 |
|
|
69 |
|
|
|
205,415 |
|
|
|
9.76 |
% |
|
|
4,866,927 |
|
|
|
23.69 |
|
|
|
10.61 |
% |
| 2013 |
|
|
45 |
|
|
|
409,929 |
|
|
|
19.49 |
% |
|
|
6,322,461 |
|
|
|
15.42 |
|
|
|
13.79 |
% |
| 2014 |
|
|
31 |
|
|
|
132,065 |
|
|
|
6.28 |
% |
|
|
2,939,371 |
|
|
|
22.26 |
|
|
|
6.41 |
% |
| 2015 |
|
|
36 |
|
|
|
310,133 |
|
|
|
14.74 |
% |
|
|
6,126,247 |
|
|
|
19.75 |
|
|
|
13.36 |
% |
| 2016 and thereafter |
|
|
112 |
|
|
|
1,018,364 |
|
|
|
48.41 |
% |
|
|
24,935,521 |
|
|
|
24.49 |
|
|
|
54.36 |
% |
|
|
|
|
|
|
|
|
|
|
|
|
|
|
|
|
|
|
|
|
|
|
|
|
|
|
|
|
307 |
|
|
|
2,103,777 |
|
|
|
100.00 |
% |
|
$ |
45,866,252 |
|
|
$ |
21.80 |
|
|
|
100.00 |
% |
|
|
|
|
|
|
|
|
|
|
|
|
|
|
|
|
|
|
|
|
|
|
|
|
|
|
|
|
|
|
| Total: |
|
|
|
|
|
|
|
|
|
|
|
|
|
|
|
|
| 2011 |
|
|
65 |
|
|
|
253,677 |
|
|
|
3.40 |
% |
|
$ |
8,035,727 |
|
|
$ |
31.68 |
|
|
|
3.31 |
% |
| 2012 |
|
|
222 |
|
|
|
826,412 |
|
|
|
11.07 |
% |
|
|
25,833,780 |
|
|
|
31.26 |
|
|
|
10.64 |
% |
| 2013 |
|
|
193 |
|
|
|
1,055,116 |
|
|
|
14.13 |
% |
|
|
27,584,789 |
|
|
|
26.14 |
|
|
|
11.36 |
% |
| 2014 |
|
|
164 |
|
|
|
1,010,416 |
|
|
|
13.53 |
% |
|
|
33,816,572 |
|
|
|
33.47 |
|
|
|
13.93 |
% |
| 2015 |
|
|
138 |
|
|
|
932,370 |
|
|
|
12.49 |
% |
|
|
31,504,994 |
|
|
|
33.79 |
|
|
|
12.98 |
% |
| 2016 and thereafter |
|
|
434 |
|
|
|
3,388,429 |
|
|
|
45.38 |
% |
|
|
115,993,889 |
|
|
|
34.23 |
|
|
|
47.78 |
% |
|
|
|
|
|
|
|
|
|
|
|
|
|
|
|
|
|
|
|
|
|
|
|
|
|
|
|
|
1,216 |
|
|
|
7,466,420 |
|
|
|
100.00 |
% |
|
$ |
242,769,751 |
|
|
$ |
32.51 |
|
|
|
100.00 |
% |
|
|
|
|
|
|
|
|
|
|
|
|
|
|
|
|
|
|
|
|
|
|
|
|
|
Note: Lease expiration data exclude properties classified as sold or held for sale.
| * |
Annualized Rent is equal to the rental rate effective at lease expiration (cash basis) multiplied by 12. |
23

Acquisition Summary
|
|
|
|
|
|
|
|
|
|
|
|
|
|
|
|
|
|
|
|
|
| |
|
|
|
Acquisition Date |
|
Square Feet |
|
|
Leased
Percentage at
Acquisition |
|
|
9/30/2011
Leased
Percentage |
|
|
Investment |
|
| 1140 Connecticut Avenue |
|
Washington, DC |
|
January 11, 2011 |
|
|
184,000 |
|
|
|
99 |
% |
|
|
89 |
% |
|
$ |
80,250 |
|
| 1227 25th Street |
|
Washington, DC |
|
March 30, 2011 |
|
|
130,000 |
|
|
|
72 |
% |
|
|
72 |
% |
|
|
47,000 |
|
| 650 North Glebe Road (1) |
|
Arlington, Virginia |
|
June 15, 2011 |
|
|
land for
development |
|
|
|
N/A |
|
|
|
N/A |
|
|
|
11,800 |
|
| Olney Village Center |
|
Olney, Maryland |
|
August 30, 2011 |
|
|
199,000 |
|
|
|
99 |
% |
|
|
100 |
% |
|
|
58,000 |
|
| Braddock Metro Center |
|
Alexandria, Virginia |
|
September 13, 2011 |
|
|
345,000 |
|
|
|
92 |
% |
|
|
92 |
% |
|
|
101,000 |
|
| John Marshall II |
|
Tysons Corner, Virginia |
|
September 15, 2011 |
|
|
223,000 |
|
|
|
100 |
% |
|
|
100 |
% |
|
|
73,500 |
|
|
|
|
|
|
|
|
|
|
|
|
|
|
|
|
|
|
|
|
|
|
|
|
|
|
Total |
|
|
1,081,000 |
|
|
|
|
|
|
$ |
371,550 |
|
|
|
|
|
|
|
|
|
|
|
|
|
|
|
|
|
|
|
|
|
|
|
|
|
|
|
| Disposition Summary |
|
|
|
|
|
|
|
|
|
|
|
|
|
|
|
|
|
|
|
| |
|
|
|
Disposition Date |
|
Property Type |
|
|
Square Feet |
|
|
Contract
Sales Price |
|
|
GAAP Gain |
|
| Dulles Station, Phase I |
|
Herndon, VA |
|
April 5, 2011 |
|
|
Office |
|
|
|
180,000 |
|
|
$ |
58,800 |
|
|
$ |
— |
|
| Industrial Portfolio, Phase I(2) |
|
Various locations |
|
September 1, 2011 |
|
|
Industrial/
Office |
|
|
|
2,000,000 |
|
|
$ |
235,800 |
|
|
$ |
56,639 |
|
|
|
|
|
|
|
|
|
|
|
|
|
|
|
|
|
|
|
|
|
|
|
|
|
|
|
|
|
|
|
|
|
2,180,000 |
|
|
$ |
294,600 |
|
|
$ |
56,639 |
|
|
|
|
|
|
|
|
|
|
|
|
|
|
|
|
|
|
|
|
|
|
| (1) |
Acquisition of
37,000 square feet of land in a joint venture to develop a six story, 150 unit apartment community. WRIT is a 90% owner of the joint venture. |
| (2) |
The Industrial
Portfolio consists of every industrial property, as well as two office properties, the Crescent and Albemarle Point. We are executing the sale in three phases. Phase I of the Industrial Portfolio sale consists of industrial properties (8880
Gorman Road, Dulles South IV, Fullerton Business Center, Hampton Overlook, Alban Business Center, Pickett Industrial Park, Northern Virginia Industrial Park I, 270 Technology Park, Fullerton Industrial Center, Sully Square, 9950 Business
Parkway, Hampton South and 8900 Telegraph Road) and two office properties (Crescent and Albemarle Point). On October 3, 2011 we closed on Phase II of the sale, consisting of Northern Virginia Industrial Park II. We expect to close on
Phase III of the sale on November 1, 2011, consisting of 6100 Columbia Park Road and Dulles Business Park. |
24

|
|
|
|
|
|
|
|
|
|
|
| PROPERTIES |
|
LOCATION |
|
YEAR
ACQUIRED |
|
YEAR
CONSTRUCTED |
|
NET RENTABLE
SQUARE
FEET* |
|
|
|
|
|
|
| Office Buildings |
|
|
|
|
|
|
|
|
|
|
| 1901 Pennsylvania Avenue |
|
Washington, DC |
|
1977 |
|
1960 |
|
|
97,000 |
|
| 51 Monroe Street |
|
Rockville, MD |
|
1979 |
|
1975 |
|
|
210,000 |
|
| 515 King Street |
|
Alexandria, VA |
|
1992 |
|
1966 |
|
|
76,000 |
|
| 6110 Executive Boulevard |
|
Rockville, MD |
|
1995 |
|
1971 |
|
|
198,000 |
|
| 1220 19th Street |
|
Washington, DC |
|
1995 |
|
1976 |
|
|
102,000 |
|
| 1600 Wilson Boulevard |
|
Arlington, VA |
|
1997 |
|
1973 |
|
|
166,000 |
|
| 7900 Westpark Drive |
|
McLean, VA |
|
1997 |
|
1972/1986/1999 |
|
|
523,000 |
|
| 600 Jefferson Plaza |
|
Rockville, MD |
|
1999 |
|
1985 |
|
|
112,000 |
|
| 1700 Research Boulevard |
|
Rockville, MD |
|
1999 |
|
1982 |
|
|
101,000 |
|
| Wayne Plaza |
|
Silver Spring, MD |
|
2000 |
|
1970 |
|
|
91,000 |
|
| Courthouse Square |
|
Alexandria, VA |
|
2000 |
|
1979 |
|
|
113,000 |
|
| One Central Plaza |
|
Rockville, MD |
|
2001 |
|
1974 |
|
|
267,000 |
|
| The Atrium Building |
|
Rockville, MD |
|
2002 |
|
1980 |
|
|
80,000 |
|
| 1776 G Street |
|
Washington, DC |
|
2003 |
|
1979 |
|
|
263,000 |
|
| 6565 Arlington Boulevard |
|
Falls Church, VA |
|
2006 |
|
1967/1998 |
|
|
132,000 |
|
| West Gude Drive |
|
Rockville, MD |
|
2006 |
|
1984/1986/1988 |
|
|
276,000 |
|
| Monument II |
|
Herndon, VA |
|
2007 |
|
2000 |
|
|
205,000 |
|
| Woodholme Center |
|
Pikesville, MD |
|
2007 |
|
1989 |
|
|
73,000 |
|
| 2000 M Street |
|
Washington, DC |
|
2007 |
|
1971 |
|
|
227,000 |
|
| 2445 M Street |
|
Washington, DC |
|
2008 |
|
1986 |
|
|
290,000 |
|
| 925 Corporate Drive |
|
Stafford, VA |
|
2010 |
|
2007 |
|
|
135,000 |
|
| 1000 Corporate Drive |
|
Stafford, VA |
|
2010 |
|
2009 |
|
|
136,000 |
|
| 1140 Connecticut Avenue |
|
Washington, DC |
|
2011 |
|
1966 |
|
|
184,000 |
|
| 1227 25th Street |
|
Washington, DC |
|
2011 |
|
1988 |
|
|
130,000 |
|
| Braddock Metro Center |
|
Alexandria, VA |
|
2011 |
|
1985 |
|
|
345,000 |
|
| John Marshall II |
|
Tysons Corner, VA |
|
2011 |
|
1996/2010 |
|
|
223,000 |
|
|
|
|
|
|
|
|
|
|
|
|
| Subtotal |
|
|
|
|
|
|
|
|
4,755,000 |
|
|
|
|
|
|
|
|
|
|
|
|
|
|
|
|
|
| Medical Office Buildings |
|
|
|
|
|
|
|
|
|
|
| Woodburn Medical Park I |
|
Annandale, VA |
|
1998 |
|
1984 |
|
|
71,000 |
|
| Woodburn Medical Park II |
|
Annandale, VA |
|
1998 |
|
1988 |
|
|
96,000 |
|
| Prosperity Medical Center I |
|
Merrifield, VA |
|
2003 |
|
2000 |
|
|
92,000 |
|
| Prosperity Medical Center II |
|
Merrifield, VA |
|
2003 |
|
2001 |
|
|
88,000 |
|
| Prosperity Medical Center III |
|
Merrifield, VA |
|
2003 |
|
2002 |
|
|
75,000 |
|
| Shady Grove Medical Village II |
|
Rockville, MD |
|
2004 |
|
1999 |
|
|
66,000 |
|
| 8301 Arlington Boulevard |
|
Fairfax, VA |
|
2004 |
|
1965 |
|
|
49,000 |
|
| Alexandria Professional Center |
|
Alexandria, VA |
|
2006 |
|
1968 |
|
|
113,000 |
|
| 9707 Medical Center Drive |
|
Rockville, MD |
|
2006 |
|
1994 |
|
|
38,000 |
|
| 15001 Shady Grove Road |
|
Rockville, MD |
|
2006 |
|
1999 |
|
|
51,000 |
|
| Plumtree Medical Center |
|
Bel Air, MD |
|
2006 |
|
1991 |
|
|
33,000 |
|
| 15005 Shady Grove Road |
|
Rockville, MD |
|
2006 |
|
2002 |
|
|
52,000 |
|
| 2440 M Street |
|
Washington, DC |
|
2007 |
|
1986/2006 |
|
|
110,000 |
|
| Woodholme Medical Office Building |
|
Pikesville, MD |
|
2007 |
|
1996 |
|
|
125,000 |
|
| Ashburn Office Park |
|
Ashburn, VA |
|
2007 |
|
1998/2000/2002 |
|
|
75,000 |
|
| CentreMed I & II |
|
Centreville, VA |
|
2007 |
|
1998 |
|
|
52,000 |
|
| Sterling Medical Office Building |
|
Sterling, VA |
|
2008 |
|
1986/2000 |
|
|
36,000 |
|
| Lansdowne Medical Office Building |
|
Leesburg, VA |
|
2009 |
|
2009 |
|
|
87,000 |
|
|
|
|
|
|
|
|
|
|
|
|
| Subtotal |
|
|
|
|
|
|
|
|
1,309,000 |
|
|
|
|
|
|
|
|
|
|
|
|
25

|
|
|
|
|
|
|
|
|
|
|
| PROPERTIES |
|
LOCATION |
|
YEAR ACQUIRED |
|
YEAR
CONSTRUCTED |
|
NET RENTABLE
SQUARE FEET* |
|
|
|
|
|
|
| Retail Centers |
|
|
|
|
|
|
|
|
|
|
| Takoma Park |
|
Takoma Park, MD |
|
1963 |
|
1962 |
|
|
51,000 |
|
| Westminster |
|
Westminster, MD |
|
1972 |
|
1969 |
|
|
151,000 |
|
| Concord Centre |
|
Springfield, VA |
|
1973 |
|
1960 |
|
|
76,000 |
|
| Wheaton Park |
|
Wheaton, MD |
|
1977 |
|
1967 |
|
|
72,000 |
|
| Bradlee |
|
Alexandria, VA |
|
1984 |
|
1955 |
|
|
168,000 |
|
| Chevy Chase Metro Plaza |
|
Washington, DC |
|
1985 |
|
1975 |
|
|
49,000 |
|
| Montgomery Village Center |
|
Gaithersburg, MD |
|
1992 |
|
1969 |
|
|
198,000 |
|
| Shoppes of Foxchase (1) |
|
Alexandria, VA |
|
1994 |
|
1960 |
|
|
134,000 |
|
| Frederick County Square |
|
Frederick, MD |
|
1995 |
|
1973 |
|
|
227,000 |
|
| 800 S. Washington Street |
|
Alexandria, VA |
|
1998/2003 |
|
1955/1959 |
|
|
44,000 |
|
| Centre at Hagerstown |
|
Hagerstown, MD |
|
2002 |
|
2000 |
|
|
332,000 |
|
| Frederick Crossing |
|
Frederick, MD |
|
2005 |
|
1999/2003 |
|
|
295,000 |
|
| Randolph Shopping Center |
|
Rockville, MD |
|
2006 |
|
1972 |
|
|
82,000 |
|
| Montrose Shopping Center |
|
Rockville, MD |
|
2006 |
|
1970 |
|
|
143,000 |
|
| Gateway Overlook |
|
Columbia, MD |
|
2010 |
|
2007 |
|
|
223,000 |
|
| Olney Village Center |
|
Olney, MD |
|
2011 |
|
1979/2003 |
|
|
199,000 |
|
|
|
|
|
|
|
|
|
|
|
|
| Subtotal |
|
|
|
|
|
|
|
|
2,444,000 |
|
|
|
|
|
|
|
|
|
|
|
|
|
|
|
|
|
| Multifamily Buildings * / # units |
|
|
|
|
|
|
|
|
|
|
| 3801 Connecticut Avenue / 308 |
|
Washington, DC |
|
1963 |
|
1951 |
|
|
179,000 |
|
| Roosevelt Towers / 191 |
|
Falls Church, VA |
|
1965 |
|
1964 |
|
|
170,000 |
|
| Country Club Towers / 227 |
|
Arlington, VA |
|
1969 |
|
1965 |
|
|
163,000 |
|
| Park Adams / 200 |
|
Arlington, VA |
|
1969 |
|
1959 |
|
|
173,000 |
|
| Munson Hill Towers / 279 |
|
Falls Church, VA |
|
1970 |
|
1963 |
|
|
259,000 |
|
| The Ashby at McLean / 256 |
|
McLean, VA |
|
1996 |
|
1982 |
|
|
252,000 |
|
| Walker House Apartments / 212 |
|
Gaithersburg, MD |
|
1996 |
|
1971/2003
(2) |
|
|
159,000 |
|
| Bethesda Hill Apartments / 195 |
|
Bethesda, MD |
|
1997 |
|
1986 |
|
|
226,000 |
|
| Bennett Park / 224 |
|
Arlington, VA |
|
2007 |
|
2007 |
|
|
214,000 |
|
| Clayborne / 74 |
|
Alexandria, VA |
|
2008 |
|
2008 |
|
|
60,000 |
|
| Kenmore Apartments / 374 |
|
Washington, DC |
|
2008 |
|
1948 |
|
|
270,000 |
|
|
|
|
|
|
|
|
|
|
|
|
| Subtotal (2,540 units) |
|
|
|
|
|
|
|
|
2,125,000 |
|
|
|
|
|
|
|
|
|
|
|
|
|
|
|
|
|
| Industrial Distribution / Flex Properties |
|
|
|
|
|
|
|
|
|
|
| Northern Virginia Industrial Park II |
|
Lorton, VA |
|
1998 |
|
1968/1991 |
|
|
570,000 |
|
| Dulles Business Park |
|
Chantilly, VA |
|
2004/2005 |
|
1999-2005 |
|
|
324,000 |
|
| 6100 Columbia Park Road |
|
Landover, MD |
|
2008 |
|
1969 |
|
|
150,000 |
|
|
|
|
|
|
|
|
|
|
|
|
| Subtotal |
|
|
|
|
|
|
|
|
1,044,000 |
|
|
|
|
|
|
|
|
|
|
|
|
|
|
|
|
|
| TOTAL |
|
|
|
|
|
|
|
|
11,677,000 |
|
|
|
|
|
|
|
|
|
|
|
|
| * |
Multifamily buildings are presented in gross square feet. |
| (1) |
Development on approximately 60,000 square feet of the center was completed in December 2006. |
| (2) |
A 16 unit addition referred to as The Gardens at Walker House was completed in October 2003. |
26

Adjusted EBITDA (a non-GAAP measure) is earnings attributable to the controlling interest before interest
expense, taxes, depreciation, amortization, real estate impairment, gain on sale of real estate, gain/loss on extinguishment of debt and gain/loss from non-disposal activities.
Annualized base rent (“ABR”) is calculated as monthly base rent (cash basis) per the lease, as of the reporting period, multiplied by 12.
Debt service coverage ratio is computed by dividing earnings attributable to the controlling interest before interest expense, taxes,
depreciation, amortization, real estate impairment, gain on sale of real estate, gain/loss on extinguishment of debt and gain/loss from non-disposal activities by interest expense (including interest expense from discontinued operations) and
principal amortization.
Debt to total market capitalization is total debt from the balance sheet divided by the sum of total debt from
the balance sheet plus the market value of shares outstanding at the end of the period.
Earnings to fixed charges ratio is computed by
dividing earnings attributable to the controlling interest by fixed charges. For this purpose, earnings consist of income from continuing operations (or net income if there are no discontinued operations) plus fixed charges, less capitalized
interest. Fixed charges consist of interest expense (excluding interest expense from discontinued operations), including amortized costs of debt issuance, plus interest costs capitalized.
Economic occupancy is calculated as actual real estate rental revenue recognized for the period indicated as a percentage of gross potential real estate rental revenue for that period. We determine
gross potential real estate rental revenue by valuing occupied units or square footage at contract rates and vacant units or square footage at market rates for comparable properties. We do not consider percentage rents and expense reimbursements in
computing economic occupancy percentages.
Funds from operations (“FFO”) is defined by The National Association of Real
Estate Investment Trusts, Inc. (“NAREIT”) in an April, 2002 White Paper as net income (computed in accordance with generally accepted accounting principles (“GAAP”)) excluding gains (or losses) associated with sales of property
plus real estate depreciation and amortization. We consider FFO to be a standard supplemental measure for equity real estate investment trusts (“REITs”) because it facilitates an understanding of the operating performance of our properties
without giving effect to real estate depreciation and amortization, which historically assumes that the value of real estate assets diminishes predictably over time. Since real estate values have instead historically risen or fallen with market
conditions, we believe that FFO more accurately provides investors an indication of our ability to incur and service debt, make capital expenditures and fund other needs. FFO is a non-GAAP measure.
Core Funds From Operations (“Core FFO”) is calculated by adjusting FFO for the following items (which we believe are not indicative of
the performance of WRIT’s operating portfolio and affect the comparative measurement of WRIT’s operating performance over time): (1) gains or losses on extinguishment of debt, (2) costs related to the acquisition of properties
and (3) property impairments, as appropriate. These items can vary greatly from period to period, depending upon the volume of our acquisition activity and debt retirements, among other factors. We believe that by excluding these items, Core
FFO serves as a useful, supplementary measure of WRIT’s ability to incur and service debt, and distribute dividends to its shareholders. Core FFO is a non-GAAP and non-standardized measure, and may be calculated differently by other REITs.
Funds Available for Distribution (“FAD”) is calculated by subtracting from FFO (1) recurring expenditures, tenant
improvements and leasing costs, that are capitalized and amortized and are necessary to maintain our properties and revenue stream and (2) straight line rents, then adding (3) non-real estate depreciation and amortization,
(4) non-cash fair value interest expense and (5) amortization of restricted share compensation, then adding or subtracting the (6) amortization of lease intangibles , (7) real estate impairment and (8) non-cash gain/loss on
extinguishment of debt, as appropriate. FAD is included herein, because we consider it to be a measure of a REIT’s ability to incur and service debt and to distribute dividends to its shareholders. FAD is a non-GAAP and non-standardized
measure, and may be calculated differently by other REITs.
Core Funds Available for Distribution (“Core FAD”) is calculated
by adjusting FAD for the following items (which we believe are not indicative of the performance of WRIT’s operating portfolio and affect the comparative measurement of WRIT’s operating performance over time): (1) gains or losses on
extinguishment of debt, (2) costs related to the acquisition of properties and (3) property impairments, as appropriate. These items can vary greatly from period to period, depending upon the volume of our acquisition activity and debt
retirements, among other factors. We believe that by excluding these items, Core FFO serves as a useful, supplementary measure of WRIT’s ability to incur and service debt, and distribute dividends to its shareholders. Core FFO is a non-GAAP and
non-standardized measure, and may be calculated differently by other REITs.
The Industrial Portfolio consists of every industrial
property, as well as two office properties, the Crescent and Albemarle Point. We are executing the sale in three phases. Phase I of the Industrial Portfolio sale consists of industrial properties (8880 Gorman Road, Dulles South IV,
Fullerton Business Center, Hampton Overlook, Alban Business Center, Pickett Industrial Park, Northern Virginia Industrial Park I, 270 Technology Park, Fullerton Industrial Center, Sully Square, 9950 Business Parkway, Hampton South and 8900
Telegraph Road) and two office properties (Crescent and Albemarle Point). On October 3, 2011 we closed on Phase II of the Industrial Portfolio sale, consisting of Northern Virginia Industrial Park II. We expect to close on
Phase III of the Industrial Portfolio sale on November 1, 2011, consisting of 6100 Columbia Park Road and Dulles Business Park.
Physical occupancy is calculated as occupied square footage as a percentage of total square footage as of the last day of that period.
Recurring capital expenditures represent non-accretive building improvements and leasing costs required to maintain current revenues. Recurring
capital expenditures do not include acquisition capital that was taken into consideration when underwriting the purchase of a building or which are incurred to bring a building up to “operating standard.”
27
Rent increases on renewals and rollovers are calculated as the difference, weighted by square feet,
of the net ABR due the first month after a term commencement date and the net ABR due the last month prior to the termination date of the former tenant’s term.
Same-store portfolio properties include all properties that were owned for the entirety of the current and prior year reporting periods.
Same-store portfolio net operating income (NOI) growth is the change in the NOI of the same-store portfolio properties from the prior reporting period to the current reporting period.
28